
|
|||||
|
 | |
| |
| |
| |
| |
| |
|
Gene: SOGA1 |
Gene summary for SOGA1 |
| Gene information | Species | Human | Gene symbol | SOGA1 | Gene ID | 140710 |
| Gene name | suppressor of glucose, autophagy associated 1 | |
| Gene Alias | C20orf117 | |
| Cytomap | 20q11.23 | |
| Gene Type | protein-coding | GO ID | GO:0005975 | UniProtAcc | O94964 |
Top |
Malignant transformation analysis |
| Identification of the aberrant gene expression in precancerous and cancerous lesions by comparing the gene expression of stem-like cells in diseased tissues with normal stem cells |
| Entrez ID | Symbol | Replicates | Species | Organ | Tissue | Adj P-value | Log2FC | Malignancy |
| 140710 | SOGA1 | LZE4T | Human | Esophagus | ESCC | 1.32e-03 | 1.11e-01 | 0.0811 |
| 140710 | SOGA1 | LZE7T | Human | Esophagus | ESCC | 9.34e-03 | 2.77e-01 | 0.0667 |
| 140710 | SOGA1 | LZE24T | Human | Esophagus | ESCC | 2.86e-07 | 2.51e-01 | 0.0596 |
| 140710 | SOGA1 | P1T-E | Human | Esophagus | ESCC | 3.67e-05 | 2.73e-01 | 0.0875 |
| 140710 | SOGA1 | P2T-E | Human | Esophagus | ESCC | 4.80e-13 | 2.90e-01 | 0.1177 |
| 140710 | SOGA1 | P4T-E | Human | Esophagus | ESCC | 3.42e-05 | 1.69e-01 | 0.1323 |
| 140710 | SOGA1 | P5T-E | Human | Esophagus | ESCC | 6.63e-03 | 7.30e-02 | 0.1327 |
| 140710 | SOGA1 | P8T-E | Human | Esophagus | ESCC | 2.96e-11 | 1.94e-01 | 0.0889 |
| 140710 | SOGA1 | P9T-E | Human | Esophagus | ESCC | 4.99e-10 | 2.19e-01 | 0.1131 |
| 140710 | SOGA1 | P10T-E | Human | Esophagus | ESCC | 7.56e-15 | 3.65e-01 | 0.116 |
| 140710 | SOGA1 | P11T-E | Human | Esophagus | ESCC | 2.95e-06 | 2.25e-01 | 0.1426 |
| 140710 | SOGA1 | P12T-E | Human | Esophagus | ESCC | 7.24e-14 | 3.28e-01 | 0.1122 |
| 140710 | SOGA1 | P15T-E | Human | Esophagus | ESCC | 6.10e-20 | 4.31e-01 | 0.1149 |
| 140710 | SOGA1 | P16T-E | Human | Esophagus | ESCC | 1.55e-09 | 2.29e-01 | 0.1153 |
| 140710 | SOGA1 | P20T-E | Human | Esophagus | ESCC | 1.34e-14 | 2.73e-01 | 0.1124 |
| 140710 | SOGA1 | P21T-E | Human | Esophagus | ESCC | 7.24e-19 | 3.58e-01 | 0.1617 |
| 140710 | SOGA1 | P22T-E | Human | Esophagus | ESCC | 1.12e-09 | 2.24e-01 | 0.1236 |
| 140710 | SOGA1 | P23T-E | Human | Esophagus | ESCC | 2.53e-03 | 1.30e-01 | 0.108 |
| 140710 | SOGA1 | P26T-E | Human | Esophagus | ESCC | 4.61e-16 | 2.85e-01 | 0.1276 |
| 140710 | SOGA1 | P27T-E | Human | Esophagus | ESCC | 8.44e-11 | 2.07e-01 | 0.1055 |
| Page: 1 2 3 4 |
| Tissue | Expression Dynamics | Abbreviation |
| Esophagus | 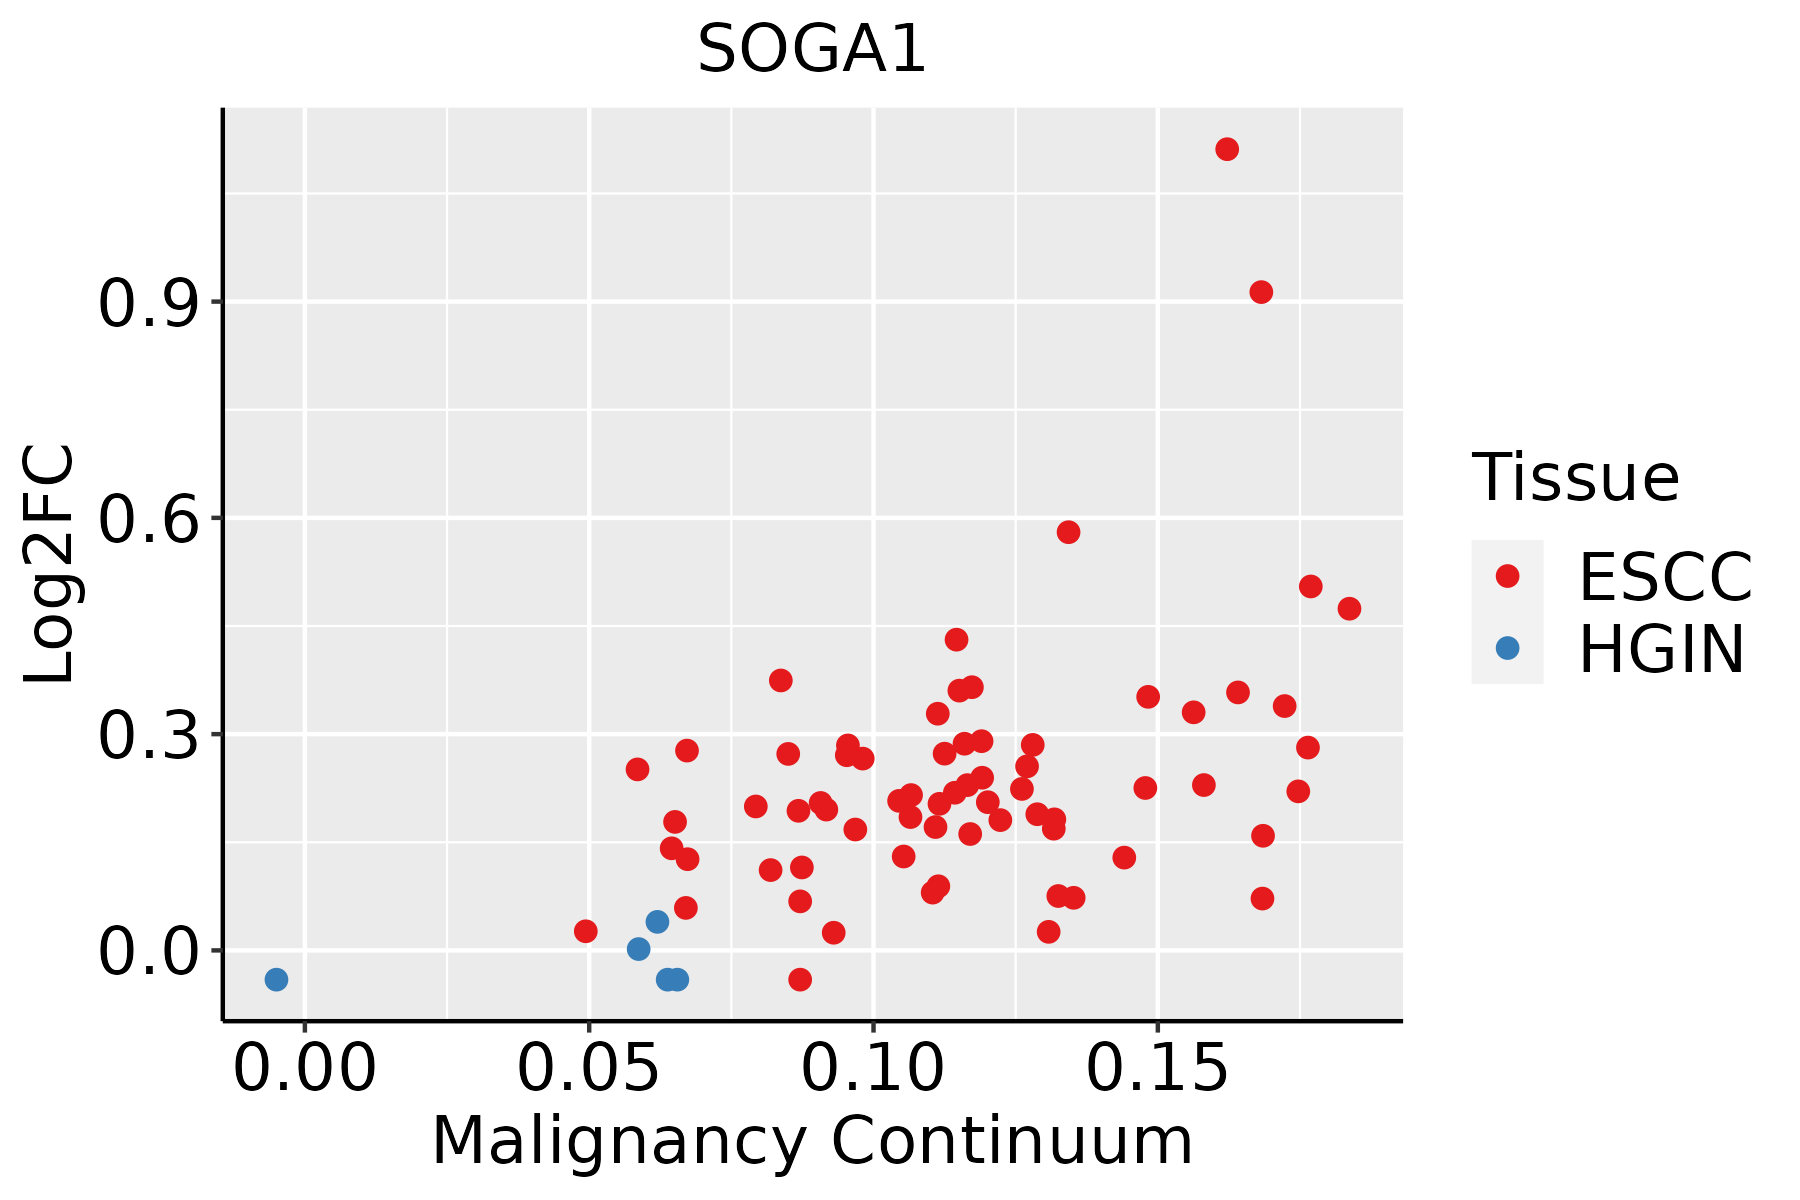 | ESCC: Esophageal squamous cell carcinoma |
| HGIN: High-grade intraepithelial neoplasias | ||
| LGIN: Low-grade intraepithelial neoplasias | ||
| Liver | 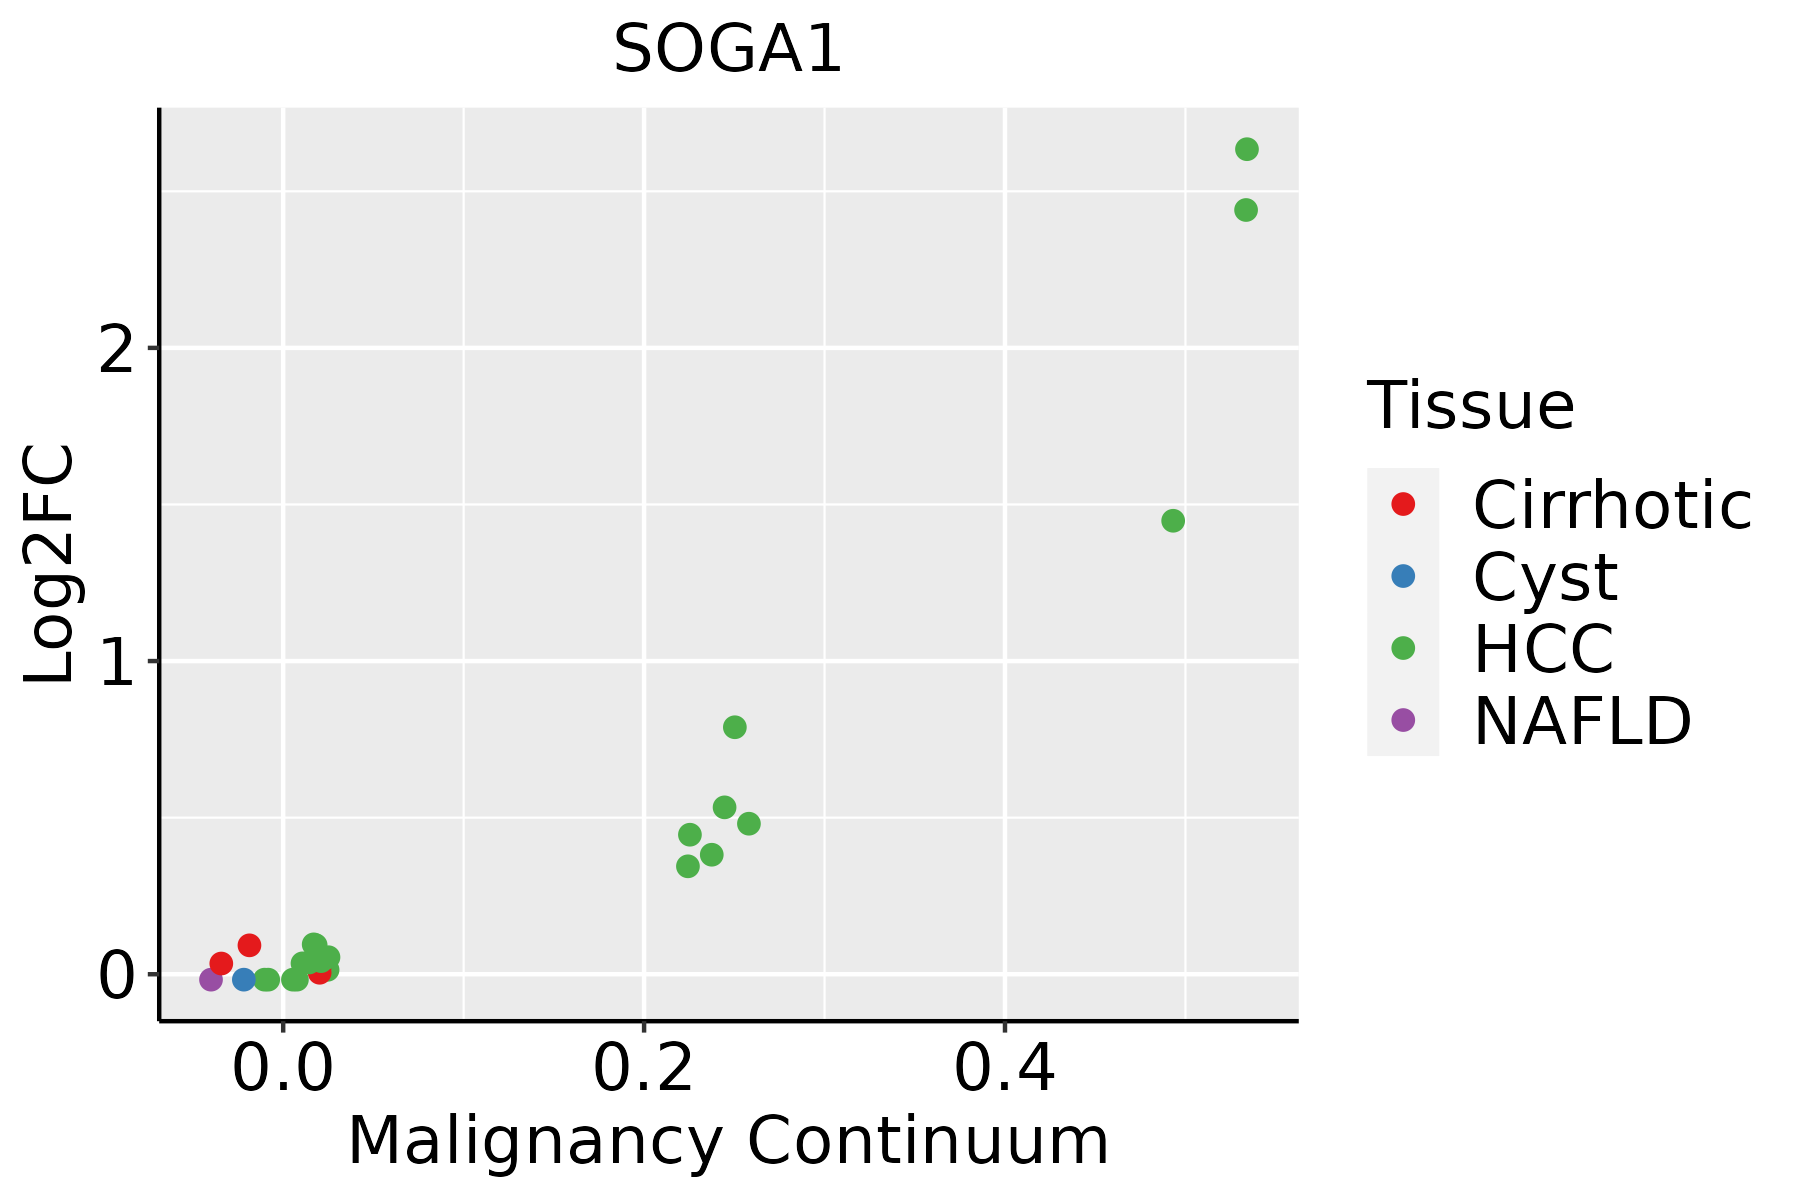 | HCC: Hepatocellular carcinoma |
| NAFLD: Non-alcoholic fatty liver disease | ||
| Thyroid | 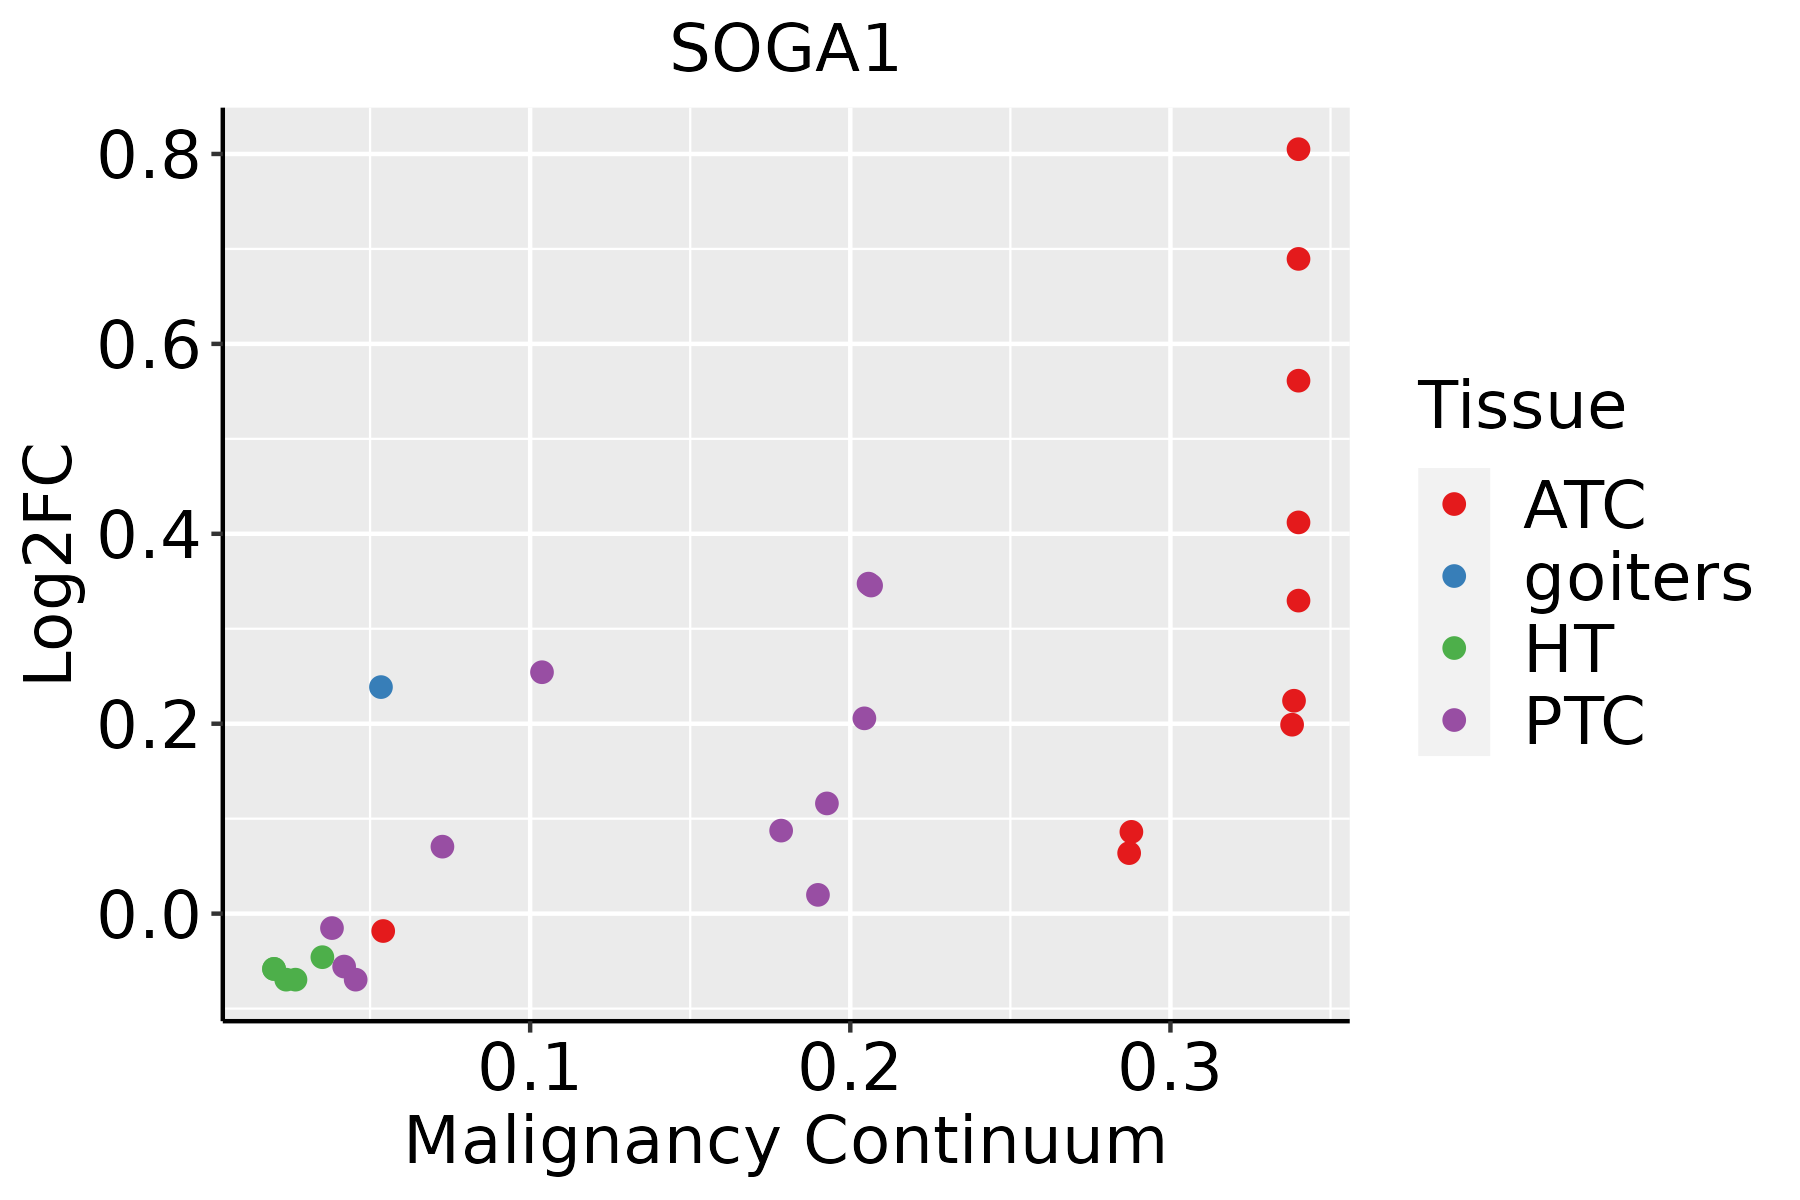 | ATC: Anaplastic thyroid cancer |
| HT: Hashimoto's thyroiditis | ||
| PTC: Papillary thyroid cancer |
| ∗log2FC in expression of this searched gene in stem-like cells from each diseased tissue sample relative to stem-like cells in normal samples in each tissue plotted against the malignancy continuum. Samples are colored based on if they are from different disease stage. |
Top |
Malignant transformation related pathway analysis |
| Find out the enriched GO biological processes and KEGG pathways involved in transition from healthy to precancer to cancer |
| Tissue | Disease Stage | Enriched GO biological Processes |
| Colorectum | AD |  |
| Colorectum | SER |  |
| Colorectum | MSS |  |
| Colorectum | MSI-H |  |
| Colorectum | FAP |  |
| ∗Top 15 enriched GO BP terms are showed in the bar plot of each disease state in each tissue. Each row represents a significant GO biological process which is colored according to the -log10(p.adjust). |
| Page: 1 2 3 4 5 6 7 8 9 |
| GO ID | Tissue | Disease Stage | Description | Gene Ratio | Bg Ratio | pvalue | p.adjust | Count |
| GO:001050617 | Esophagus | ESCC | regulation of autophagy | 220/8552 | 317/18723 | 6.72e-18 | 6.36e-16 | 220 |
| GO:00059969 | Esophagus | ESCC | monosaccharide metabolic process | 159/8552 | 257/18723 | 1.11e-07 | 1.81e-06 | 159 |
| GO:00193189 | Esophagus | ESCC | hexose metabolic process | 147/8552 | 237/18723 | 2.63e-07 | 3.94e-06 | 147 |
| GO:190165319 | Esophagus | ESCC | cellular response to peptide | 208/8552 | 359/18723 | 1.68e-06 | 2.01e-05 | 208 |
| GO:0043434111 | Esophagus | ESCC | response to peptide hormone | 234/8552 | 414/18723 | 4.93e-06 | 5.21e-05 | 234 |
| GO:003286918 | Esophagus | ESCC | cellular response to insulin stimulus | 124/8552 | 203/18723 | 6.63e-06 | 6.75e-05 | 124 |
| GO:003286818 | Esophagus | ESCC | response to insulin | 156/8552 | 264/18723 | 7.21e-06 | 7.20e-05 | 156 |
| GO:00060069 | Esophagus | ESCC | glucose metabolic process | 119/8552 | 196/18723 | 1.51e-05 | 1.36e-04 | 119 |
| GO:007137516 | Esophagus | ESCC | cellular response to peptide hormone stimulus | 166/8552 | 290/18723 | 4.48e-05 | 3.55e-04 | 166 |
| GO:00442626 | Esophagus | ESCC | cellular carbohydrate metabolic process | 160/8552 | 283/18723 | 1.43e-04 | 9.66e-04 | 160 |
| GO:00160514 | Esophagus | ESCC | carbohydrate biosynthetic process | 117/8552 | 202/18723 | 2.96e-04 | 1.79e-03 | 117 |
| GO:00620129 | Esophagus | ESCC | regulation of small molecule metabolic process | 184/8552 | 334/18723 | 3.11e-04 | 1.85e-03 | 184 |
| GO:00463643 | Esophagus | ESCC | monosaccharide biosynthetic process | 52/8552 | 82/18723 | 9.03e-04 | 4.61e-03 | 52 |
| GO:00109065 | Esophagus | ESCC | regulation of glucose metabolic process | 71/8552 | 119/18723 | 1.46e-03 | 6.92e-03 | 71 |
| GO:00193193 | Esophagus | ESCC | hexose biosynthetic process | 49/8552 | 78/18723 | 1.69e-03 | 7.81e-03 | 49 |
| GO:00061096 | Esophagus | ESCC | regulation of carbohydrate metabolic process | 101/8552 | 178/18723 | 1.89e-03 | 8.52e-03 | 101 |
| GO:00106755 | Esophagus | ESCC | regulation of cellular carbohydrate metabolic process | 83/8552 | 146/18723 | 4.24e-03 | 1.69e-02 | 83 |
| GO:00060943 | Esophagus | ESCC | gluconeogenesis | 46/8552 | 75/18723 | 4.54e-03 | 1.78e-02 | 46 |
| GO:00082869 | Esophagus | ESCC | insulin receptor signaling pathway | 66/8552 | 116/18723 | 9.76e-03 | 3.37e-02 | 66 |
| GO:001050621 | Liver | HCC | regulation of autophagy | 210/7958 | 317/18723 | 7.59e-18 | 8.45e-16 | 210 |
| Page: 1 2 3 4 |
| Pathway ID | Tissue | Disease Stage | Description | Gene Ratio | Bg Ratio | pvalue | p.adjust | qvalue | Count |
| Page: 1 |
Top |
Cell-cell communication analysis |
| Identification of potential cell-cell interactions between two cell types and their ligand-receptor pairs for different disease states |
| Ligand | Receptor | LRpair | Pathway | Tissue | Disease Stage |
| Page: 1 |
Top |
Single-cell gene regulatory network inference analysis |
| Find out the significant the regulons (TFs) and the target genes of each regulon across cell types for different disease states |
| TF | Cell Type | Tissue | Disease Stage | Target Gene | RSS | Regulon Activity |
| ∗The dot plots of a searched regulon are shown for all cell subpopulations in each disease state of each tissue based on the regulon specific score inferred using pySCENIC and by calculating the average expression. |
| Page: 1 |
Top |
Somatic mutation of malignant transformation related genes |
| Annotation of somatic variants for genes involved in malignant transformation |
| Hugo Symbol | Variant Class | Variant Classification | dbSNP RS | HGVSc | HGVSp | HGVSp Short | SWISSPROT | BIOTYPE | SIFT | PolyPhen | Tumor Sample Barcode | Tissue | Histology | Sex | Age | Stage | Therapy Types | Drugs | Outcome |
| SOGA1 | SNV | Missense_Mutation | novel | c.4244N>A | p.Arg1415His | p.R1415H | O94964 | protein_coding | deleterious(0) | probably_damaging(0.998) | TCGA-5L-AAT1-01 | Breast | breast invasive carcinoma | Female | <65 | III/IV | Hormone Therapy | letrozol | SD |
| SOGA1 | SNV | Missense_Mutation | novel | c.4943C>G | p.Ser1648Cys | p.S1648C | O94964 | protein_coding | tolerated(0.11) | benign(0.049) | TCGA-A2-A0CL-01 | Breast | breast invasive carcinoma | Female | <65 | III/IV | Chemotherapy | cytoxan | SD |
| SOGA1 | SNV | Missense_Mutation | c.2147G>T | p.Arg716Leu | p.R716L | O94964 | protein_coding | deleterious(0) | probably_damaging(0.998) | TCGA-A2-A0YH-01 | Breast | breast invasive carcinoma | Female | <65 | III/IV | Chemotherapy | adriamycin | SD | |
| SOGA1 | SNV | Missense_Mutation | rs868537647 | c.1853N>T | p.Thr618Met | p.T618M | O94964 | protein_coding | deleterious(0) | probably_damaging(0.999) | TCGA-A8-A09Z-01 | Breast | breast invasive carcinoma | Female | >=65 | I/II | Unknown | Unknown | SD |
| SOGA1 | SNV | Missense_Mutation | novel | c.3782N>A | p.Arg1261His | p.R1261H | O94964 | protein_coding | deleterious(0) | probably_damaging(0.999) | TCGA-AN-A046-01 | Breast | breast invasive carcinoma | Female | >=65 | I/II | Unknown | Unknown | SD |
| SOGA1 | SNV | Missense_Mutation | c.1619N>G | p.Leu540Arg | p.L540R | O94964 | protein_coding | deleterious(0) | probably_damaging(0.999) | TCGA-AN-A0AT-01 | Breast | breast invasive carcinoma | Female | <65 | I/II | Unknown | Unknown | SD | |
| SOGA1 | SNV | Missense_Mutation | c.4838N>T | p.Ala1613Val | p.A1613V | O94964 | protein_coding | tolerated(0.39) | benign(0.129) | TCGA-AR-A24H-01 | Breast | breast invasive carcinoma | Female | >=65 | I/II | Hormone Therapy | tamoxiphen | SD | |
| SOGA1 | SNV | Missense_Mutation | rs759599530 | c.983N>G | p.Glu328Gly | p.E328G | O94964 | protein_coding | deleterious(0) | probably_damaging(0.983) | TCGA-BH-A0HO-01 | Breast | breast invasive carcinoma | Female | <65 | I/II | Chemotherapy | cyclophosphamide | SD |
| SOGA1 | SNV | Missense_Mutation | rs757364245 | c.691N>A | p.Glu231Lys | p.E231K | O94964 | protein_coding | deleterious(0) | probably_damaging(0.994) | TCGA-D8-A27G-01 | Breast | breast invasive carcinoma | Female | >=65 | I/II | Unknown | Unknown | SD |
| SOGA1 | SNV | Missense_Mutation | novel | c.3194N>G | p.Tyr1065Cys | p.Y1065C | O94964 | protein_coding | deleterious(0) | probably_damaging(0.998) | TCGA-E2-A56Z-01 | Breast | breast invasive carcinoma | Female | >=65 | I/II | Hormone Therapy | arimidex | SD |
| Page: 1 2 3 4 5 6 7 8 9 10 11 12 13 14 15 16 |
Top |
Related drugs of malignant transformation related genes |
| Identification of chemicals and drugs interact with genes involved in malignant transfromation |
| (DGIdb 4.0) |
| Entrez ID | Symbol | Category | Interaction Types | Drug Claim Name | Drug Name | PMIDs |
| Page: 1 |

Copyright 2023-Present -The University of Texas Health Science Center at Houston |