
|
|||||
|
 | |
| |
| |
| |
| |
| |
|
Gene: SOD3 |
Gene summary for SOD3 |
| Gene information | Species | Human | Gene symbol | SOD3 | Gene ID | 6649 |
| Gene name | superoxide dismutase 3 | |
| Gene Alias | EC-SOD | |
| Cytomap | 4p15.2 | |
| Gene Type | protein-coding | GO ID | GO:0000302 | UniProtAcc | A0A140VJU8 |
Top |
Malignant transformation analysis |
| Identification of the aberrant gene expression in precancerous and cancerous lesions by comparing the gene expression of stem-like cells in diseased tissues with normal stem cells |
| Entrez ID | Symbol | Replicates | Species | Organ | Tissue | Adj P-value | Log2FC | Malignancy |
| 6649 | SOD3 | HTA11_3410_2000001011 | Human | Colorectum | AD | 3.31e-07 | 1.86e-01 | 0.0155 |
| 6649 | SOD3 | HTA11_2487_2000001011 | Human | Colorectum | SER | 4.68e-08 | 2.29e-01 | -0.1808 |
| 6649 | SOD3 | HTA11_1938_2000001011 | Human | Colorectum | AD | 1.06e-19 | 8.85e-01 | -0.0811 |
| 6649 | SOD3 | HTA11_78_2000001011 | Human | Colorectum | AD | 2.35e-06 | 2.99e-01 | -0.1088 |
| 6649 | SOD3 | HTA11_347_2000001011 | Human | Colorectum | AD | 1.86e-11 | 2.83e-01 | -0.1954 |
| 6649 | SOD3 | HTA11_411_2000001011 | Human | Colorectum | SER | 2.78e-05 | 3.19e-01 | -0.2602 |
| 6649 | SOD3 | HTA11_2112_2000001011 | Human | Colorectum | SER | 1.90e-02 | 3.25e-01 | -0.2196 |
| 6649 | SOD3 | HTA11_696_2000001011 | Human | Colorectum | AD | 7.85e-16 | 3.66e-01 | -0.1464 |
| 6649 | SOD3 | HTA11_866_2000001011 | Human | Colorectum | AD | 6.22e-04 | 2.08e-01 | -0.1001 |
| 6649 | SOD3 | HTA11_1391_2000001011 | Human | Colorectum | AD | 9.45e-06 | 1.57e-01 | -0.059 |
| 6649 | SOD3 | HTA11_2992_2000001011 | Human | Colorectum | SER | 2.31e-08 | 4.10e-01 | -0.1706 |
| 6649 | SOD3 | HTA11_546_2000001011 | Human | Colorectum | AD | 1.43e-09 | 3.34e-01 | -0.0842 |
| 6649 | SOD3 | HTA11_7862_2000001011 | Human | Colorectum | AD | 1.24e-02 | 1.48e-01 | -0.0179 |
| 6649 | SOD3 | HTA11_866_3004761011 | Human | Colorectum | AD | 1.67e-10 | 2.43e-01 | 0.096 |
| 6649 | SOD3 | HTA11_4255_2000001011 | Human | Colorectum | SER | 3.34e-04 | 3.23e-01 | 0.0446 |
| 6649 | SOD3 | HTA11_8622_2000001021 | Human | Colorectum | SER | 1.95e-07 | 2.95e-01 | 0.0528 |
| 6649 | SOD3 | HTA11_10711_2000001011 | Human | Colorectum | AD | 1.28e-04 | 1.71e-01 | 0.0338 |
| 6649 | SOD3 | HTA11_6818_2000001011 | Human | Colorectum | AD | 2.86e-09 | 3.48e-01 | 0.0112 |
| 6649 | SOD3 | HTA11_6818_2000001021 | Human | Colorectum | AD | 1.35e-57 | 1.96e+00 | 0.0588 |
| 6649 | SOD3 | HTA11_99999973899_84307 | Human | Colorectum | MSS | 5.98e-12 | 6.98e-01 | 0.2585 |
| Page: 1 2 3 4 5 6 |
| Tissue | Expression Dynamics | Abbreviation |
| Colorectum (GSE201348) |  | FAP: Familial adenomatous polyposis |
| CRC: Colorectal cancer | ||
| Colorectum (HTA11) |  | AD: Adenomas |
| SER: Sessile serrated lesions | ||
| MSI-H: Microsatellite-high colorectal cancer | ||
| MSS: Microsatellite stable colorectal cancer | ||
| Esophagus |  | ESCC: Esophageal squamous cell carcinoma |
| HGIN: High-grade intraepithelial neoplasias | ||
| LGIN: Low-grade intraepithelial neoplasias | ||
| Liver |  | HCC: Hepatocellular carcinoma |
| NAFLD: Non-alcoholic fatty liver disease | ||
| Oral Cavity | 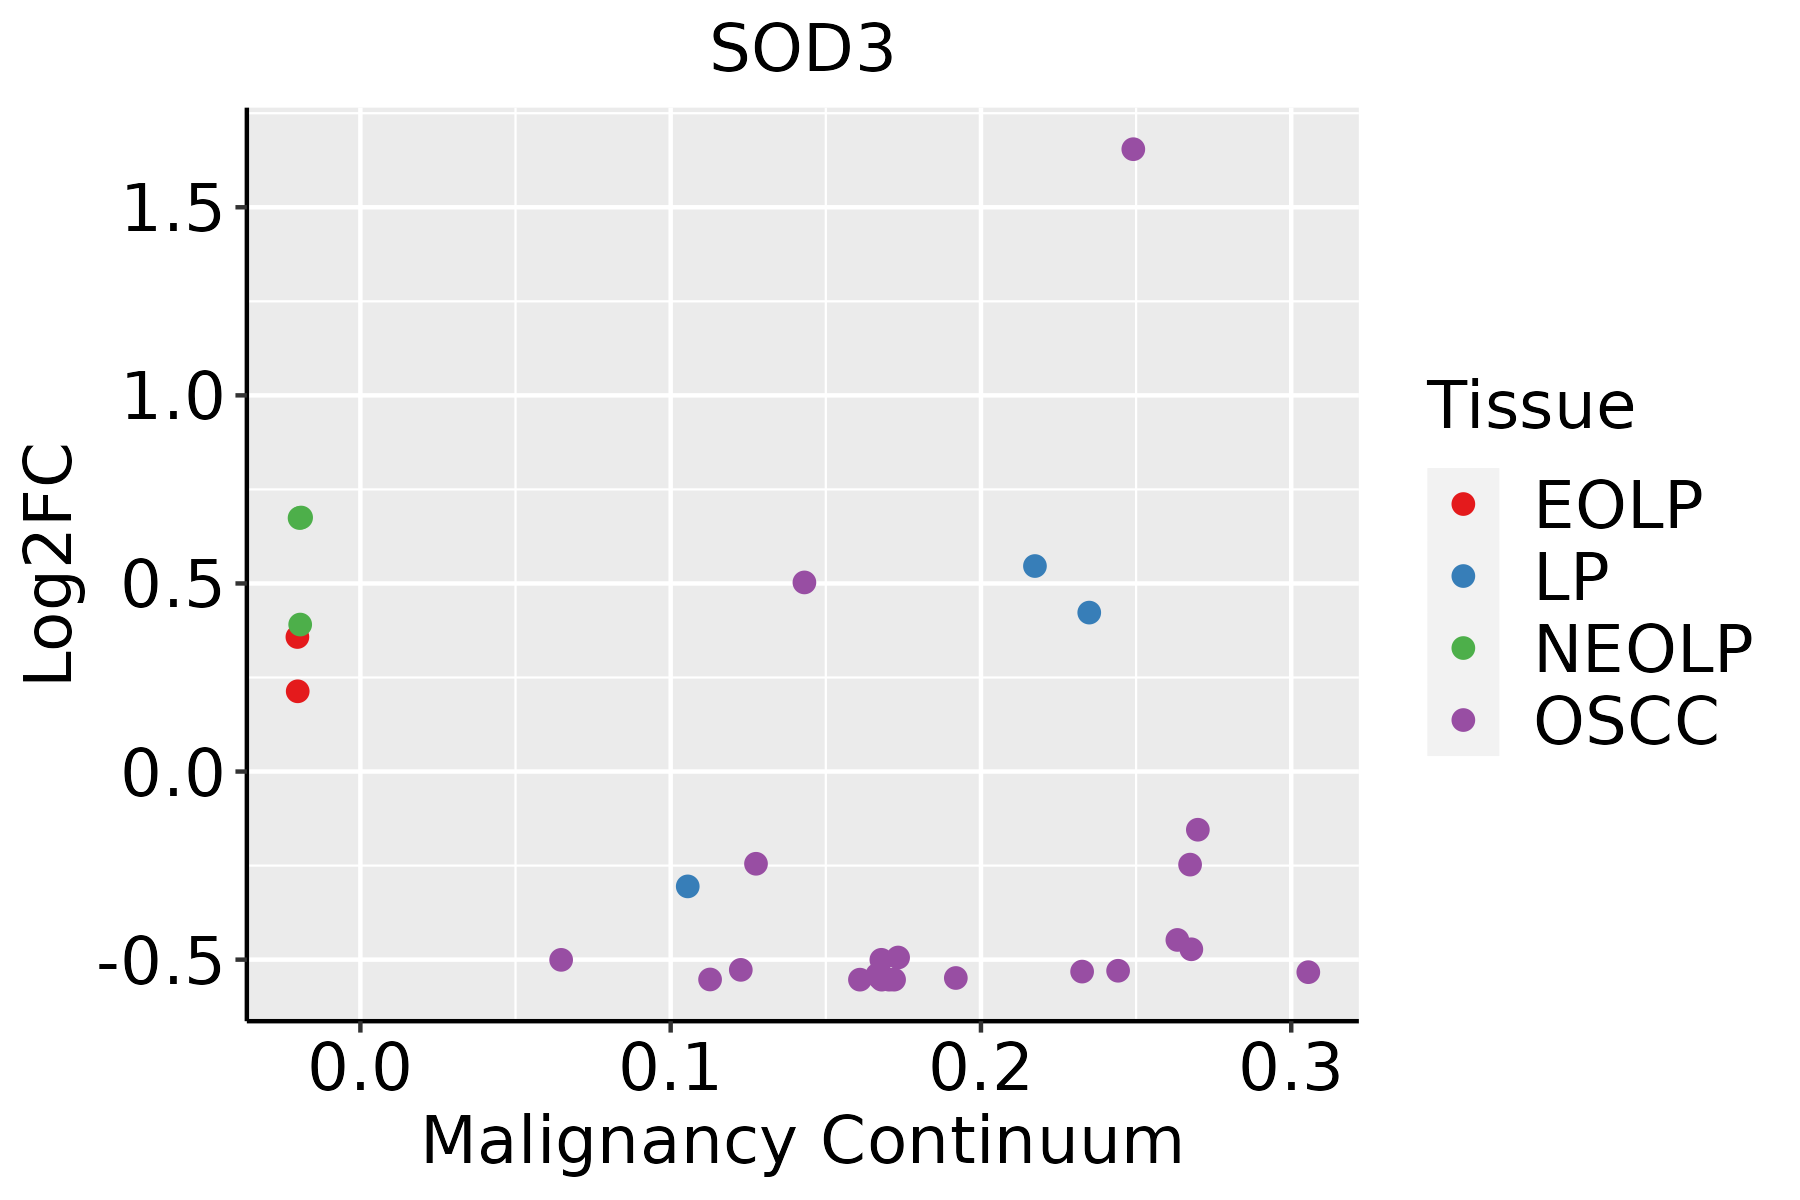 | EOLP: Erosive Oral lichen planus |
| LP: leukoplakia | ||
| NEOLP: Non-erosive oral lichen planus | ||
| OSCC: Oral squamous cell carcinoma | ||
| Prostate | 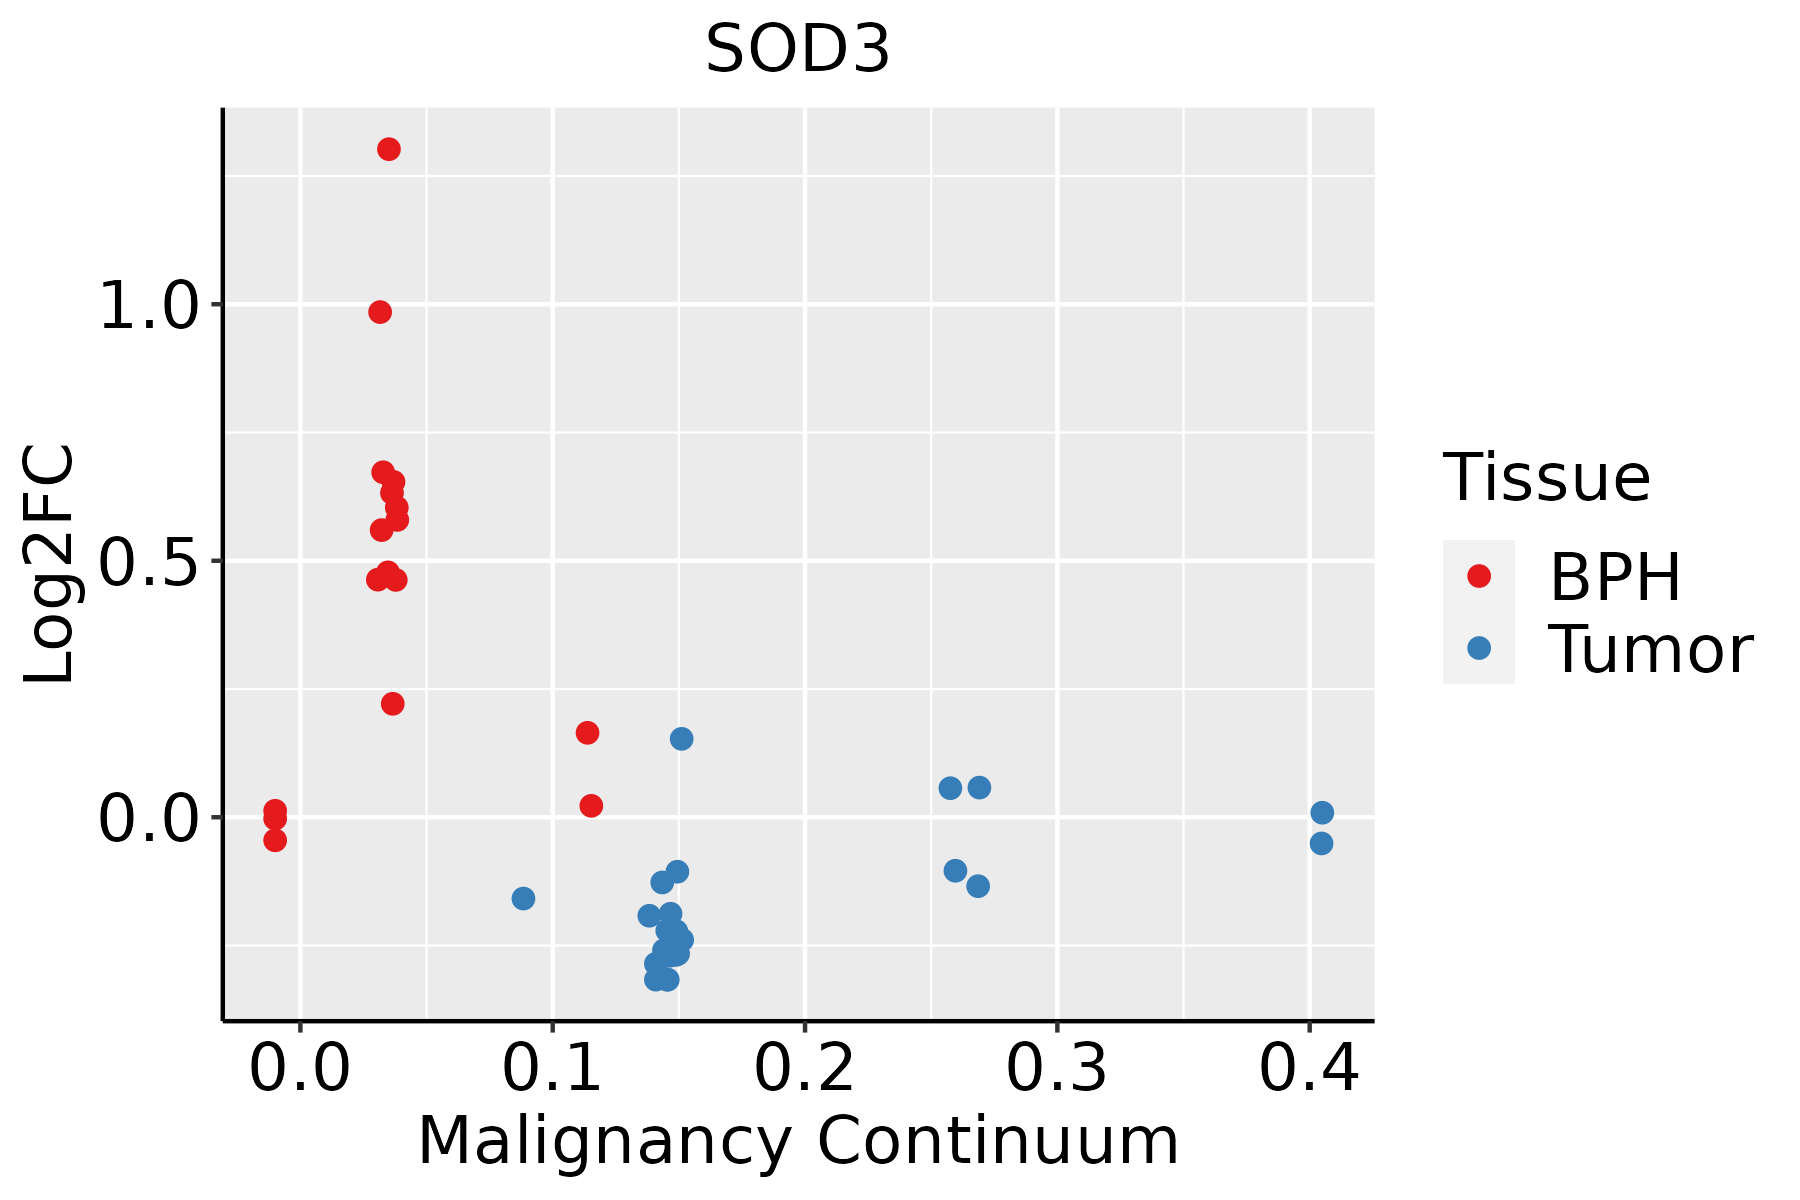 | BPH: Benign Prostatic Hyperplasia |
| Skin | 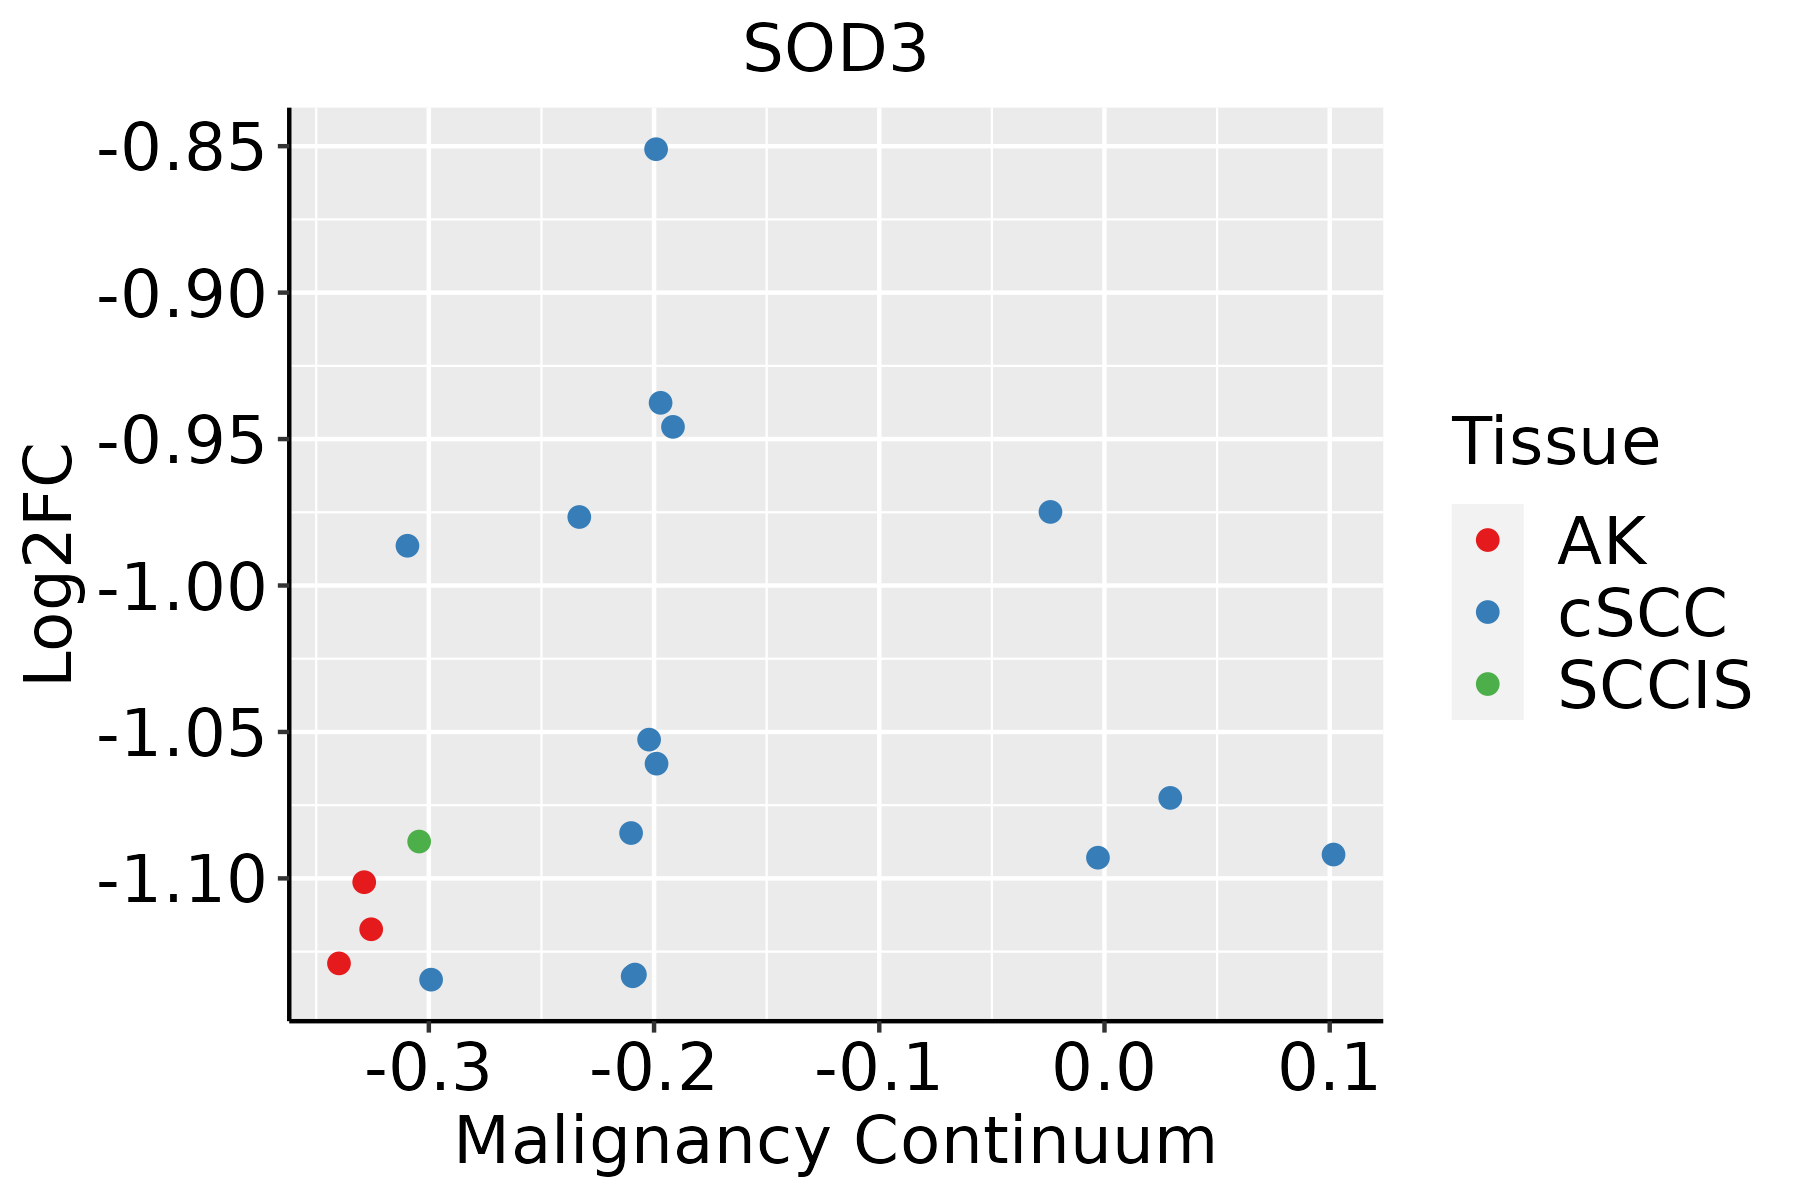 | AK: Actinic keratosis |
| cSCC: Cutaneous squamous cell carcinoma | ||
| SCCIS:squamous cell carcinoma in situ | ||
| Thyroid | 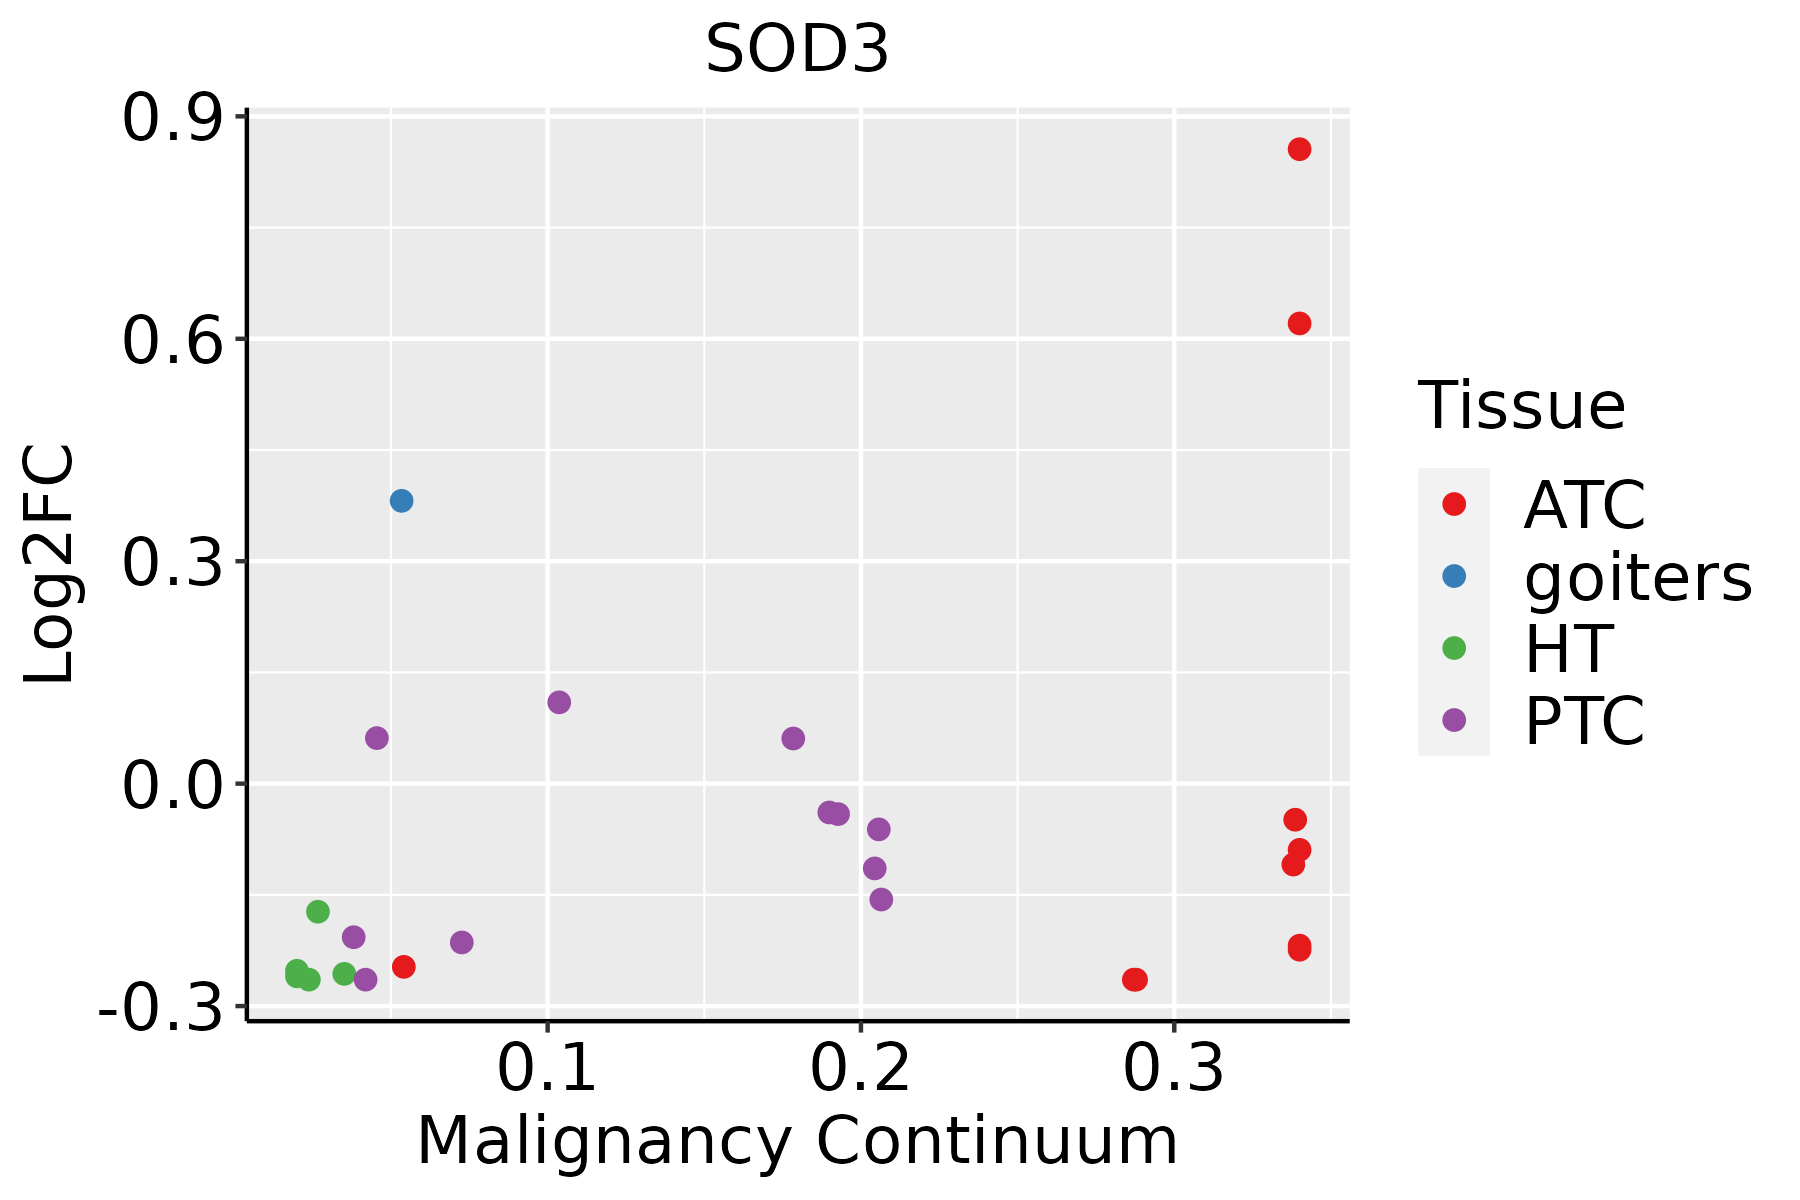 | ATC: Anaplastic thyroid cancer |
| HT: Hashimoto's thyroiditis | ||
| PTC: Papillary thyroid cancer |
| ∗log2FC in expression of this searched gene in stem-like cells from each diseased tissue sample relative to stem-like cells in normal samples in each tissue plotted against the malignancy continuum. Samples are colored based on if they are from different disease stage. |
Top |
Malignant transformation related pathway analysis |
| Find out the enriched GO biological processes and KEGG pathways involved in transition from healthy to precancer to cancer |
| Tissue | Disease Stage | Enriched GO biological Processes |
| Colorectum | AD |  |
| Colorectum | SER |  |
| Colorectum | MSS |  |
| Colorectum | MSI-H |  |
| Colorectum | FAP |  |
| ∗Top 15 enriched GO BP terms are showed in the bar plot of each disease state in each tissue. Each row represents a significant GO biological process which is colored according to the -log10(p.adjust). |
| Page: 1 2 3 4 5 6 7 8 9 |
| GO ID | Tissue | Disease Stage | Description | Gene Ratio | Bg Ratio | pvalue | p.adjust | Count |
| GO:0006979 | Colorectum | AD | response to oxidative stress | 145/3918 | 446/18723 | 5.16e-09 | 3.23e-07 | 145 |
| GO:0062197 | Colorectum | AD | cellular response to chemical stress | 109/3918 | 337/18723 | 5.33e-07 | 1.95e-05 | 109 |
| GO:0000302 | Colorectum | AD | response to reactive oxygen species | 78/3918 | 222/18723 | 6.17e-07 | 2.21e-05 | 78 |
| GO:0009636 | Colorectum | AD | response to toxic substance | 88/3918 | 262/18723 | 1.12e-06 | 3.72e-05 | 88 |
| GO:0034599 | Colorectum | AD | cellular response to oxidative stress | 94/3918 | 288/18723 | 2.03e-06 | 6.02e-05 | 94 |
| GO:0098754 | Colorectum | AD | detoxification | 53/3918 | 152/18723 | 4.63e-05 | 7.98e-04 | 53 |
| GO:0097237 | Colorectum | AD | cellular response to toxic substance | 44/3918 | 124/18723 | 1.24e-04 | 1.80e-03 | 44 |
| GO:1990748 | Colorectum | AD | cellular detoxification | 41/3918 | 116/18723 | 2.29e-04 | 2.97e-03 | 41 |
| GO:0072593 | Colorectum | AD | reactive oxygen species metabolic process | 73/3918 | 239/18723 | 2.79e-04 | 3.42e-03 | 73 |
| GO:0010038 | Colorectum | AD | response to metal ion | 106/3918 | 373/18723 | 3.22e-04 | 3.83e-03 | 106 |
| GO:0070482 | Colorectum | AD | response to oxygen levels | 99/3918 | 347/18723 | 4.29e-04 | 4.82e-03 | 99 |
| GO:0034614 | Colorectum | AD | cellular response to reactive oxygen species | 50/3918 | 155/18723 | 6.25e-04 | 6.49e-03 | 50 |
| GO:0001666 | Colorectum | AD | response to hypoxia | 86/3918 | 307/18723 | 1.77e-03 | 1.46e-02 | 86 |
| GO:0036293 | Colorectum | AD | response to decreased oxygen levels | 88/3918 | 322/18723 | 3.42e-03 | 2.49e-02 | 88 |
| GO:0098869 | Colorectum | AD | cellular oxidant detoxification | 33/3918 | 101/18723 | 3.88e-03 | 2.72e-02 | 33 |
| GO:0046688 | Colorectum | AD | response to copper ion | 16/3918 | 42/18723 | 8.10e-03 | 4.76e-02 | 16 |
| GO:00069791 | Colorectum | SER | response to oxidative stress | 114/2897 | 446/18723 | 1.75e-08 | 1.28e-06 | 114 |
| GO:00003021 | Colorectum | SER | response to reactive oxygen species | 65/2897 | 222/18723 | 1.21e-07 | 7.29e-06 | 65 |
| GO:00621971 | Colorectum | SER | cellular response to chemical stress | 87/2897 | 337/18723 | 5.33e-07 | 2.59e-05 | 87 |
| GO:00096361 | Colorectum | SER | response to toxic substance | 71/2897 | 262/18723 | 8.63e-07 | 4.07e-05 | 71 |
| Page: 1 2 3 4 5 6 7 8 9 10 11 12 13 |
| Pathway ID | Tissue | Disease Stage | Description | Gene Ratio | Bg Ratio | pvalue | p.adjust | qvalue | Count |
| Page: 1 |
Top |
Cell-cell communication analysis |
| Identification of potential cell-cell interactions between two cell types and their ligand-receptor pairs for different disease states |
| Ligand | Receptor | LRpair | Pathway | Tissue | Disease Stage |
| Page: 1 |
Top |
Single-cell gene regulatory network inference analysis |
| Find out the significant the regulons (TFs) and the target genes of each regulon across cell types for different disease states |
| TF | Cell Type | Tissue | Disease Stage | Target Gene | RSS | Regulon Activity |
| ∗The dot plots of a searched regulon are shown for all cell subpopulations in each disease state of each tissue based on the regulon specific score inferred using pySCENIC and by calculating the average expression. |
| Page: 1 |
Top |
Somatic mutation of malignant transformation related genes |
| Annotation of somatic variants for genes involved in malignant transformation |
| Hugo Symbol | Variant Class | Variant Classification | dbSNP RS | HGVSc | HGVSp | HGVSp Short | SWISSPROT | BIOTYPE | SIFT | PolyPhen | Tumor Sample Barcode | Tissue | Histology | Sex | Age | Stage | Therapy Types | Drugs | Outcome |
| SOD3 | SNV | Missense_Mutation | novel | c.698N>A | p.Arg233His | p.R233H | P08294 | protein_coding | tolerated(0.11) | benign(0.028) | TCGA-A5-A1OF-01 | Endometrium | uterine corpus endometrioid carcinoma | Female | <65 | I/II | Unknown | Unknown | SD |
| SOD3 | SNV | Missense_Mutation | novel | c.78N>T | p.Glu26Asp | p.E26D | P08294 | protein_coding | tolerated(0.3) | benign(0.014) | TCGA-AX-A05Z-01 | Endometrium | uterine corpus endometrioid carcinoma | Female | <65 | III/IV | Chemotherapy | adriamycin | SD |
| SOD3 | SNV | Missense_Mutation | novel | c.8N>T | p.Ala3Val | p.A3V | P08294 | protein_coding | tolerated_low_confidence(0.3) | benign(0.122) | TCGA-AX-A0J1-01 | Endometrium | uterine corpus endometrioid carcinoma | Female | >=65 | I/II | Unknown | Unknown | SD |
| SOD3 | SNV | Missense_Mutation | novel | c.323G>T | p.Ser108Ile | p.S108I | P08294 | protein_coding | tolerated(0.2) | benign(0.003) | TCGA-69-8255-01 | Lung | lung adenocarcinoma | Male | >=65 | I/II | Unknown | Unknown | SD |
| SOD3 | SNV | Missense_Mutation | novel | c.401N>T | p.Pro134Leu | p.P134L | P08294 | protein_coding | deleterious(0) | probably_damaging(1) | TCGA-NC-A5HT-01 | Lung | lung squamous cell carcinoma | Male | >=65 | III/IV | Chemotherapy | carboplatin | PR |
| SOD3 | SNV | Missense_Mutation | novel | c.314N>T | p.Glu105Val | p.E105V | P08294 | protein_coding | tolerated(0.09) | benign(0.005) | TCGA-CV-A461-01 | Oral cavity | head & neck squamous cell carcinoma | Male | >=65 | I/II | Unknown | Unknown | SD |
| SOD3 | SNV | Missense_Mutation | rs747381585 | c.394N>C | p.Tyr132His | p.Y132H | P08294 | protein_coding | deleterious(0) | probably_damaging(1) | TCGA-F7-A624-01 | Oral cavity | head & neck squamous cell carcinoma | Male | >=65 | I/II | Unknown | Unknown | SD |
| SOD3 | SNV | Missense_Mutation | c.160G>A | p.Asp54Asn | p.D54N | P08294 | protein_coding | tolerated(0.25) | benign(0.001) | TCGA-CH-5751-01 | Prostate | prostate adenocarcinoma | Male | >=65 | 10 | Hormone Therapy | bicalutamide | PD | |
| SOD3 | SNV | Missense_Mutation | novel | c.64N>A | p.Glu22Lys | p.E22K | P08294 | protein_coding | tolerated(0.9) | benign(0.007) | TCGA-MX-A5UJ-01 | Stomach | stomach adenocarcinoma | Female | >=65 | III/IV | Unknown | Unknown | SD |
| Page: 1 |
Top |
Related drugs of malignant transformation related genes |
| Identification of chemicals and drugs interact with genes involved in malignant transfromation |
| (DGIdb 4.0) |
| Entrez ID | Symbol | Category | Interaction Types | Drug Claim Name | Drug Name | PMIDs |
| Page: 1 |

Copyright 2023-Present -The University of Texas Health Science Center at Houston |