
|
|||||
|
 | |
| |
| |
| |
| |
| |
|
Gene: SOCS4 |
Gene summary for SOCS4 |
| Gene information | Species | Human | Gene symbol | SOCS4 | Gene ID | 122809 |
| Gene name | suppressor of cytokine signaling 4 | |
| Gene Alias | SOCS7 | |
| Cytomap | 14q22.3 | |
| Gene Type | protein-coding | GO ID | GO:0001932 | UniProtAcc | Q5H9R6 |
Top |
Malignant transformation analysis |
| Identification of the aberrant gene expression in precancerous and cancerous lesions by comparing the gene expression of stem-like cells in diseased tissues with normal stem cells |
| Entrez ID | Symbol | Replicates | Species | Organ | Tissue | Adj P-value | Log2FC | Malignancy |
| 122809 | SOCS4 | LZE4T | Human | Esophagus | ESCC | 1.01e-08 | 2.32e-01 | 0.0811 |
| 122809 | SOCS4 | LZE5T | Human | Esophagus | ESCC | 2.25e-02 | 4.18e-01 | 0.0514 |
| 122809 | SOCS4 | LZE7T | Human | Esophagus | ESCC | 2.95e-04 | 1.83e-01 | 0.0667 |
| 122809 | SOCS4 | LZE20T | Human | Esophagus | ESCC | 4.27e-03 | 1.05e-01 | 0.0662 |
| 122809 | SOCS4 | LZE24T | Human | Esophagus | ESCC | 9.43e-10 | 1.57e-01 | 0.0596 |
| 122809 | SOCS4 | LZE6T | Human | Esophagus | ESCC | 8.16e-03 | 1.40e-01 | 0.0845 |
| 122809 | SOCS4 | P1T-E | Human | Esophagus | ESCC | 1.63e-05 | 1.74e-01 | 0.0875 |
| 122809 | SOCS4 | P2T-E | Human | Esophagus | ESCC | 8.84e-10 | 1.50e-01 | 0.1177 |
| 122809 | SOCS4 | P4T-E | Human | Esophagus | ESCC | 7.40e-17 | 3.39e-01 | 0.1323 |
| 122809 | SOCS4 | P5T-E | Human | Esophagus | ESCC | 1.47e-08 | 1.58e-01 | 0.1327 |
| 122809 | SOCS4 | P8T-E | Human | Esophagus | ESCC | 5.23e-12 | 2.01e-01 | 0.0889 |
| 122809 | SOCS4 | P9T-E | Human | Esophagus | ESCC | 3.05e-10 | 1.34e-01 | 0.1131 |
| 122809 | SOCS4 | P10T-E | Human | Esophagus | ESCC | 8.50e-18 | 3.37e-01 | 0.116 |
| 122809 | SOCS4 | P11T-E | Human | Esophagus | ESCC | 6.45e-03 | 1.30e-01 | 0.1426 |
| 122809 | SOCS4 | P12T-E | Human | Esophagus | ESCC | 4.25e-12 | 2.17e-01 | 0.1122 |
| 122809 | SOCS4 | P15T-E | Human | Esophagus | ESCC | 2.06e-22 | 4.60e-01 | 0.1149 |
| 122809 | SOCS4 | P16T-E | Human | Esophagus | ESCC | 8.05e-06 | 1.05e-01 | 0.1153 |
| 122809 | SOCS4 | P17T-E | Human | Esophagus | ESCC | 4.15e-07 | 2.66e-01 | 0.1278 |
| 122809 | SOCS4 | P20T-E | Human | Esophagus | ESCC | 3.09e-04 | 9.84e-02 | 0.1124 |
| 122809 | SOCS4 | P21T-E | Human | Esophagus | ESCC | 7.91e-06 | 1.64e-01 | 0.1617 |
| Page: 1 2 3 4 |
| Tissue | Expression Dynamics | Abbreviation |
| Esophagus | 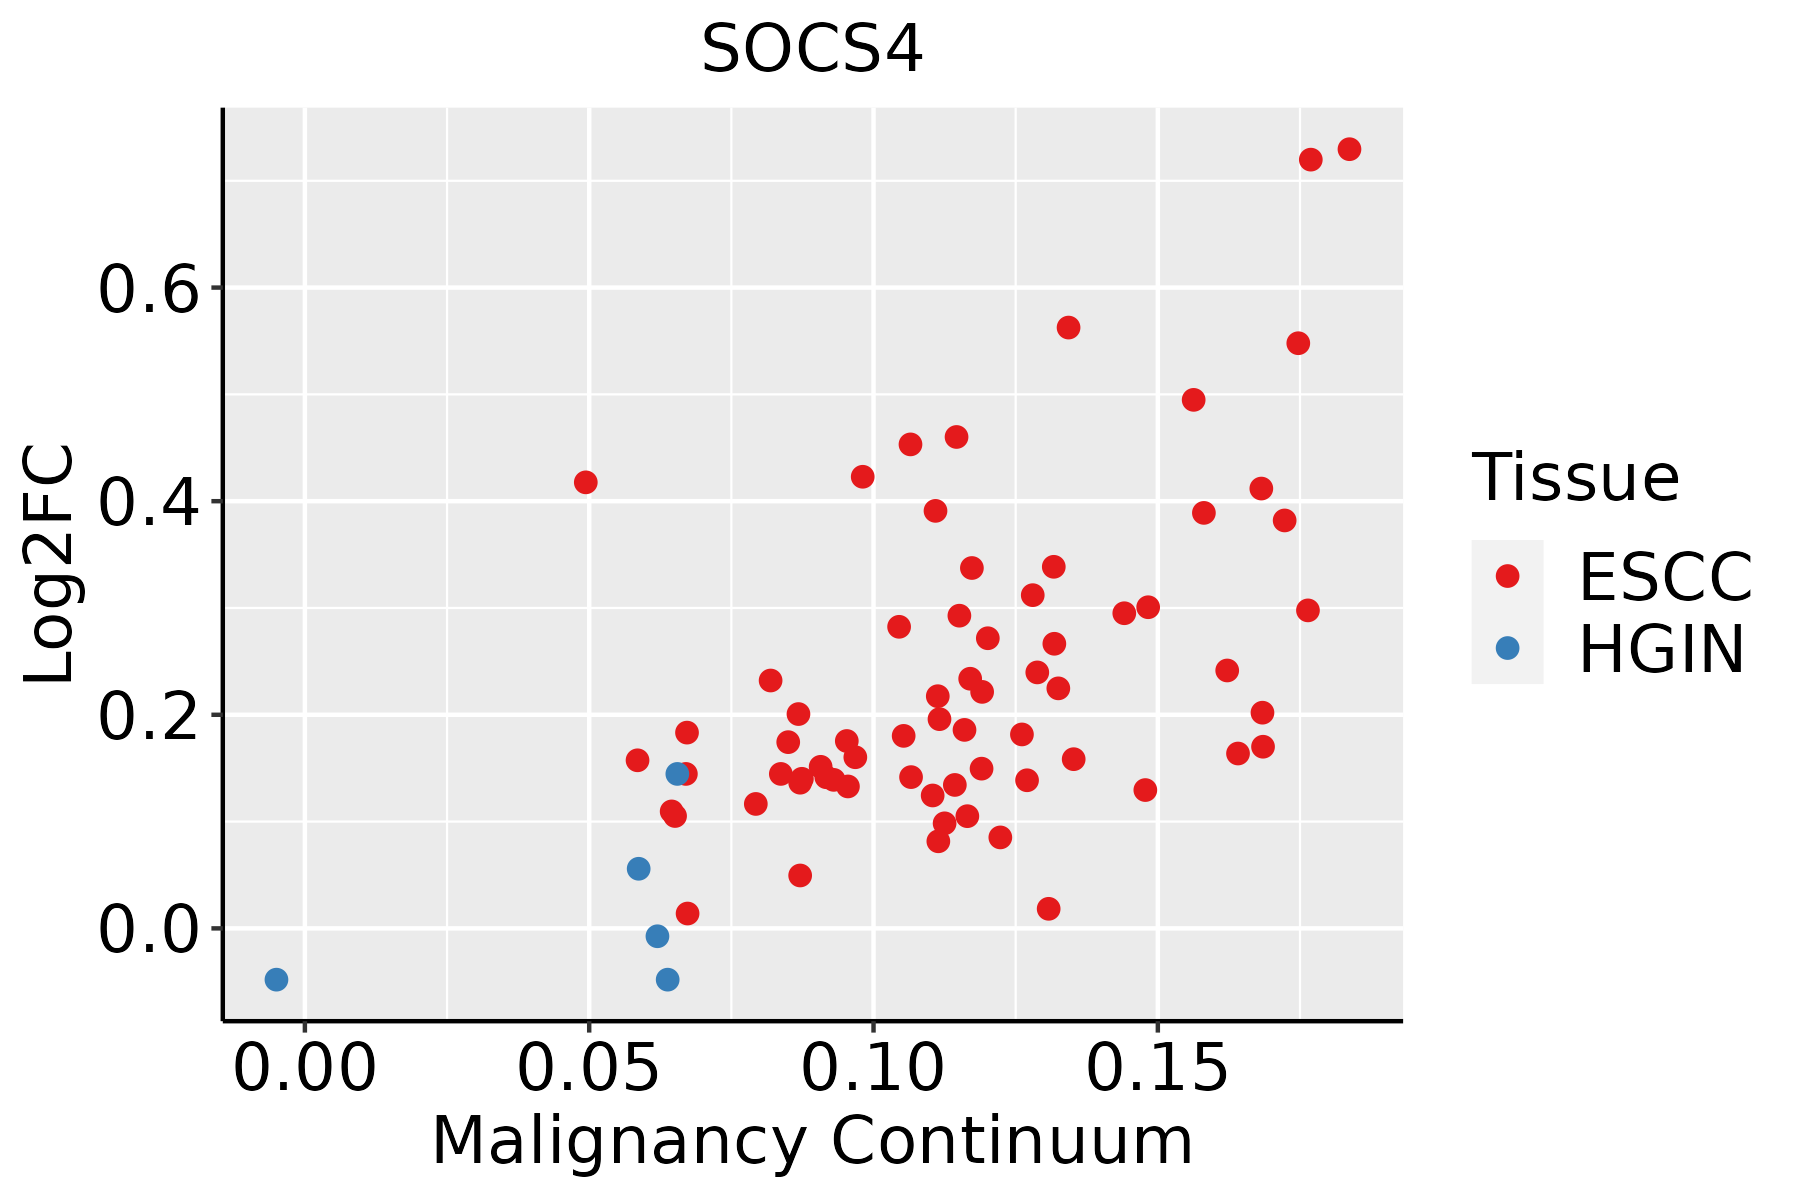 | ESCC: Esophageal squamous cell carcinoma |
| HGIN: High-grade intraepithelial neoplasias | ||
| LGIN: Low-grade intraepithelial neoplasias | ||
| Liver |  | HCC: Hepatocellular carcinoma |
| NAFLD: Non-alcoholic fatty liver disease | ||
| Thyroid | 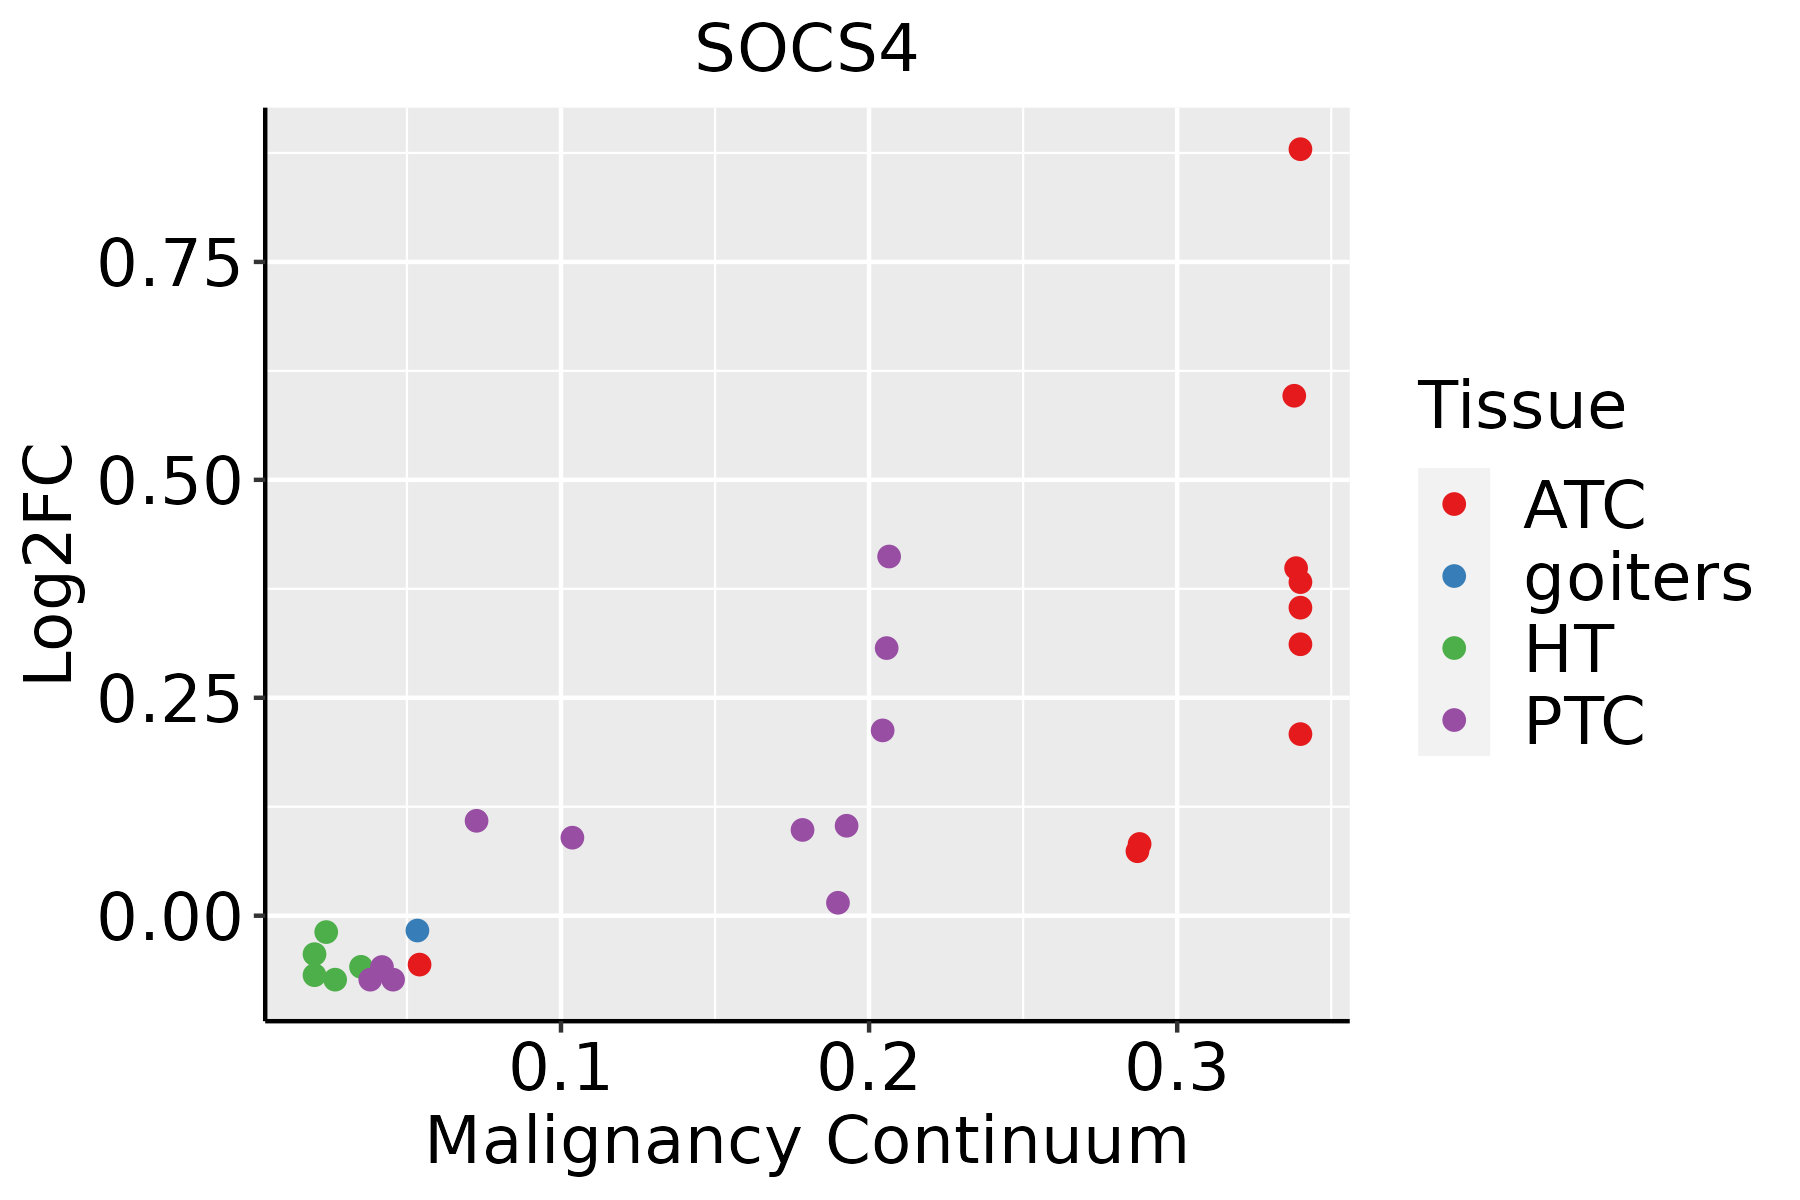 | ATC: Anaplastic thyroid cancer |
| HT: Hashimoto's thyroiditis | ||
| PTC: Papillary thyroid cancer |
| ∗log2FC in expression of this searched gene in stem-like cells from each diseased tissue sample relative to stem-like cells in normal samples in each tissue plotted against the malignancy continuum. Samples are colored based on if they are from different disease stage. |
Top |
Malignant transformation related pathway analysis |
| Find out the enriched GO biological processes and KEGG pathways involved in transition from healthy to precancer to cancer |
| Tissue | Disease Stage | Enriched GO biological Processes |
| Colorectum | AD |  |
| Colorectum | SER |  |
| Colorectum | MSS |  |
| Colorectum | MSI-H |  |
| Colorectum | FAP |  |
| ∗Top 15 enriched GO BP terms are showed in the bar plot of each disease state in each tissue. Each row represents a significant GO biological process which is colored according to the -log10(p.adjust). |
| Page: 1 2 3 4 5 6 7 8 9 |
| GO ID | Tissue | Disease Stage | Description | Gene Ratio | Bg Ratio | pvalue | p.adjust | Count |
| GO:0010498111 | Esophagus | ESCC | proteasomal protein catabolic process | 369/8552 | 490/18723 | 1.13e-41 | 1.80e-38 | 369 |
| GO:0043161111 | Esophagus | ESCC | proteasome-mediated ubiquitin-dependent protein catabolic process | 312/8552 | 412/18723 | 3.53e-36 | 4.48e-33 | 312 |
| GO:0042176111 | Esophagus | ESCC | regulation of protein catabolic process | 280/8552 | 391/18723 | 8.65e-26 | 2.39e-23 | 280 |
| GO:0009896111 | Esophagus | ESCC | positive regulation of catabolic process | 332/8552 | 492/18723 | 4.36e-23 | 9.22e-21 | 332 |
| GO:0031331111 | Esophagus | ESCC | positive regulation of cellular catabolic process | 292/8552 | 427/18723 | 8.67e-22 | 1.53e-19 | 292 |
| GO:1903362111 | Esophagus | ESCC | regulation of cellular protein catabolic process | 188/8552 | 255/18723 | 5.12e-20 | 6.62e-18 | 188 |
| GO:0045862111 | Esophagus | ESCC | positive regulation of proteolysis | 256/8552 | 372/18723 | 7.88e-20 | 9.43e-18 | 256 |
| GO:1903050111 | Esophagus | ESCC | regulation of proteolysis involved in cellular protein catabolic process | 163/8552 | 221/18723 | 1.44e-17 | 1.27e-15 | 163 |
| GO:0061136111 | Esophagus | ESCC | regulation of proteasomal protein catabolic process | 142/8552 | 187/18723 | 2.40e-17 | 2.00e-15 | 142 |
| GO:0045732111 | Esophagus | ESCC | positive regulation of protein catabolic process | 167/8552 | 231/18723 | 1.47e-16 | 1.14e-14 | 167 |
| GO:0032434111 | Esophagus | ESCC | regulation of proteasomal ubiquitin-dependent protein catabolic process | 107/8552 | 134/18723 | 4.06e-16 | 2.93e-14 | 107 |
| GO:2000058111 | Esophagus | ESCC | regulation of ubiquitin-dependent protein catabolic process | 125/8552 | 164/18723 | 1.17e-15 | 7.76e-14 | 125 |
| GO:1903364111 | Esophagus | ESCC | positive regulation of cellular protein catabolic process | 117/8552 | 155/18723 | 3.25e-14 | 1.66e-12 | 117 |
| GO:1901800110 | Esophagus | ESCC | positive regulation of proteasomal protein catabolic process | 91/8552 | 114/18723 | 6.74e-14 | 3.34e-12 | 91 |
| GO:1903052110 | Esophagus | ESCC | positive regulation of proteolysis involved in cellular protein catabolic process | 101/8552 | 133/18723 | 9.58e-13 | 4.19e-11 | 101 |
| GO:0010563111 | Esophagus | ESCC | negative regulation of phosphorus metabolic process | 274/8552 | 442/18723 | 2.32e-12 | 9.41e-11 | 274 |
| GO:0045936111 | Esophagus | ESCC | negative regulation of phosphate metabolic process | 273/8552 | 441/18723 | 3.18e-12 | 1.25e-10 | 273 |
| GO:0051348111 | Esophagus | ESCC | negative regulation of transferase activity | 177/8552 | 268/18723 | 1.08e-11 | 4.00e-10 | 177 |
| GO:0032436111 | Esophagus | ESCC | positive regulation of proteasomal ubiquitin-dependent protein catabolic process | 72/8552 | 90/18723 | 2.30e-11 | 7.87e-10 | 72 |
| GO:0042326111 | Esophagus | ESCC | negative regulation of phosphorylation | 237/8552 | 385/18723 | 1.86e-10 | 5.33e-09 | 237 |
| Page: 1 2 3 4 5 6 7 8 |
| Pathway ID | Tissue | Disease Stage | Description | Gene Ratio | Bg Ratio | pvalue | p.adjust | qvalue | Count |
| hsa049109 | Esophagus | ESCC | Insulin signaling pathway | 89/4205 | 137/8465 | 1.97e-04 | 7.32e-04 | 3.75e-04 | 89 |
| hsa0491014 | Esophagus | ESCC | Insulin signaling pathway | 89/4205 | 137/8465 | 1.97e-04 | 7.32e-04 | 3.75e-04 | 89 |
| hsa0491041 | Liver | HCC | Insulin signaling pathway | 95/4020 | 137/8465 | 1.53e-07 | 1.97e-06 | 1.10e-06 | 95 |
| hsa04917 | Liver | HCC | Prolactin signaling pathway | 43/4020 | 70/8465 | 1.30e-02 | 3.19e-02 | 1.78e-02 | 43 |
| hsa0491051 | Liver | HCC | Insulin signaling pathway | 95/4020 | 137/8465 | 1.53e-07 | 1.97e-06 | 1.10e-06 | 95 |
| hsa049171 | Liver | HCC | Prolactin signaling pathway | 43/4020 | 70/8465 | 1.30e-02 | 3.19e-02 | 1.78e-02 | 43 |
| Page: 1 |
Top |
Cell-cell communication analysis |
| Identification of potential cell-cell interactions between two cell types and their ligand-receptor pairs for different disease states |
| Ligand | Receptor | LRpair | Pathway | Tissue | Disease Stage |
| Page: 1 |
Top |
Single-cell gene regulatory network inference analysis |
| Find out the significant the regulons (TFs) and the target genes of each regulon across cell types for different disease states |
| TF | Cell Type | Tissue | Disease Stage | Target Gene | RSS | Regulon Activity |
| ∗The dot plots of a searched regulon are shown for all cell subpopulations in each disease state of each tissue based on the regulon specific score inferred using pySCENIC and by calculating the average expression. |
| Page: 1 |
Top |
Somatic mutation of malignant transformation related genes |
| Annotation of somatic variants for genes involved in malignant transformation |
| Hugo Symbol | Variant Class | Variant Classification | dbSNP RS | HGVSc | HGVSp | HGVSp Short | SWISSPROT | BIOTYPE | SIFT | PolyPhen | Tumor Sample Barcode | Tissue | Histology | Sex | Age | Stage | Therapy Types | Drugs | Outcome |
| SOCS4 | SNV | Missense_Mutation | c.536N>T | p.Arg179Ile | p.R179I | Q8WXH5 | protein_coding | tolerated(0.51) | benign(0.347) | TCGA-A8-A076-01 | Breast | breast invasive carcinoma | Female | >=65 | I/II | Hormone Therapy | anastrozole | SD | |
| SOCS4 | SNV | Missense_Mutation | c.503A>T | p.Gln168Leu | p.Q168L | Q8WXH5 | protein_coding | tolerated(0.34) | benign(0.01) | TCGA-A8-A09A-01 | Breast | breast invasive carcinoma | Female | <65 | I/II | Hormone Therapy | tamoxiphen | SD | |
| SOCS4 | SNV | Missense_Mutation | c.269N>A | p.Ser90Tyr | p.S90Y | Q8WXH5 | protein_coding | deleterious(0) | probably_damaging(0.989) | TCGA-AR-A1AW-01 | Breast | breast invasive carcinoma | Female | >=65 | I/II | Chemotherapy | docetaxel | SD | |
| SOCS4 | SNV | Missense_Mutation | novel | c.1245N>A | p.Met415Ile | p.M415I | Q8WXH5 | protein_coding | deleterious(0) | benign(0.039) | TCGA-XX-A899-01 | Breast | breast invasive carcinoma | Female | <65 | III/IV | Chemotherapy | cytoxan | CR |
| SOCS4 | insertion | Nonsense_Mutation | novel | c.708_709insTGAAGAGAACGACTATAGCGT | p.Thr236_Leu237insTer | p.T236_L237ins* | Q8WXH5 | protein_coding | TCGA-AC-A3QQ-01 | Breast | breast invasive carcinoma | Female | <65 | I/II | Unknown | Unknown | SD | ||
| SOCS4 | SNV | Missense_Mutation | rs756526707 | c.105N>C | p.Lys35Asn | p.K35N | Q8WXH5 | protein_coding | deleterious(0) | probably_damaging(0.997) | TCGA-DS-A0VK-01 | Cervix | cervical & endocervical cancer | Female | <65 | I/II | Chemotherapy | carboplatin | PD |
| SOCS4 | SNV | Missense_Mutation | rs368652531 | c.332N>A | p.Arg111Gln | p.R111Q | Q8WXH5 | protein_coding | tolerated(0.48) | probably_damaging(0.922) | TCGA-EA-A3HT-01 | Cervix | cervical & endocervical cancer | Female | >=65 | I/II | Unknown | Unknown | SD |
| SOCS4 | SNV | Missense_Mutation | novel | c.805N>C | p.Asp269His | p.D269H | Q8WXH5 | protein_coding | deleterious(0.01) | probably_damaging(0.998) | TCGA-JW-A5VL-01 | Cervix | cervical & endocervical cancer | Female | <65 | I/II | Unknown | Unknown | SD |
| SOCS4 | SNV | Missense_Mutation | novel | c.916N>T | p.Gly306Cys | p.G306C | Q8WXH5 | protein_coding | deleterious(0) | probably_damaging(1) | TCGA-AA-3949-01 | Colorectum | colon adenocarcinoma | Female | >=65 | III/IV | Unknown | Unknown | SD |
| SOCS4 | SNV | Missense_Mutation | novel | c.1099C>T | p.Pro367Ser | p.P367S | Q8WXH5 | protein_coding | deleterious(0.01) | probably_damaging(0.994) | TCGA-A5-A0G1-01 | Endometrium | uterine corpus endometrioid carcinoma | Female | >=65 | I/II | Unknown | Unknown | SD |
| Page: 1 2 3 4 |
Top |
Related drugs of malignant transformation related genes |
| Identification of chemicals and drugs interact with genes involved in malignant transfromation |
| (DGIdb 4.0) |
| Entrez ID | Symbol | Category | Interaction Types | Drug Claim Name | Drug Name | PMIDs |
| Page: 1 |

Copyright 2023-Present -The University of Texas Health Science Center at Houston |