
|
|||||
|
 | |
| |
| |
| |
| |
| |
|
Gene: SOBP |
Gene summary for SOBP |
| Gene information | Species | Human | Gene symbol | SOBP | Gene ID | 55084 |
| Gene name | sine oculis binding protein homolog | |
| Gene Alias | JXC1 | |
| Cytomap | 6q21 | |
| Gene Type | protein-coding | GO ID | GO:0003008 | UniProtAcc | A7XYQ1 |
Top |
Malignant transformation analysis |
| Identification of the aberrant gene expression in precancerous and cancerous lesions by comparing the gene expression of stem-like cells in diseased tissues with normal stem cells |
| Entrez ID | Symbol | Replicates | Species | Organ | Tissue | Adj P-value | Log2FC | Malignancy |
| 55084 | SOBP | HCC1_Meng | Human | Liver | HCC | 5.12e-17 | -1.32e-02 | 0.0246 |
| 55084 | SOBP | HCC1 | Human | Liver | HCC | 9.85e-09 | 2.90e+00 | 0.5336 |
| 55084 | SOBP | HCC2 | Human | Liver | HCC | 4.66e-05 | 2.41e+00 | 0.5341 |
| 55084 | SOBP | Pt14.a | Human | Liver | HCC | 1.82e-07 | 5.30e-01 | 0.0169 |
| 55084 | SOBP | S014 | Human | Liver | HCC | 1.33e-12 | 4.70e-01 | 0.2254 |
| 55084 | SOBP | S015 | Human | Liver | HCC | 9.36e-13 | 4.46e-01 | 0.2375 |
| 55084 | SOBP | S016 | Human | Liver | HCC | 9.60e-12 | 3.87e-01 | 0.2243 |
| 55084 | SOBP | HTA12-15-2 | Human | Pancreas | PDAC | 4.45e-06 | 3.95e-01 | 0.2315 |
| 55084 | SOBP | HTA12-23-1 | Human | Pancreas | PDAC | 5.20e-08 | 6.95e-01 | 0.3405 |
| 55084 | SOBP | HTA12-25-1 | Human | Pancreas | PDAC | 3.07e-08 | 6.24e-01 | 0.313 |
| 55084 | SOBP | HTA12-26-1 | Human | Pancreas | PDAC | 6.32e-21 | 8.26e-01 | 0.3728 |
| 55084 | SOBP | HTA12-29-1 | Human | Pancreas | PDAC | 3.75e-51 | 9.73e-01 | 0.3722 |
| 55084 | SOBP | HTA12-32-1 | Human | Pancreas | PDAC | 4.23e-05 | 8.64e-01 | 0.3624 |
| 55084 | SOBP | HTA12-9-2 | Human | Pancreas | PDAC | 1.65e-02 | 2.31e-01 | 0.0835 |
| Page: 1 |
| Tissue | Expression Dynamics | Abbreviation |
| Liver | 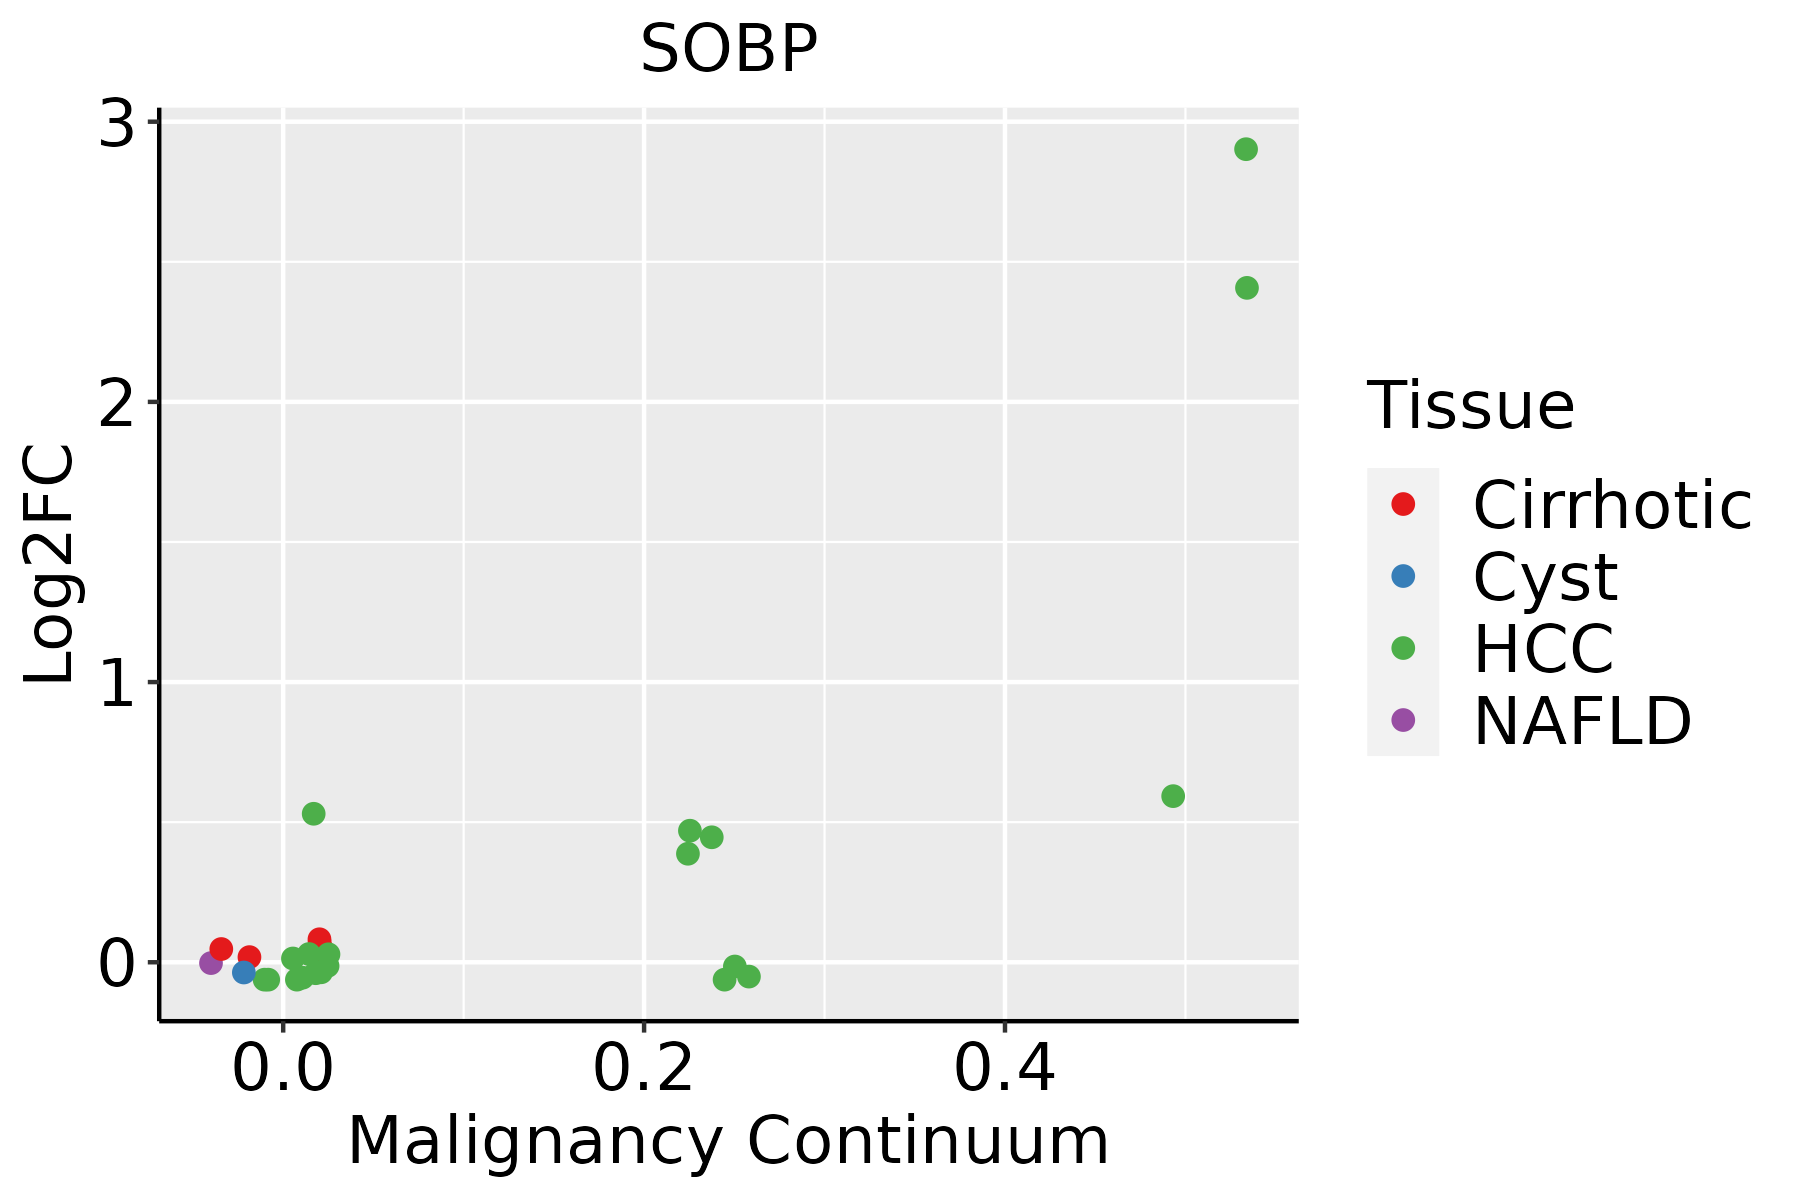 | HCC: Hepatocellular carcinoma |
| NAFLD: Non-alcoholic fatty liver disease |
| ∗log2FC in expression of this searched gene in stem-like cells from each diseased tissue sample relative to stem-like cells in normal samples in each tissue plotted against the malignancy continuum. Samples are colored based on if they are from different disease stage. |
Top |
Malignant transformation related pathway analysis |
| Find out the enriched GO biological processes and KEGG pathways involved in transition from healthy to precancer to cancer |
| Tissue | Disease Stage | Enriched GO biological Processes |
| Colorectum | AD |  |
| Colorectum | SER |  |
| Colorectum | MSS |  |
| Colorectum | MSI-H |  |
| Colorectum | FAP |  |
| ∗Top 15 enriched GO BP terms are showed in the bar plot of each disease state in each tissue. Each row represents a significant GO biological process which is colored according to the -log10(p.adjust). |
| Page: 1 2 3 4 5 6 7 8 9 |
| GO ID | Tissue | Disease Stage | Description | Gene Ratio | Bg Ratio | pvalue | p.adjust | Count |
| Page: 1 |
| Pathway ID | Tissue | Disease Stage | Description | Gene Ratio | Bg Ratio | pvalue | p.adjust | qvalue | Count |
| Page: 1 |
Top |
Cell-cell communication analysis |
| Identification of potential cell-cell interactions between two cell types and their ligand-receptor pairs for different disease states |
| Ligand | Receptor | LRpair | Pathway | Tissue | Disease Stage |
| Page: 1 |
Top |
Single-cell gene regulatory network inference analysis |
| Find out the significant the regulons (TFs) and the target genes of each regulon across cell types for different disease states |
| TF | Cell Type | Tissue | Disease Stage | Target Gene | RSS | Regulon Activity |
| ∗The dot plots of a searched regulon are shown for all cell subpopulations in each disease state of each tissue based on the regulon specific score inferred using pySCENIC and by calculating the average expression. |
| Page: 1 |
Top |
Somatic mutation of malignant transformation related genes |
| Annotation of somatic variants for genes involved in malignant transformation |
| Hugo Symbol | Variant Class | Variant Classification | dbSNP RS | HGVSc | HGVSp | HGVSp Short | SWISSPROT | BIOTYPE | SIFT | PolyPhen | Tumor Sample Barcode | Tissue | Histology | Sex | Age | Stage | Therapy Types | Drugs | Outcome |
| SOBP | SNV | Missense_Mutation | rs747849355 | c.482G>A | p.Arg161His | p.R161H | A7XYQ1 | protein_coding | tolerated(0.06) | probably_damaging(0.998) | TCGA-A2-A3XV-01 | Breast | breast invasive carcinoma | Female | <65 | I/II | Chemotherapy | carboplatin | CR |
| SOBP | SNV | Missense_Mutation | c.2474N>T | p.Gly825Val | p.G825V | A7XYQ1 | protein_coding | deleterious(0) | probably_damaging(0.998) | TCGA-A8-A085-01 | Breast | breast invasive carcinoma | Male | <65 | I/II | Hormone Therapy | tamoxiphen | SD | |
| SOBP | SNV | Missense_Mutation | c.590G>A | p.Gly197Glu | p.G197E | A7XYQ1 | protein_coding | deleterious(0.05) | probably_damaging(1) | TCGA-AO-A0JJ-01 | Breast | breast invasive carcinoma | Female | <65 | I/II | Chemotherapy | cyclophospamide | SD | |
| SOBP | SNV | Missense_Mutation | c.1310C>T | p.Pro437Leu | p.P437L | A7XYQ1 | protein_coding | deleterious(0) | possibly_damaging(0.891) | TCGA-BH-A1FN-01 | Breast | breast invasive carcinoma | Female | <65 | I/II | Unknown | Unknown | PD | |
| SOBP | SNV | Missense_Mutation | c.660N>G | p.Cys220Trp | p.C220W | A7XYQ1 | protein_coding | deleterious(0.01) | probably_damaging(0.987) | TCGA-E9-A1RF-01 | Breast | breast invasive carcinoma | Female | >=65 | III/IV | Hormone Therapy | tamoxiphen | SD | |
| SOBP | SNV | Missense_Mutation | novel | c.2439C>G | p.Asp813Glu | p.D813E | A7XYQ1 | protein_coding | tolerated(0.22) | possibly_damaging(0.774) | TCGA-LL-A8F5-01 | Breast | breast invasive carcinoma | Female | <65 | I/II | Chemotherapy | cyclophosphamide | SD |
| SOBP | SNV | Missense_Mutation | novel | c.727G>A | p.Gly243Arg | p.G243R | A7XYQ1 | protein_coding | deleterious(0) | probably_damaging(1) | TCGA-V7-A7HQ-01 | Breast | breast invasive carcinoma | Female | >=65 | III/IV | Hormone Therapy | letrozole | CR |
| SOBP | SNV | Missense_Mutation | novel | c.1646C>T | p.Ser549Phe | p.S549F | A7XYQ1 | protein_coding | deleterious(0) | possibly_damaging(0.865) | TCGA-2W-A8YY-01 | Cervix | cervical & endocervical cancer | Female | <65 | I/II | Chemotherapy | cisplatin | CR |
| SOBP | SNV | Missense_Mutation | novel | c.628N>A | p.Glu210Lys | p.E210K | A7XYQ1 | protein_coding | deleterious(0.01) | possibly_damaging(0.84) | TCGA-C5-A1MN-01 | Cervix | cervical & endocervical cancer | Female | <65 | III/IV | Chemotherapy | cisplatin | SD |
| SOBP | SNV | Missense_Mutation | novel | c.2548N>T | p.Leu850Phe | p.L850F | A7XYQ1 | protein_coding | deleterious(0.03) | probably_damaging(0.976) | TCGA-EA-A3HU-01 | Cervix | cervical & endocervical cancer | Female | <65 | I/II | Unknown | Unknown | SD |
| Page: 1 2 3 4 5 6 7 8 9 10 11 |
Top |
Related drugs of malignant transformation related genes |
| Identification of chemicals and drugs interact with genes involved in malignant transfromation |
| (DGIdb 4.0) |
| Entrez ID | Symbol | Category | Interaction Types | Drug Claim Name | Drug Name | PMIDs |
| Page: 1 |

Copyright 2023-Present -The University of Texas Health Science Center at Houston |