
|
|||||
|
 | |
| |
| |
| |
| |
| |
|
Gene: SOAT1 |
Gene summary for SOAT1 |
| Gene information | Species | Human | Gene symbol | SOAT1 | Gene ID | 6646 |
| Gene name | sterol O-acyltransferase 1 | |
| Gene Alias | ACACT | |
| Cytomap | 1q25.2 | |
| Gene Type | protein-coding | GO ID | GO:0006066 | UniProtAcc | P35610 |
Top |
Malignant transformation analysis |
| Identification of the aberrant gene expression in precancerous and cancerous lesions by comparing the gene expression of stem-like cells in diseased tissues with normal stem cells |
| Entrez ID | Symbol | Replicates | Species | Organ | Tissue | Adj P-value | Log2FC | Malignancy |
| 6646 | SOAT1 | LZE4T | Human | Esophagus | ESCC | 3.58e-05 | 1.36e-01 | 0.0811 |
| 6646 | SOAT1 | LZE7T | Human | Esophagus | ESCC | 4.71e-05 | 2.91e-01 | 0.0667 |
| 6646 | SOAT1 | LZE6T | Human | Esophagus | ESCC | 1.01e-02 | 1.59e-01 | 0.0845 |
| 6646 | SOAT1 | P2T-E | Human | Esophagus | ESCC | 3.27e-15 | 2.68e-01 | 0.1177 |
| 6646 | SOAT1 | P4T-E | Human | Esophagus | ESCC | 4.09e-06 | 1.27e-01 | 0.1323 |
| 6646 | SOAT1 | P5T-E | Human | Esophagus | ESCC | 5.27e-11 | 2.20e-01 | 0.1327 |
| 6646 | SOAT1 | P8T-E | Human | Esophagus | ESCC | 1.03e-13 | 1.99e-01 | 0.0889 |
| 6646 | SOAT1 | P9T-E | Human | Esophagus | ESCC | 2.20e-07 | 8.62e-02 | 0.1131 |
| 6646 | SOAT1 | P10T-E | Human | Esophagus | ESCC | 3.58e-11 | 9.19e-02 | 0.116 |
| 6646 | SOAT1 | P11T-E | Human | Esophagus | ESCC | 1.03e-06 | 3.00e-01 | 0.1426 |
| 6646 | SOAT1 | P12T-E | Human | Esophagus | ESCC | 4.79e-18 | 1.41e-01 | 0.1122 |
| 6646 | SOAT1 | P15T-E | Human | Esophagus | ESCC | 9.68e-06 | 1.04e-01 | 0.1149 |
| 6646 | SOAT1 | P16T-E | Human | Esophagus | ESCC | 9.61e-16 | 2.04e-01 | 0.1153 |
| 6646 | SOAT1 | P19T-E | Human | Esophagus | ESCC | 3.38e-05 | 3.58e-01 | 0.1662 |
| 6646 | SOAT1 | P20T-E | Human | Esophagus | ESCC | 1.17e-04 | 1.38e-01 | 0.1124 |
| 6646 | SOAT1 | P21T-E | Human | Esophagus | ESCC | 4.99e-24 | 4.76e-01 | 0.1617 |
| 6646 | SOAT1 | P22T-E | Human | Esophagus | ESCC | 3.99e-16 | 1.49e-01 | 0.1236 |
| 6646 | SOAT1 | P23T-E | Human | Esophagus | ESCC | 5.53e-10 | 2.86e-01 | 0.108 |
| 6646 | SOAT1 | P24T-E | Human | Esophagus | ESCC | 6.84e-08 | 8.31e-02 | 0.1287 |
| 6646 | SOAT1 | P26T-E | Human | Esophagus | ESCC | 1.64e-07 | 1.23e-01 | 0.1276 |
| Page: 1 2 3 4 |
| Tissue | Expression Dynamics | Abbreviation |
| Esophagus |  | ESCC: Esophageal squamous cell carcinoma |
| HGIN: High-grade intraepithelial neoplasias | ||
| LGIN: Low-grade intraepithelial neoplasias | ||
| Liver |  | HCC: Hepatocellular carcinoma |
| NAFLD: Non-alcoholic fatty liver disease | ||
| Oral Cavity | 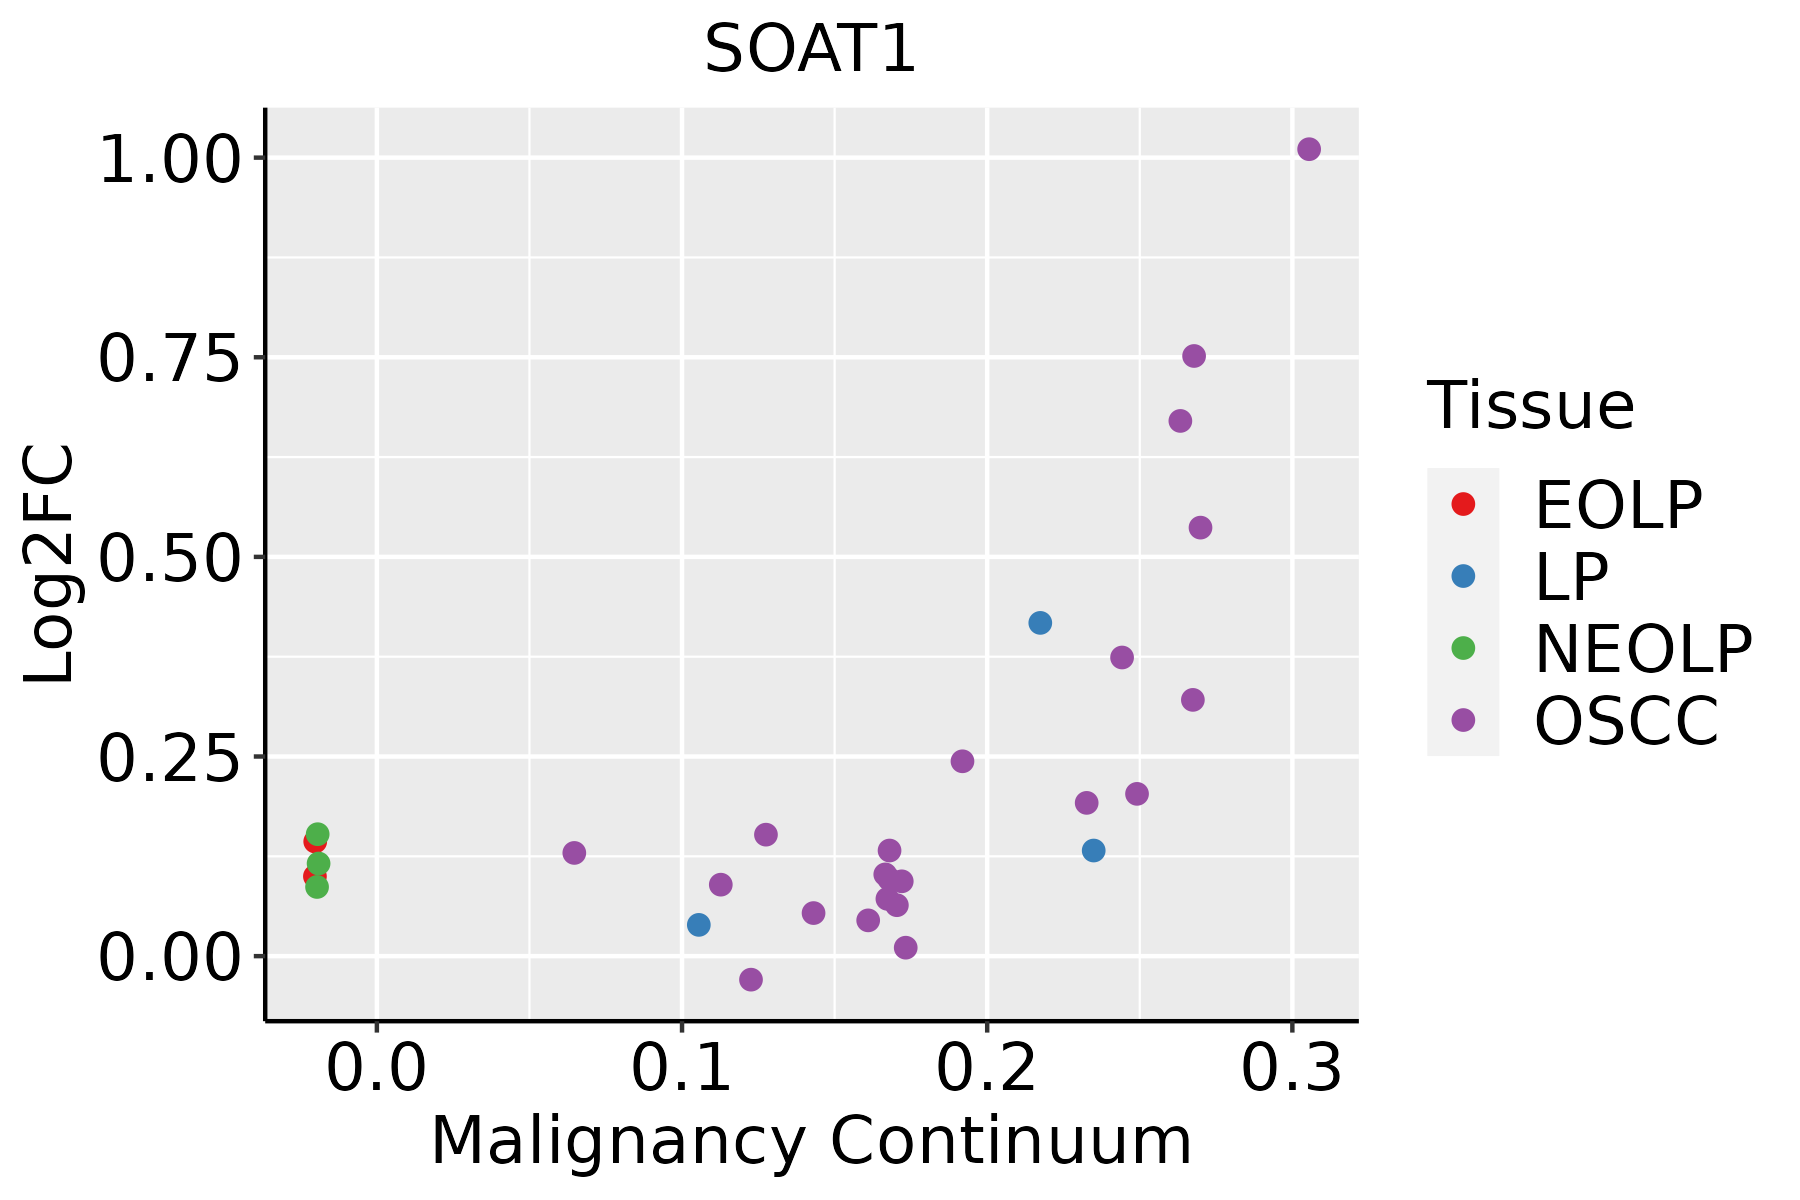 | EOLP: Erosive Oral lichen planus |
| LP: leukoplakia | ||
| NEOLP: Non-erosive oral lichen planus | ||
| OSCC: Oral squamous cell carcinoma |
| ∗log2FC in expression of this searched gene in stem-like cells from each diseased tissue sample relative to stem-like cells in normal samples in each tissue plotted against the malignancy continuum. Samples are colored based on if they are from different disease stage. |
Top |
Malignant transformation related pathway analysis |
| Find out the enriched GO biological processes and KEGG pathways involved in transition from healthy to precancer to cancer |
| Tissue | Disease Stage | Enriched GO biological Processes |
| Colorectum | AD |  |
| Colorectum | SER |  |
| Colorectum | MSS |  |
| Colorectum | MSI-H |  |
| Colorectum | FAP |  |
| ∗Top 15 enriched GO BP terms are showed in the bar plot of each disease state in each tissue. Each row represents a significant GO biological process which is colored according to the -log10(p.adjust). |
| Page: 1 2 3 4 5 6 7 8 9 |
| GO ID | Tissue | Disease Stage | Description | Gene Ratio | Bg Ratio | pvalue | p.adjust | Count |
| GO:0051235110 | Esophagus | ESCC | maintenance of location | 200/8552 | 327/18723 | 1.01e-08 | 2.02e-07 | 200 |
| GO:00091002 | Esophagus | ESCC | glycoprotein metabolic process | 226/8552 | 387/18723 | 2.64e-07 | 3.94e-06 | 226 |
| GO:00060668 | Esophagus | ESCC | alcohol metabolic process | 202/8552 | 353/18723 | 7.32e-06 | 7.26e-05 | 202 |
| GO:00091012 | Esophagus | ESCC | glycoprotein biosynthetic process | 181/8552 | 317/18723 | 2.54e-05 | 2.15e-04 | 181 |
| GO:00199155 | Esophagus | ESCC | lipid storage | 58/8552 | 87/18723 | 6.15e-05 | 4.72e-04 | 58 |
| GO:19026524 | Esophagus | ESCC | secondary alcohol metabolic process | 87/8552 | 147/18723 | 6.58e-04 | 3.50e-03 | 87 |
| GO:00082034 | Esophagus | ESCC | cholesterol metabolic process | 79/8552 | 137/18723 | 3.11e-03 | 1.29e-02 | 79 |
| GO:00161254 | Esophagus | ESCC | sterol metabolic process | 86/8552 | 152/18723 | 4.37e-03 | 1.73e-02 | 86 |
| GO:00302586 | Esophagus | ESCC | lipid modification | 116/8552 | 212/18723 | 4.90e-03 | 1.89e-02 | 116 |
| GO:00082023 | Liver | NAFLD | steroid metabolic process | 69/1882 | 319/18723 | 5.90e-10 | 1.28e-07 | 69 |
| GO:00550883 | Liver | NAFLD | lipid homeostasis | 44/1882 | 167/18723 | 1.48e-09 | 2.54e-07 | 44 |
| GO:00302585 | Liver | NAFLD | lipid modification | 49/1882 | 212/18723 | 1.97e-08 | 2.17e-06 | 49 |
| GO:00108765 | Liver | NAFLD | lipid localization | 79/1882 | 448/18723 | 4.75e-07 | 2.92e-05 | 79 |
| GO:00303013 | Liver | NAFLD | cholesterol transport | 30/1882 | 117/18723 | 1.08e-06 | 5.40e-05 | 30 |
| GO:00068694 | Liver | NAFLD | lipid transport | 71/1882 | 398/18723 | 1.16e-06 | 5.59e-05 | 71 |
| GO:00159183 | Liver | NAFLD | sterol transport | 32/1882 | 130/18723 | 1.27e-06 | 6.01e-05 | 32 |
| GO:00426323 | Liver | NAFLD | cholesterol homeostasis | 26/1882 | 96/18723 | 1.83e-06 | 7.86e-05 | 26 |
| GO:00550923 | Liver | NAFLD | sterol homeostasis | 26/1882 | 97/18723 | 2.26e-06 | 9.51e-05 | 26 |
| GO:00718252 | Liver | NAFLD | protein-lipid complex subunit organization | 17/1882 | 50/18723 | 3.92e-06 | 1.54e-04 | 17 |
| GO:0008203 | Liver | NAFLD | cholesterol metabolic process | 32/1882 | 137/18723 | 4.28e-06 | 1.66e-04 | 32 |
| Page: 1 2 3 4 |
| Pathway ID | Tissue | Disease Stage | Description | Gene Ratio | Bg Ratio | pvalue | p.adjust | qvalue | Count |
| hsa001005 | Esophagus | ESCC | Steroid biosynthesis | 18/4205 | 20/8465 | 1.78e-04 | 6.79e-04 | 3.48e-04 | 18 |
| hsa0010012 | Esophagus | ESCC | Steroid biosynthesis | 18/4205 | 20/8465 | 1.78e-04 | 6.79e-04 | 3.48e-04 | 18 |
| hsa049796 | Liver | NAFLD | Cholesterol metabolism | 20/1043 | 51/8465 | 9.73e-07 | 4.56e-05 | 3.67e-05 | 20 |
| hsa0497911 | Liver | NAFLD | Cholesterol metabolism | 20/1043 | 51/8465 | 9.73e-07 | 4.56e-05 | 3.67e-05 | 20 |
| hsa049794 | Liver | HCC | Cholesterol metabolism | 41/4020 | 51/8465 | 1.33e-06 | 1.35e-05 | 7.49e-06 | 41 |
| hsa001002 | Liver | HCC | Steroid biosynthesis | 15/4020 | 20/8465 | 1.17e-02 | 2.97e-02 | 1.65e-02 | 15 |
| hsa049795 | Liver | HCC | Cholesterol metabolism | 41/4020 | 51/8465 | 1.33e-06 | 1.35e-05 | 7.49e-06 | 41 |
| hsa001003 | Liver | HCC | Steroid biosynthesis | 15/4020 | 20/8465 | 1.17e-02 | 2.97e-02 | 1.65e-02 | 15 |
| hsa001004 | Oral cavity | OSCC | Steroid biosynthesis | 15/3704 | 20/8465 | 4.62e-03 | 1.13e-02 | 5.75e-03 | 15 |
| hsa0010011 | Oral cavity | OSCC | Steroid biosynthesis | 15/3704 | 20/8465 | 4.62e-03 | 1.13e-02 | 5.75e-03 | 15 |
| hsa0010021 | Oral cavity | LP | Steroid biosynthesis | 11/2418 | 20/8465 | 1.16e-02 | 3.91e-02 | 2.52e-02 | 11 |
| hsa0010031 | Oral cavity | LP | Steroid biosynthesis | 11/2418 | 20/8465 | 1.16e-02 | 3.91e-02 | 2.52e-02 | 11 |
| Page: 1 |
Top |
Cell-cell communication analysis |
| Identification of potential cell-cell interactions between two cell types and their ligand-receptor pairs for different disease states |
| Ligand | Receptor | LRpair | Pathway | Tissue | Disease Stage |
| Page: 1 |
Top |
Single-cell gene regulatory network inference analysis |
| Find out the significant the regulons (TFs) and the target genes of each regulon across cell types for different disease states |
| TF | Cell Type | Tissue | Disease Stage | Target Gene | RSS | Regulon Activity |
| ∗The dot plots of a searched regulon are shown for all cell subpopulations in each disease state of each tissue based on the regulon specific score inferred using pySCENIC and by calculating the average expression. |
| Page: 1 |
Top |
Somatic mutation of malignant transformation related genes |
| Annotation of somatic variants for genes involved in malignant transformation |
| Hugo Symbol | Variant Class | Variant Classification | dbSNP RS | HGVSc | HGVSp | HGVSp Short | SWISSPROT | BIOTYPE | SIFT | PolyPhen | Tumor Sample Barcode | Tissue | Histology | Sex | Age | Stage | Therapy Types | Drugs | Outcome |
| SOAT1 | SNV | Missense_Mutation | novel | c.1030N>A | p.Leu344Ile | p.L344I | P35610 | protein_coding | deleterious(0.01) | benign(0.25) | TCGA-A2-A25C-01 | Breast | breast invasive carcinoma | Female | <65 | I/II | Chemotherapy | taxotere | SD |
| SOAT1 | SNV | Missense_Mutation | c.1504C>A | p.Leu502Met | p.L502M | P35610 | protein_coding | tolerated(0.46) | benign(0.038) | TCGA-AC-A23H-01 | Breast | breast invasive carcinoma | Female | >=65 | I/II | Unknown | Unknown | PD | |
| SOAT1 | SNV | Missense_Mutation | c.868N>G | p.Pro290Ala | p.P290A | P35610 | protein_coding | tolerated(0.43) | benign(0.021) | TCGA-AN-A0XW-01 | Breast | breast invasive carcinoma | Female | <65 | III/IV | Unknown | Unknown | SD | |
| SOAT1 | SNV | Missense_Mutation | novel | c.1030N>A | p.Leu344Ile | p.L344I | P35610 | protein_coding | deleterious(0.01) | benign(0.25) | TCGA-C8-A274-01 | Breast | breast invasive carcinoma | Female | <65 | I/II | Hormone Therapy | tamoxiphen | SD |
| SOAT1 | SNV | Missense_Mutation | c.613N>T | p.His205Tyr | p.H205Y | P35610 | protein_coding | tolerated(0.5) | benign(0.015) | TCGA-E2-A15O-01 | Breast | breast invasive carcinoma | Female | >=65 | I/II | Hormone Therapy | arimidex | PD | |
| SOAT1 | SNV | Missense_Mutation | c.925N>G | p.Arg309Gly | p.R309G | P35610 | protein_coding | deleterious(0) | probably_damaging(0.997) | TCGA-E2-A1LE-01 | Breast | breast invasive carcinoma | Female | >=65 | III/IV | Chemotherapy | herceptin | PD | |
| SOAT1 | SNV | Missense_Mutation | novel | c.1030C>A | p.Leu344Ile | p.L344I | P35610 | protein_coding | deleterious(0.01) | benign(0.25) | TCGA-LL-A440-01 | Breast | breast invasive carcinoma | Female | <65 | I/II | Chemotherapy | cytoxan | CR |
| SOAT1 | SNV | Missense_Mutation | novel | c.145G>A | p.Ala49Thr | p.A49T | P35610 | protein_coding | tolerated(0.74) | benign(0.003) | TCGA-2W-A8YY-01 | Cervix | cervical & endocervical cancer | Female | <65 | I/II | Chemotherapy | cisplatin | CR |
| SOAT1 | SNV | Missense_Mutation | c.127N>T | p.Asp43Tyr | p.D43Y | P35610 | protein_coding | deleterious(0) | benign(0.24) | TCGA-AA-3697-01 | Colorectum | colon adenocarcinoma | Male | >=65 | I/II | Unknown | Unknown | SD | |
| SOAT1 | SNV | Missense_Mutation | rs143261487 | c.277N>A | p.Ala93Thr | p.A93T | P35610 | protein_coding | tolerated(0.48) | benign(0.11) | TCGA-AA-3950-01 | Colorectum | colon adenocarcinoma | Female | >=65 | I/II | Unknown | Unknown | SD |
| Page: 1 2 3 4 5 6 7 8 |
Top |
Related drugs of malignant transformation related genes |
| Identification of chemicals and drugs interact with genes involved in malignant transfromation |
| (DGIdb 4.0) |
| Entrez ID | Symbol | Category | Interaction Types | Drug Claim Name | Drug Name | PMIDs |
| 6646 | SOAT1 | DRUGGABLE GENOME | NIFEDIPINE | NIFEDIPINE | 3341992,2829803 | |
| 6646 | SOAT1 | DRUGGABLE GENOME | 6-HYDROXYDOPAMINE | 1559138 | ||
| 6646 | SOAT1 | DRUGGABLE GENOME | DEXAMETHASONE | DEXAMETHASONE | 7485476 | |
| 6646 | SOAT1 | DRUGGABLE GENOME | TESTOSTERONE | TESTOSTERONE | 2765620 | |
| 6646 | SOAT1 | DRUGGABLE GENOME | EMZETIBE | |||
| 6646 | SOAT1 | DRUGGABLE GENOME | ATORVASTATIN | ATORVASTATIN | 14644397 | |
| 6646 | SOAT1 | DRUGGABLE GENOME | URSODEOXYCHOLIC ACID | 7949265 | ||
| 6646 | SOAT1 | DRUGGABLE GENOME | LOVASTATIN | LOVASTATIN | 2268271 |
| Page: 1 |

Copyright 2023-Present -The University of Texas Health Science Center at Houston |