
|
|||||
|
 | |
| |
| |
| |
| |
| |
|
Gene: SNX8 |
Gene summary for SNX8 |
| Gene information | Species | Human | Gene symbol | SNX8 | Gene ID | 29886 |
| Gene name | sorting nexin 8 | |
| Gene Alias | Mvp1 | |
| Cytomap | 7p22.3 | |
| Gene Type | protein-coding | GO ID | GO:0006810 | UniProtAcc | Q9Y5X2 |
Top |
Malignant transformation analysis |
| Identification of the aberrant gene expression in precancerous and cancerous lesions by comparing the gene expression of stem-like cells in diseased tissues with normal stem cells |
| Entrez ID | Symbol | Replicates | Species | Organ | Tissue | Adj P-value | Log2FC | Malignancy |
| 29886 | SNX8 | LZE4T | Human | Esophagus | ESCC | 1.22e-04 | 8.14e-02 | 0.0811 |
| 29886 | SNX8 | LZE7T | Human | Esophagus | ESCC | 2.81e-06 | 2.74e-01 | 0.0667 |
| 29886 | SNX8 | LZE24T | Human | Esophagus | ESCC | 4.62e-10 | 2.63e-01 | 0.0596 |
| 29886 | SNX8 | P2T-E | Human | Esophagus | ESCC | 1.52e-20 | 3.29e-01 | 0.1177 |
| 29886 | SNX8 | P4T-E | Human | Esophagus | ESCC | 5.57e-15 | 2.85e-01 | 0.1323 |
| 29886 | SNX8 | P5T-E | Human | Esophagus | ESCC | 3.14e-11 | 2.39e-01 | 0.1327 |
| 29886 | SNX8 | P8T-E | Human | Esophagus | ESCC | 7.00e-05 | 9.27e-02 | 0.0889 |
| 29886 | SNX8 | P9T-E | Human | Esophagus | ESCC | 1.42e-05 | 1.42e-01 | 0.1131 |
| 29886 | SNX8 | P10T-E | Human | Esophagus | ESCC | 2.39e-07 | 1.86e-01 | 0.116 |
| 29886 | SNX8 | P11T-E | Human | Esophagus | ESCC | 3.40e-10 | 3.42e-01 | 0.1426 |
| 29886 | SNX8 | P12T-E | Human | Esophagus | ESCC | 4.52e-10 | 2.09e-01 | 0.1122 |
| 29886 | SNX8 | P15T-E | Human | Esophagus | ESCC | 5.41e-21 | 4.34e-01 | 0.1149 |
| 29886 | SNX8 | P16T-E | Human | Esophagus | ESCC | 1.04e-09 | 2.01e-01 | 0.1153 |
| 29886 | SNX8 | P17T-E | Human | Esophagus | ESCC | 8.92e-05 | 2.54e-01 | 0.1278 |
| 29886 | SNX8 | P20T-E | Human | Esophagus | ESCC | 5.72e-06 | 1.11e-01 | 0.1124 |
| 29886 | SNX8 | P21T-E | Human | Esophagus | ESCC | 1.15e-15 | 3.81e-01 | 0.1617 |
| 29886 | SNX8 | P22T-E | Human | Esophagus | ESCC | 1.75e-16 | 2.53e-01 | 0.1236 |
| 29886 | SNX8 | P23T-E | Human | Esophagus | ESCC | 7.74e-12 | 3.34e-01 | 0.108 |
| 29886 | SNX8 | P24T-E | Human | Esophagus | ESCC | 2.34e-04 | 1.51e-01 | 0.1287 |
| 29886 | SNX8 | P26T-E | Human | Esophagus | ESCC | 2.30e-21 | 4.75e-01 | 0.1276 |
| Page: 1 2 3 4 5 |
| Tissue | Expression Dynamics | Abbreviation |
| Esophagus | 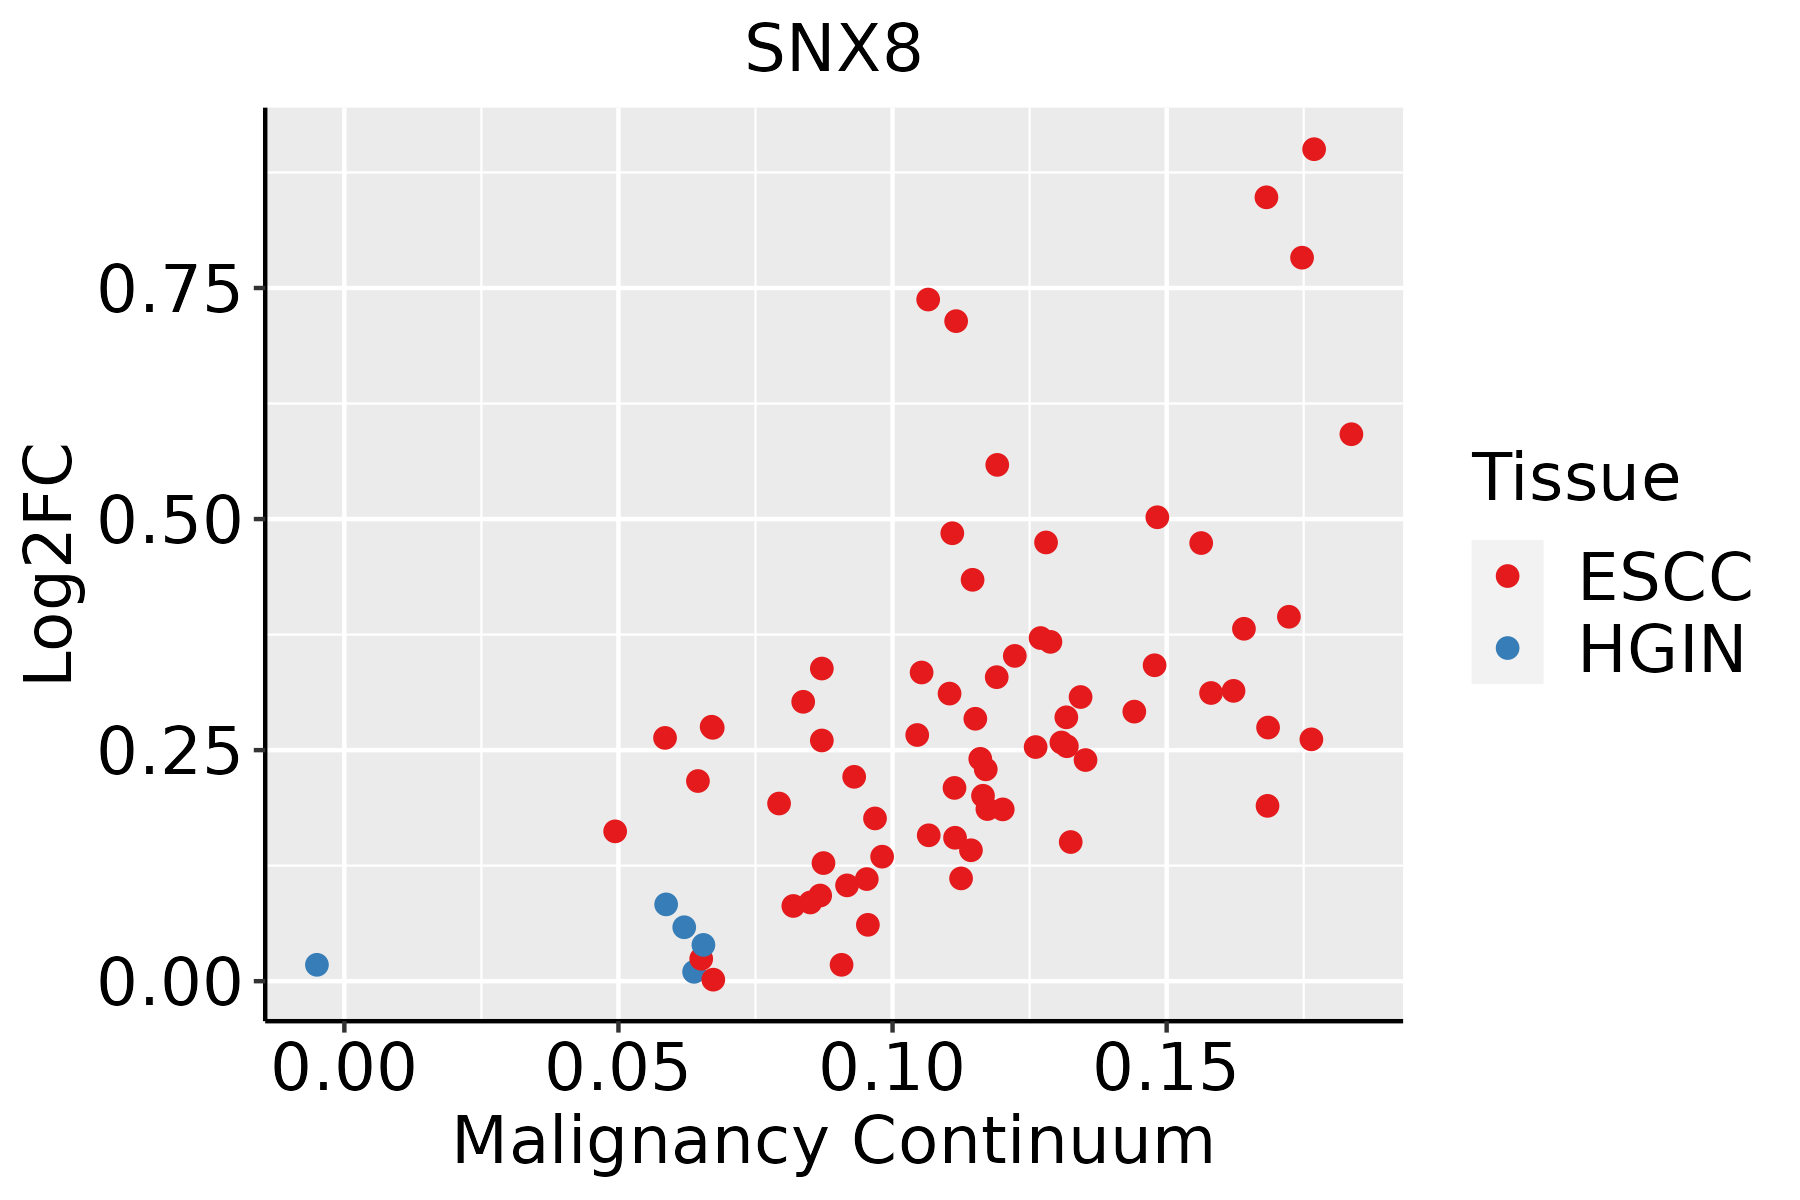 | ESCC: Esophageal squamous cell carcinoma |
| HGIN: High-grade intraepithelial neoplasias | ||
| LGIN: Low-grade intraepithelial neoplasias | ||
| Liver |  | HCC: Hepatocellular carcinoma |
| NAFLD: Non-alcoholic fatty liver disease | ||
| Oral Cavity |  | EOLP: Erosive Oral lichen planus |
| LP: leukoplakia | ||
| NEOLP: Non-erosive oral lichen planus | ||
| OSCC: Oral squamous cell carcinoma | ||
| Thyroid |  | ATC: Anaplastic thyroid cancer |
| HT: Hashimoto's thyroiditis | ||
| PTC: Papillary thyroid cancer |
| ∗log2FC in expression of this searched gene in stem-like cells from each diseased tissue sample relative to stem-like cells in normal samples in each tissue plotted against the malignancy continuum. Samples are colored based on if they are from different disease stage. |
Top |
Malignant transformation related pathway analysis |
| Find out the enriched GO biological processes and KEGG pathways involved in transition from healthy to precancer to cancer |
| Tissue | Disease Stage | Enriched GO biological Processes |
| Colorectum | AD |  |
| Colorectum | SER |  |
| Colorectum | MSS |  |
| Colorectum | MSI-H |  |
| Colorectum | FAP |  |
| ∗Top 15 enriched GO BP terms are showed in the bar plot of each disease state in each tissue. Each row represents a significant GO biological process which is colored according to the -log10(p.adjust). |
| Page: 1 2 3 4 5 6 7 8 9 |
| GO ID | Tissue | Disease Stage | Description | Gene Ratio | Bg Ratio | pvalue | p.adjust | Count |
| GO:004819318 | Esophagus | ESCC | Golgi vesicle transport | 231/8552 | 296/18723 | 1.82e-30 | 9.63e-28 | 231 |
| GO:001619715 | Esophagus | ESCC | endosomal transport | 168/8552 | 230/18723 | 2.28e-17 | 1.93e-15 | 168 |
| GO:001648210 | Esophagus | ESCC | cytosolic transport | 124/8552 | 168/18723 | 9.69e-14 | 4.69e-12 | 124 |
| GO:00421477 | Esophagus | ESCC | retrograde transport, endosome to Golgi | 63/8552 | 91/18723 | 4.58e-06 | 4.87e-05 | 63 |
| GO:004819321 | Liver | HCC | Golgi vesicle transport | 217/7958 | 296/18723 | 2.58e-27 | 1.02e-24 | 217 |
| GO:001619721 | Liver | HCC | endosomal transport | 154/7958 | 230/18723 | 4.74e-14 | 2.95e-12 | 154 |
| GO:001648221 | Liver | HCC | cytosolic transport | 117/7958 | 168/18723 | 8.83e-13 | 4.48e-11 | 117 |
| GO:004214721 | Liver | HCC | retrograde transport, endosome to Golgi | 61/7958 | 91/18723 | 1.94e-06 | 2.68e-05 | 61 |
| GO:004819315 | Oral cavity | OSCC | Golgi vesicle transport | 209/7305 | 296/18723 | 1.39e-28 | 6.30e-26 | 209 |
| GO:00161979 | Oral cavity | OSCC | endosomal transport | 141/7305 | 230/18723 | 5.40e-12 | 2.06e-10 | 141 |
| GO:00164829 | Oral cavity | OSCC | cytosolic transport | 106/7305 | 168/18723 | 2.08e-10 | 5.90e-09 | 106 |
| GO:00421476 | Oral cavity | OSCC | retrograde transport, endosome to Golgi | 55/7305 | 91/18723 | 2.79e-05 | 2.59e-04 | 55 |
| GO:004819320 | Thyroid | PTC | Golgi vesicle transport | 186/5968 | 296/18723 | 3.09e-28 | 1.22e-25 | 186 |
| GO:001619718 | Thyroid | PTC | endosomal transport | 128/5968 | 230/18723 | 6.26e-14 | 3.52e-12 | 128 |
| GO:001648217 | Thyroid | PTC | cytosolic transport | 92/5968 | 168/18723 | 6.41e-10 | 1.97e-08 | 92 |
| GO:00421479 | Thyroid | PTC | retrograde transport, endosome to Golgi | 48/5968 | 91/18723 | 2.86e-05 | 2.78e-04 | 48 |
| GO:0048193111 | Thyroid | ATC | Golgi vesicle transport | 189/6293 | 296/18723 | 9.58e-27 | 5.05e-24 | 189 |
| GO:001619719 | Thyroid | ATC | endosomal transport | 128/6293 | 230/18723 | 4.44e-12 | 1.75e-10 | 128 |
| GO:001648218 | Thyroid | ATC | cytosolic transport | 93/6293 | 168/18723 | 5.19e-09 | 1.15e-07 | 93 |
| GO:004214715 | Thyroid | ATC | retrograde transport, endosome to Golgi | 49/6293 | 91/18723 | 5.48e-05 | 4.23e-04 | 49 |
| Page: 1 |
| Pathway ID | Tissue | Disease Stage | Description | Gene Ratio | Bg Ratio | pvalue | p.adjust | qvalue | Count |
| Page: 1 |
Top |
Cell-cell communication analysis |
| Identification of potential cell-cell interactions between two cell types and their ligand-receptor pairs for different disease states |
| Ligand | Receptor | LRpair | Pathway | Tissue | Disease Stage |
| Page: 1 |
Top |
Single-cell gene regulatory network inference analysis |
| Find out the significant the regulons (TFs) and the target genes of each regulon across cell types for different disease states |
| TF | Cell Type | Tissue | Disease Stage | Target Gene | RSS | Regulon Activity |
| ∗The dot plots of a searched regulon are shown for all cell subpopulations in each disease state of each tissue based on the regulon specific score inferred using pySCENIC and by calculating the average expression. |
| Page: 1 |
Top |
Somatic mutation of malignant transformation related genes |
| Annotation of somatic variants for genes involved in malignant transformation |
| Hugo Symbol | Variant Class | Variant Classification | dbSNP RS | HGVSc | HGVSp | HGVSp Short | SWISSPROT | BIOTYPE | SIFT | PolyPhen | Tumor Sample Barcode | Tissue | Histology | Sex | Age | Stage | Therapy Types | Drugs | Outcome |
| SNX8 | SNV | Missense_Mutation | c.685N>C | p.Tyr229His | p.Y229H | Q9Y5X2 | protein_coding | tolerated(0.36) | benign(0.003) | TCGA-D8-A147-01 | Breast | breast invasive carcinoma | Female | <65 | I/II | Chemotherapy | doxorubicine | SD | |
| SNX8 | SNV | Missense_Mutation | rs754455290 | c.1373C>T | p.Pro458Leu | p.P458L | Q9Y5X2 | protein_coding | deleterious(0.05) | benign(0.243) | TCGA-GI-A2C9-01 | Breast | breast invasive carcinoma | Female | <65 | I/II | Unspecific | SD | |
| SNX8 | SNV | Missense_Mutation | novel | c.1316A>C | p.Lys439Thr | p.K439T | Q9Y5X2 | protein_coding | tolerated(0.19) | benign(0.018) | TCGA-FU-A3HZ-01 | Cervix | cervical & endocervical cancer | Female | <65 | I/II | Chemotherapy | cisplatin | CR |
| SNX8 | SNV | Missense_Mutation | c.400C>T | p.Pro134Ser | p.P134S | Q9Y5X2 | protein_coding | deleterious(0) | probably_damaging(0.986) | TCGA-MY-A5BE-01 | Cervix | cervical & endocervical cancer | Female | <65 | I/II | Unknown | Unknown | SD | |
| SNX8 | SNV | Missense_Mutation | novel | c.826N>G | p.Leu276Val | p.L276V | Q9Y5X2 | protein_coding | tolerated(0.56) | benign(0.007) | TCGA-5M-AATE-01 | Colorectum | colon adenocarcinoma | Male | >=65 | I/II | Unknown | Unknown | PD |
| SNX8 | SNV | Missense_Mutation | c.523N>A | p.Leu175Met | p.L175M | Q9Y5X2 | protein_coding | deleterious(0.01) | probably_damaging(0.999) | TCGA-A6-2686-01 | Colorectum | colon adenocarcinoma | Female | >=65 | I/II | Unknown | Unknown | SD | |
| SNX8 | SNV | Missense_Mutation | c.727N>A | p.Ala243Thr | p.A243T | Q9Y5X2 | protein_coding | tolerated(0.11) | benign(0.019) | TCGA-AA-3864-01 | Colorectum | colon adenocarcinoma | Male | >=65 | I/II | Unknown | Unknown | SD | |
| SNX8 | SNV | Missense_Mutation | c.1082C>T | p.Ala361Val | p.A361V | Q9Y5X2 | protein_coding | tolerated(1) | benign(0.003) | TCGA-AD-6964-01 | Colorectum | colon adenocarcinoma | Male | <65 | III/IV | Chemotherapy | folfox | PD | |
| SNX8 | SNV | Missense_Mutation | novel | c.397N>A | p.Pro133Thr | p.P133T | Q9Y5X2 | protein_coding | deleterious(0) | probably_damaging(1) | TCGA-AZ-4315-01 | Colorectum | colon adenocarcinoma | Male | <65 | I/II | Unknown | Unknown | SD |
| SNX8 | SNV | Missense_Mutation | novel | c.301C>T | p.Arg101Cys | p.R101C | Q9Y5X2 | protein_coding | deleterious(0.03) | benign(0.304) | TCGA-A5-A1OF-01 | Endometrium | uterine corpus endometrioid carcinoma | Female | <65 | I/II | Unknown | Unknown | SD |
| Page: 1 2 3 4 |
Top |
Related drugs of malignant transformation related genes |
| Identification of chemicals and drugs interact with genes involved in malignant transfromation |
| (DGIdb 4.0) |
| Entrez ID | Symbol | Category | Interaction Types | Drug Claim Name | Drug Name | PMIDs |
| Page: 1 |

Copyright 2023-Present -The University of Texas Health Science Center at Houston |