
|
|||||
|
 | |
| |
| |
| |
| |
| |
|
Gene: SNX6 |
Gene summary for SNX6 |
| Gene information | Species | Human | Gene symbol | SNX6 | Gene ID | 58533 |
| Gene name | sorting nexin 6 | |
| Gene Alias | MSTP010 | |
| Cytomap | 14q13.1 | |
| Gene Type | protein-coding | GO ID | GO:0001932 | UniProtAcc | Q9UNH7 |
Top |
Malignant transformation analysis |
| Identification of the aberrant gene expression in precancerous and cancerous lesions by comparing the gene expression of stem-like cells in diseased tissues with normal stem cells |
| Entrez ID | Symbol | Replicates | Species | Organ | Tissue | Adj P-value | Log2FC | Malignancy |
| 58533 | SNX6 | HTA11_3410_2000001011 | Human | Colorectum | AD | 2.54e-02 | -2.73e-01 | 0.0155 |
| 58533 | SNX6 | HTA11_347_2000001011 | Human | Colorectum | AD | 7.36e-04 | 4.03e-01 | -0.1954 |
| 58533 | SNX6 | F007 | Human | Colorectum | FAP | 2.24e-02 | -3.17e-01 | 0.1176 |
| 58533 | SNX6 | A002-C-010 | Human | Colorectum | FAP | 3.65e-02 | -2.91e-01 | 0.242 |
| 58533 | SNX6 | A001-C-207 | Human | Colorectum | FAP | 1.65e-02 | -2.20e-01 | 0.1278 |
| 58533 | SNX6 | A015-C-203 | Human | Colorectum | FAP | 2.74e-23 | -2.57e-01 | -0.1294 |
| 58533 | SNX6 | A015-C-204 | Human | Colorectum | FAP | 1.91e-04 | -2.34e-01 | -0.0228 |
| 58533 | SNX6 | A014-C-040 | Human | Colorectum | FAP | 4.45e-03 | -2.75e-01 | -0.1184 |
| 58533 | SNX6 | A002-C-201 | Human | Colorectum | FAP | 2.04e-12 | -3.26e-01 | 0.0324 |
| 58533 | SNX6 | A002-C-203 | Human | Colorectum | FAP | 2.33e-04 | -1.85e-01 | 0.2786 |
| 58533 | SNX6 | A001-C-108 | Human | Colorectum | FAP | 1.66e-10 | -1.67e-01 | -0.0272 |
| 58533 | SNX6 | A002-C-205 | Human | Colorectum | FAP | 6.47e-16 | -1.55e-01 | -0.1236 |
| 58533 | SNX6 | A015-C-006 | Human | Colorectum | FAP | 1.06e-11 | -2.66e-01 | -0.0994 |
| 58533 | SNX6 | A015-C-106 | Human | Colorectum | FAP | 3.48e-09 | -1.78e-01 | -0.0511 |
| 58533 | SNX6 | A002-C-114 | Human | Colorectum | FAP | 5.25e-13 | -2.48e-01 | -0.1561 |
| 58533 | SNX6 | A015-C-104 | Human | Colorectum | FAP | 3.97e-29 | -1.18e-01 | -0.1899 |
| 58533 | SNX6 | A001-C-014 | Human | Colorectum | FAP | 2.94e-11 | -2.97e-01 | 0.0135 |
| 58533 | SNX6 | A002-C-016 | Human | Colorectum | FAP | 1.56e-15 | -2.21e-01 | 0.0521 |
| 58533 | SNX6 | A015-C-002 | Human | Colorectum | FAP | 6.37e-08 | -1.60e-01 | -0.0763 |
| 58533 | SNX6 | A001-C-203 | Human | Colorectum | FAP | 3.54e-07 | -1.14e-01 | -0.0481 |
| Page: 1 2 3 4 5 6 7 8 9 |
| Tissue | Expression Dynamics | Abbreviation |
| Colorectum (GSE201348) |  | FAP: Familial adenomatous polyposis |
| CRC: Colorectal cancer | ||
| Colorectum (HTA11) | 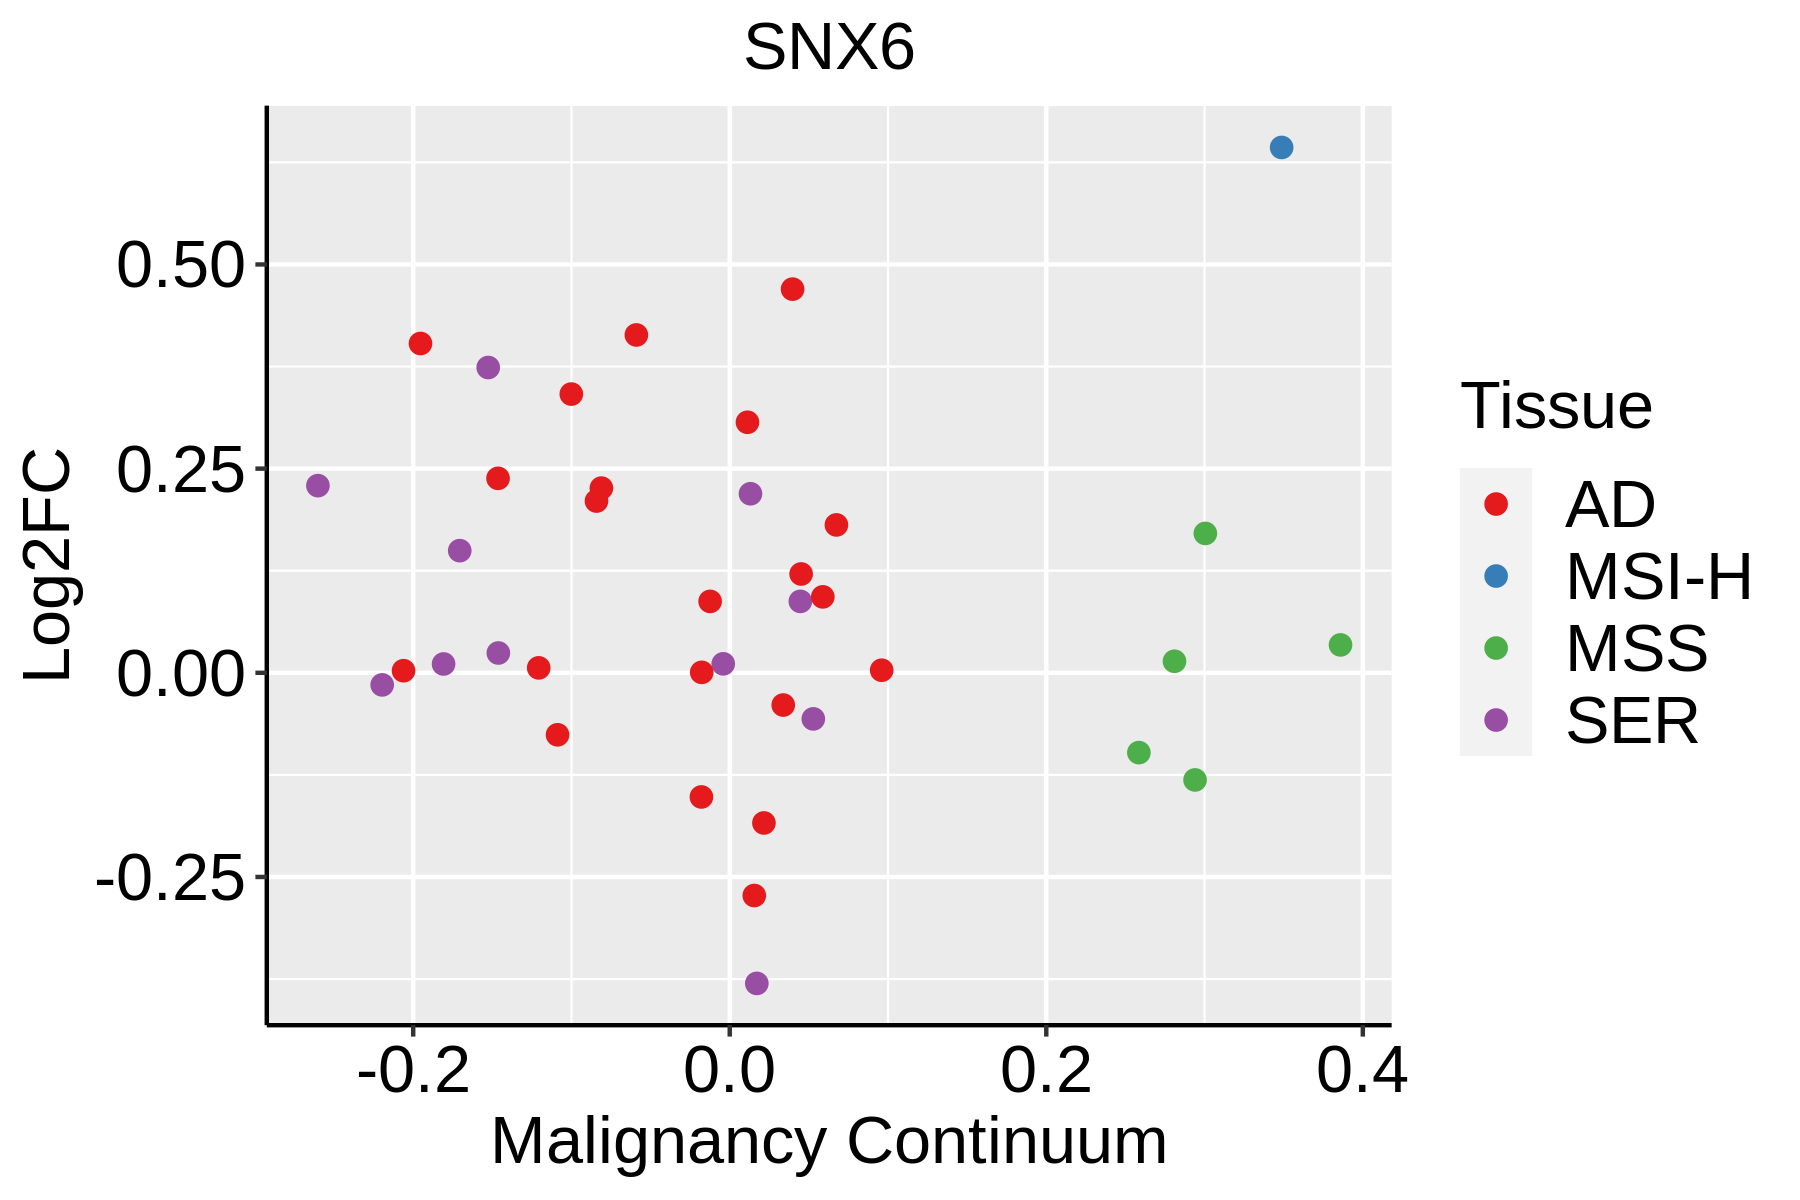 | AD: Adenomas |
| SER: Sessile serrated lesions | ||
| MSI-H: Microsatellite-high colorectal cancer | ||
| MSS: Microsatellite stable colorectal cancer | ||
| Esophagus | 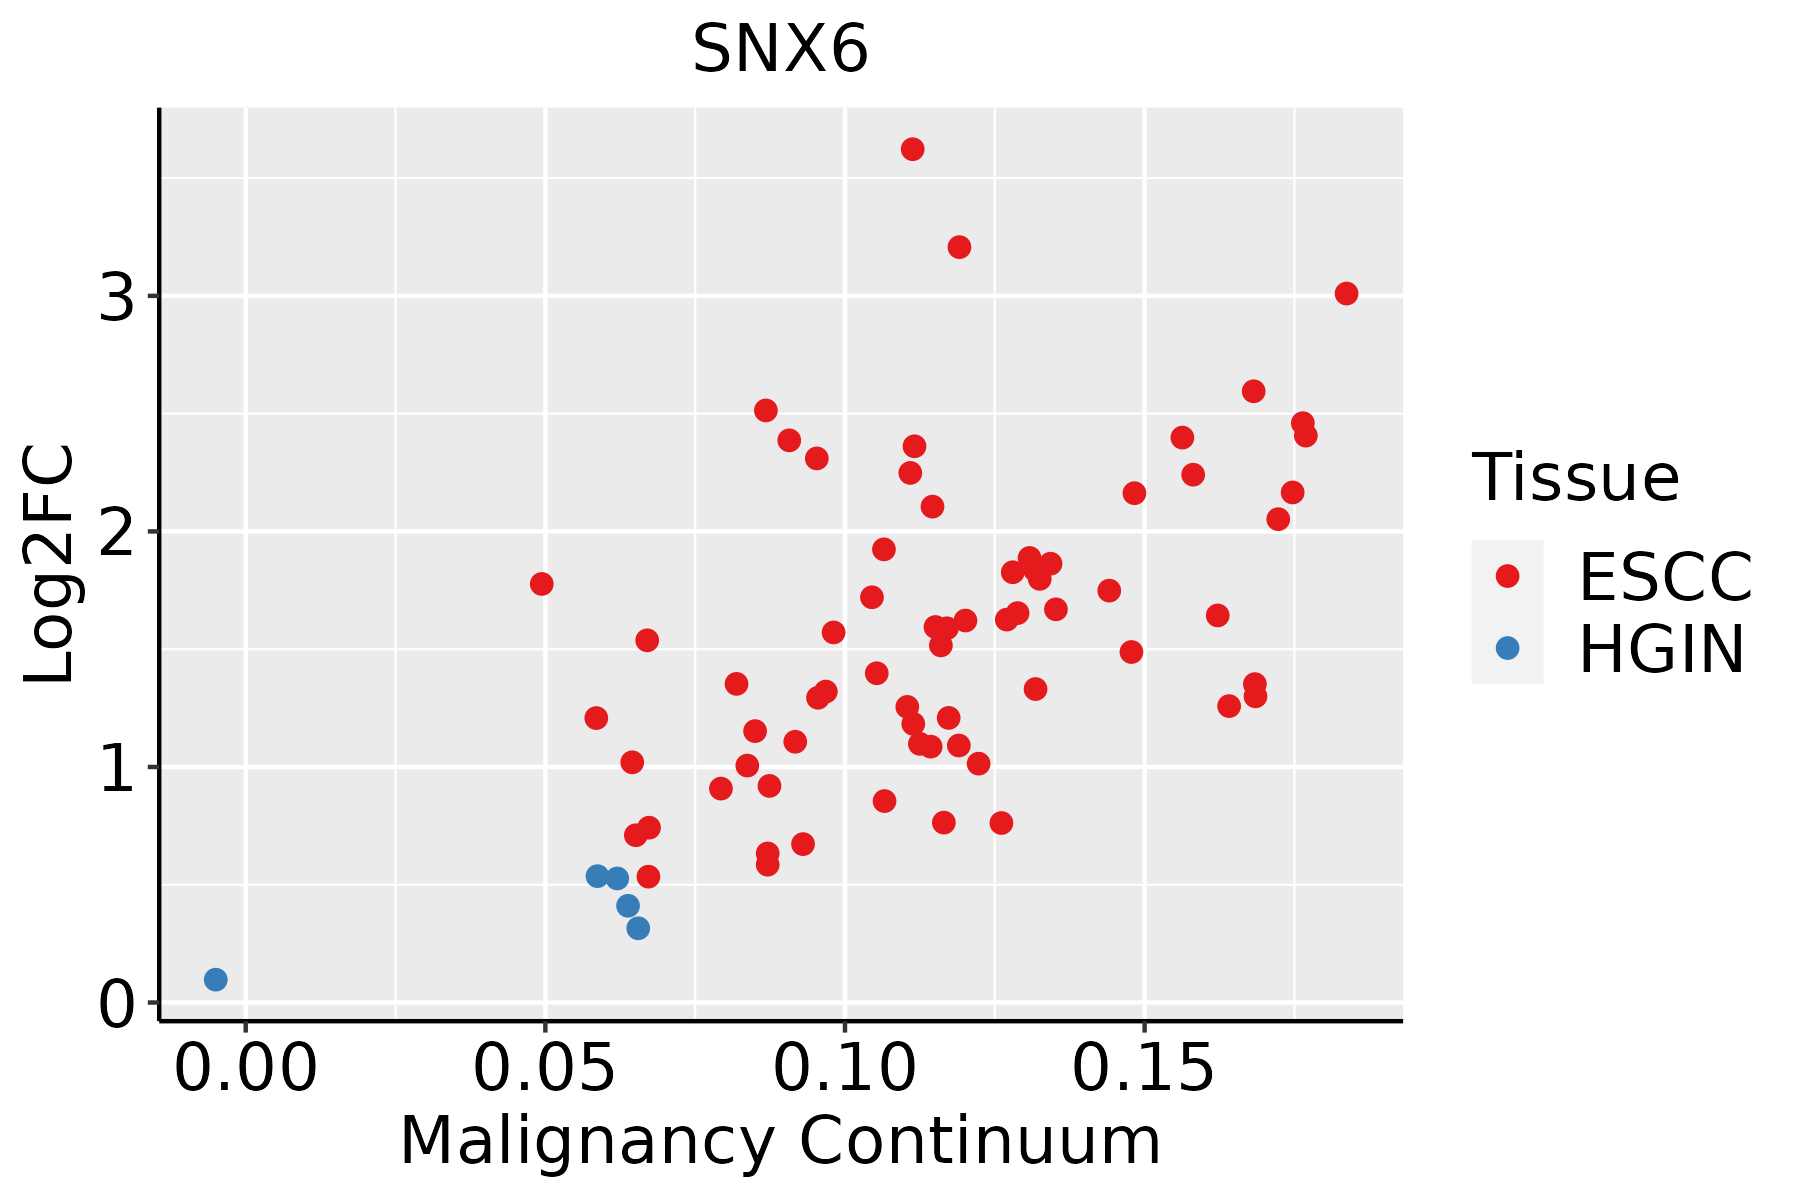 | ESCC: Esophageal squamous cell carcinoma |
| HGIN: High-grade intraepithelial neoplasias | ||
| LGIN: Low-grade intraepithelial neoplasias | ||
| Liver |  | HCC: Hepatocellular carcinoma |
| NAFLD: Non-alcoholic fatty liver disease | ||
| Oral Cavity |  | EOLP: Erosive Oral lichen planus |
| LP: leukoplakia | ||
| NEOLP: Non-erosive oral lichen planus | ||
| OSCC: Oral squamous cell carcinoma | ||
| Prostate |  | BPH: Benign Prostatic Hyperplasia |
| Skin | 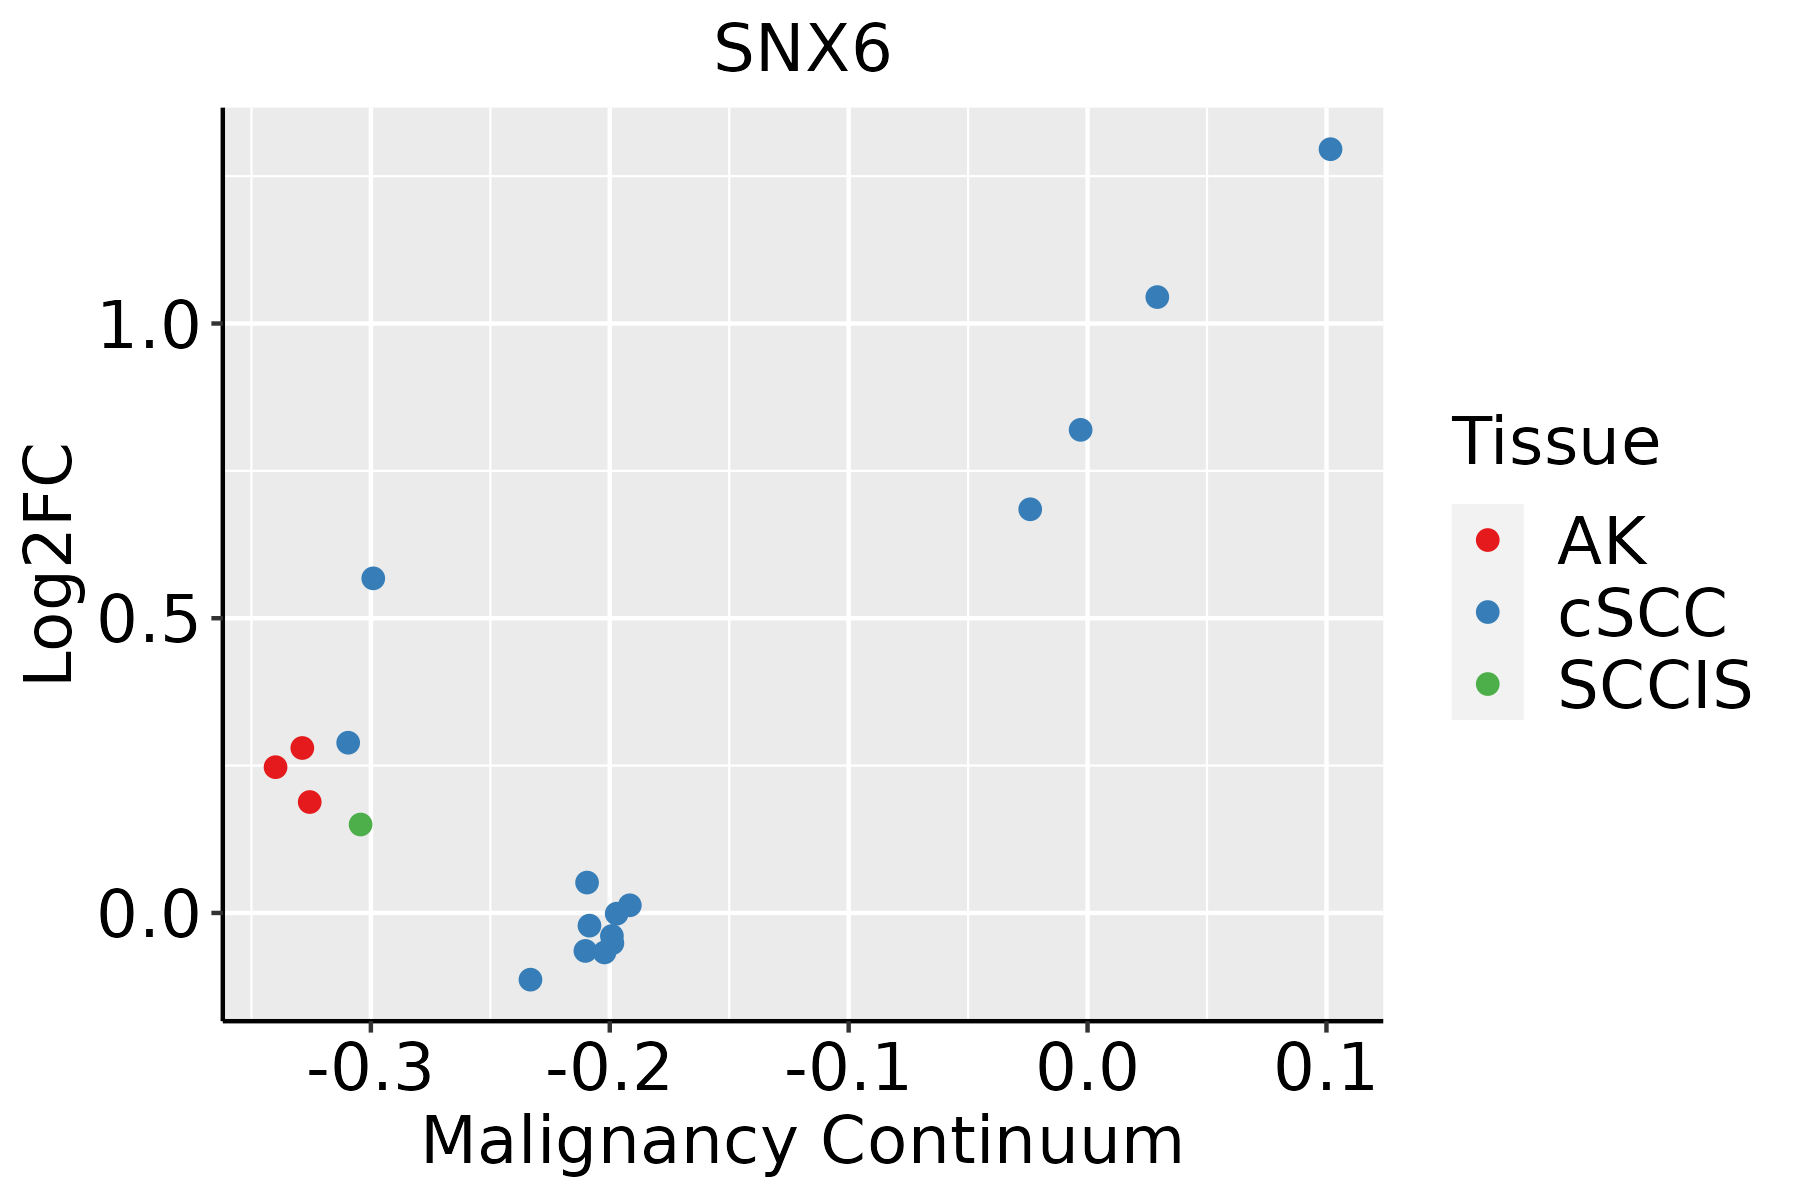 | AK: Actinic keratosis |
| cSCC: Cutaneous squamous cell carcinoma | ||
| SCCIS:squamous cell carcinoma in situ | ||
| Thyroid | 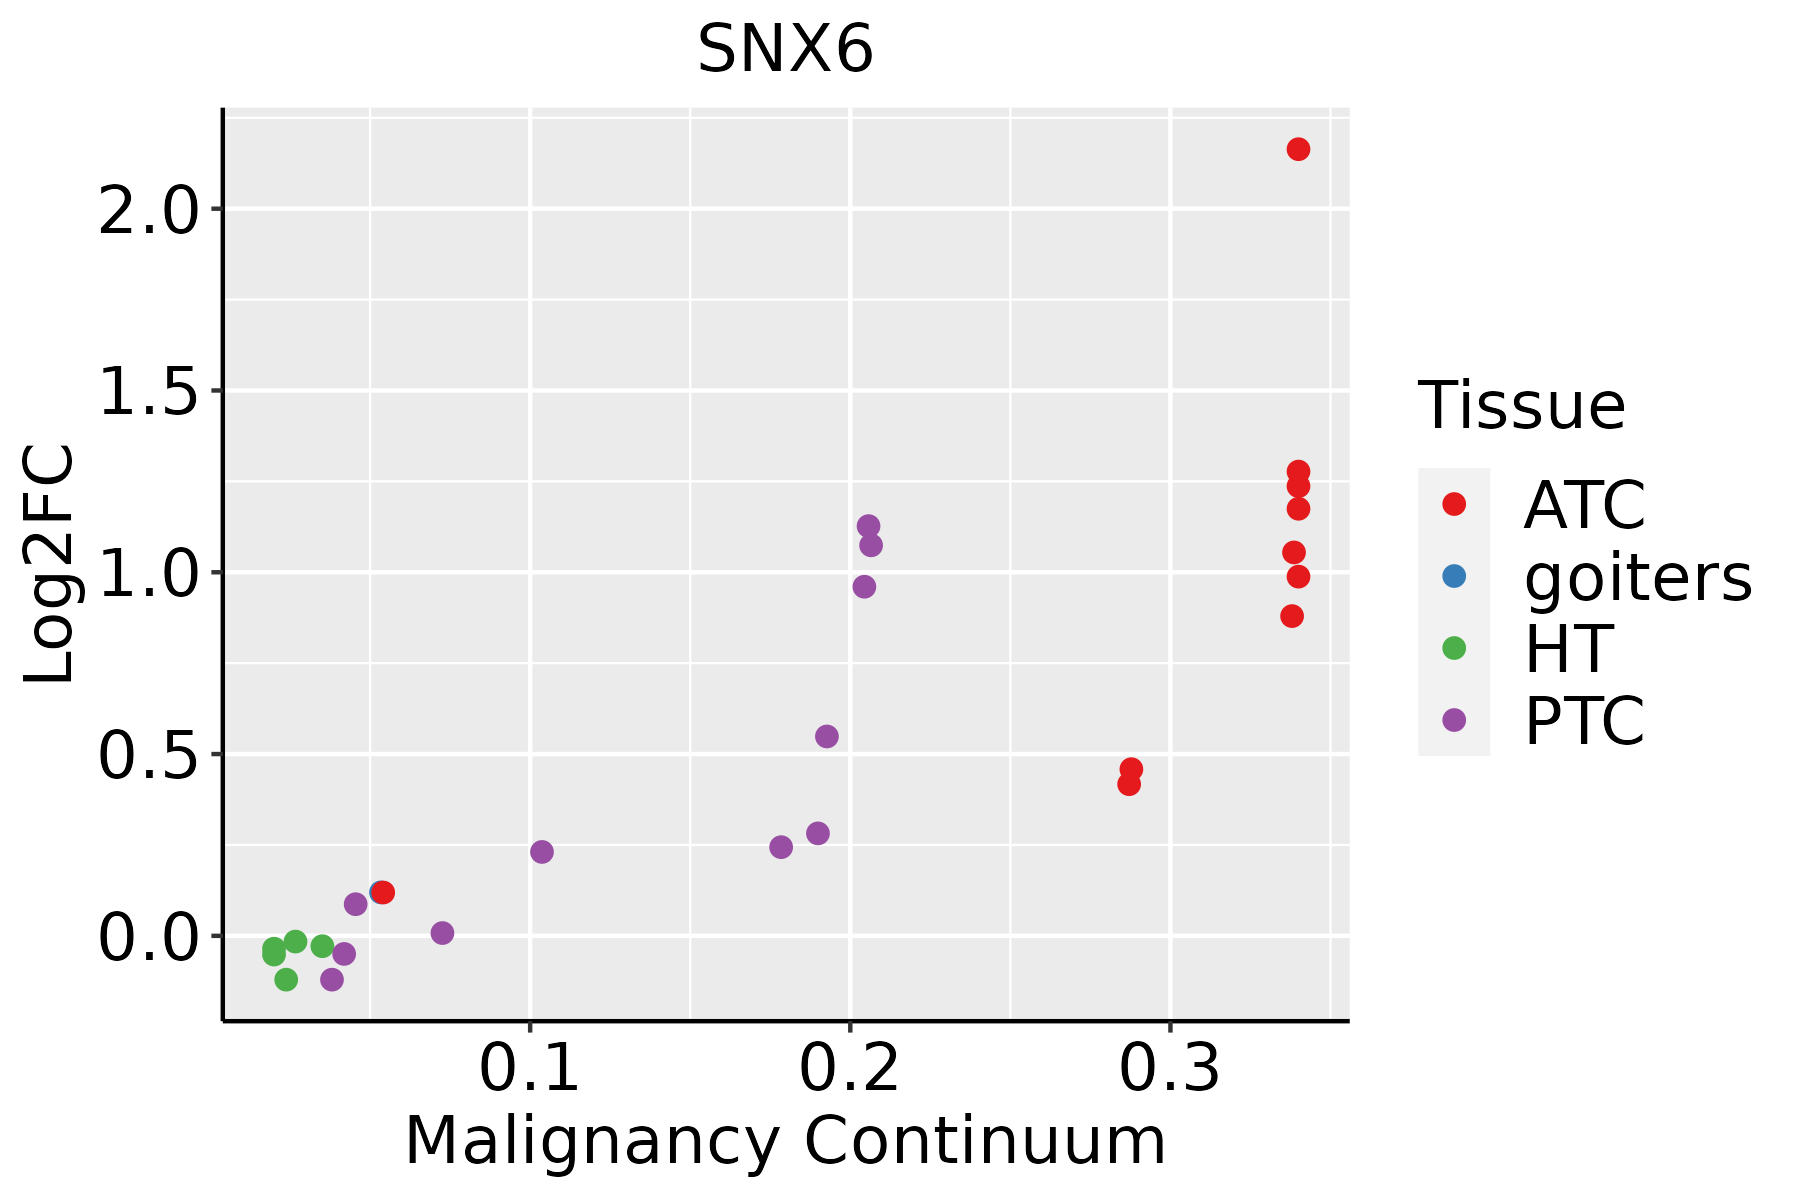 | ATC: Anaplastic thyroid cancer |
| HT: Hashimoto's thyroiditis | ||
| PTC: Papillary thyroid cancer |
| ∗log2FC in expression of this searched gene in stem-like cells from each diseased tissue sample relative to stem-like cells in normal samples in each tissue plotted against the malignancy continuum. Samples are colored based on if they are from different disease stage. |
Top |
Malignant transformation related pathway analysis |
| Find out the enriched GO biological processes and KEGG pathways involved in transition from healthy to precancer to cancer |
| Tissue | Disease Stage | Enriched GO biological Processes |
| Colorectum | AD |  |
| Colorectum | SER |  |
| Colorectum | MSS |  |
| Colorectum | MSI-H |  |
| Colorectum | FAP |  |
| ∗Top 15 enriched GO BP terms are showed in the bar plot of each disease state in each tissue. Each row represents a significant GO biological process which is colored according to the -log10(p.adjust). |
| Page: 1 2 3 4 5 6 7 8 9 |
| GO ID | Tissue | Disease Stage | Description | Gene Ratio | Bg Ratio | pvalue | p.adjust | Count |
| GO:0016197 | Colorectum | AD | endosomal transport | 90/3918 | 230/18723 | 1.88e-10 | 1.73e-08 | 90 |
| GO:0038127 | Colorectum | AD | ERBB signaling pathway | 55/3918 | 121/18723 | 1.19e-09 | 8.85e-08 | 55 |
| GO:0007173 | Colorectum | AD | epidermal growth factor receptor signaling pathway | 50/3918 | 108/18723 | 3.08e-09 | 2.07e-07 | 50 |
| GO:0010506 | Colorectum | AD | regulation of autophagy | 111/3918 | 317/18723 | 3.57e-09 | 2.35e-07 | 111 |
| GO:0016482 | Colorectum | AD | cytosolic transport | 68/3918 | 168/18723 | 6.00e-09 | 3.72e-07 | 68 |
| GO:0016236 | Colorectum | AD | macroautophagy | 103/3918 | 291/18723 | 6.76e-09 | 4.15e-07 | 103 |
| GO:1901653 | Colorectum | AD | cellular response to peptide | 114/3918 | 359/18723 | 8.32e-07 | 2.88e-05 | 114 |
| GO:0070997 | Colorectum | AD | neuron death | 114/3918 | 361/18723 | 1.13e-06 | 3.72e-05 | 114 |
| GO:1901185 | Colorectum | AD | negative regulation of ERBB signaling pathway | 19/3918 | 32/18723 | 2.39e-06 | 6.98e-05 | 19 |
| GO:1901184 | Colorectum | AD | regulation of ERBB signaling pathway | 34/3918 | 79/18723 | 7.46e-06 | 1.82e-04 | 34 |
| GO:0010563 | Colorectum | AD | negative regulation of phosphorus metabolic process | 130/3918 | 442/18723 | 1.26e-05 | 2.76e-04 | 130 |
| GO:1901214 | Colorectum | AD | regulation of neuron death | 99/3918 | 319/18723 | 1.26e-05 | 2.76e-04 | 99 |
| GO:0042147 | Colorectum | AD | retrograde transport, endosome to Golgi | 37/3918 | 91/18723 | 1.46e-05 | 3.14e-04 | 37 |
| GO:0045936 | Colorectum | AD | negative regulation of phosphate metabolic process | 129/3918 | 441/18723 | 1.81e-05 | 3.76e-04 | 129 |
| GO:0051348 | Colorectum | AD | negative regulation of transferase activity | 85/3918 | 268/18723 | 2.07e-05 | 4.19e-04 | 85 |
| GO:0042058 | Colorectum | AD | regulation of epidermal growth factor receptor signaling pathway | 31/3918 | 73/18723 | 2.56e-05 | 4.89e-04 | 31 |
| GO:0042059 | Colorectum | AD | negative regulation of epidermal growth factor receptor signaling pathway | 16/3918 | 28/18723 | 2.96e-05 | 5.46e-04 | 16 |
| GO:0070849 | Colorectum | AD | response to epidermal growth factor | 23/3918 | 49/18723 | 4.18e-05 | 7.37e-04 | 23 |
| GO:0016241 | Colorectum | AD | regulation of macroautophagy | 50/3918 | 141/18723 | 4.55e-05 | 7.92e-04 | 50 |
| GO:0042326 | Colorectum | AD | negative regulation of phosphorylation | 112/3918 | 385/18723 | 8.02e-05 | 1.27e-03 | 112 |
| Page: 1 2 3 4 5 6 7 8 9 10 11 12 13 14 15 16 17 18 19 20 21 22 23 24 25 26 27 28 |
| Pathway ID | Tissue | Disease Stage | Description | Gene Ratio | Bg Ratio | pvalue | p.adjust | qvalue | Count |
| hsa04144 | Colorectum | AD | Endocytosis | 111/2092 | 251/8465 | 5.95e-12 | 1.42e-10 | 9.08e-11 | 111 |
| hsa041441 | Colorectum | AD | Endocytosis | 111/2092 | 251/8465 | 5.95e-12 | 1.42e-10 | 9.08e-11 | 111 |
| hsa041446 | Colorectum | FAP | Endocytosis | 78/1404 | 251/8465 | 6.20e-09 | 2.96e-07 | 1.80e-07 | 78 |
| hsa041447 | Colorectum | FAP | Endocytosis | 78/1404 | 251/8465 | 6.20e-09 | 2.96e-07 | 1.80e-07 | 78 |
| hsa041448 | Colorectum | CRC | Endocytosis | 65/1091 | 251/8465 | 1.27e-08 | 1.06e-06 | 7.19e-07 | 65 |
| hsa041449 | Colorectum | CRC | Endocytosis | 65/1091 | 251/8465 | 1.27e-08 | 1.06e-06 | 7.19e-07 | 65 |
| hsa0414429 | Esophagus | HGIN | Endocytosis | 76/1383 | 251/8465 | 1.74e-08 | 3.34e-07 | 2.65e-07 | 76 |
| hsa04144113 | Esophagus | HGIN | Endocytosis | 76/1383 | 251/8465 | 1.74e-08 | 3.34e-07 | 2.65e-07 | 76 |
| hsa04144210 | Esophagus | ESCC | Endocytosis | 186/4205 | 251/8465 | 9.74e-16 | 4.66e-14 | 2.39e-14 | 186 |
| hsa0414437 | Esophagus | ESCC | Endocytosis | 186/4205 | 251/8465 | 9.74e-16 | 4.66e-14 | 2.39e-14 | 186 |
| hsa0414412 | Liver | Cirrhotic | Endocytosis | 119/2530 | 251/8465 | 2.33e-09 | 4.56e-08 | 2.81e-08 | 119 |
| hsa0414413 | Liver | Cirrhotic | Endocytosis | 119/2530 | 251/8465 | 2.33e-09 | 4.56e-08 | 2.81e-08 | 119 |
| hsa0414422 | Liver | HCC | Endocytosis | 178/4020 | 251/8465 | 2.03e-14 | 5.22e-13 | 2.91e-13 | 178 |
| hsa0414432 | Liver | HCC | Endocytosis | 178/4020 | 251/8465 | 2.03e-14 | 5.22e-13 | 2.91e-13 | 178 |
| hsa0414427 | Oral cavity | OSCC | Endocytosis | 174/3704 | 251/8465 | 9.42e-17 | 4.51e-15 | 2.29e-15 | 174 |
| hsa04144112 | Oral cavity | OSCC | Endocytosis | 174/3704 | 251/8465 | 9.42e-17 | 4.51e-15 | 2.29e-15 | 174 |
| hsa0414428 | Oral cavity | LP | Endocytosis | 121/2418 | 251/8465 | 1.89e-11 | 3.70e-10 | 2.38e-10 | 121 |
| hsa0414436 | Oral cavity | LP | Endocytosis | 121/2418 | 251/8465 | 1.89e-11 | 3.70e-10 | 2.38e-10 | 121 |
| hsa0414442 | Oral cavity | EOLP | Endocytosis | 71/1218 | 251/8465 | 5.28e-09 | 8.97e-08 | 5.29e-08 | 71 |
| hsa0414452 | Oral cavity | EOLP | Endocytosis | 71/1218 | 251/8465 | 5.28e-09 | 8.97e-08 | 5.29e-08 | 71 |
| Page: 1 2 |
Top |
Cell-cell communication analysis |
| Identification of potential cell-cell interactions between two cell types and their ligand-receptor pairs for different disease states |
| Ligand | Receptor | LRpair | Pathway | Tissue | Disease Stage |
| Page: 1 |
Top |
Single-cell gene regulatory network inference analysis |
| Find out the significant the regulons (TFs) and the target genes of each regulon across cell types for different disease states |
| TF | Cell Type | Tissue | Disease Stage | Target Gene | RSS | Regulon Activity |
| ∗The dot plots of a searched regulon are shown for all cell subpopulations in each disease state of each tissue based on the regulon specific score inferred using pySCENIC and by calculating the average expression. |
| Page: 1 |
Top |
Somatic mutation of malignant transformation related genes |
| Annotation of somatic variants for genes involved in malignant transformation |
| Hugo Symbol | Variant Class | Variant Classification | dbSNP RS | HGVSc | HGVSp | HGVSp Short | SWISSPROT | BIOTYPE | SIFT | PolyPhen | Tumor Sample Barcode | Tissue | Histology | Sex | Age | Stage | Therapy Types | Drugs | Outcome |
| SNX6 | SNV | Missense_Mutation | novel | c.685N>A | p.Leu229Ile | p.L229I | protein_coding | deleterious(0.03) | benign(0.401) | TCGA-AN-A046-01 | Breast | breast invasive carcinoma | Female | >=65 | I/II | Unknown | Unknown | SD | |
| SNX6 | SNV | Missense_Mutation | c.230C>T | p.Ser77Leu | p.S77L | protein_coding | tolerated(0.1) | benign(0.251) | TCGA-C8-A1HM-01 | Breast | breast invasive carcinoma | Female | >=65 | I/II | Chemotherapy | doxorubicin | CR | ||
| SNX6 | SNV | Missense_Mutation | c.1234G>T | p.Ala412Ser | p.A412S | protein_coding | tolerated(0.61) | benign(0.007) | TCGA-E2-A1LH-01 | Breast | breast invasive carcinoma | Female | <65 | I/II | Chemotherapy | adriamycin | SD | ||
| SNX6 | insertion | Frame_Shift_Ins | novel | c.972_973insTGTAATTCCAGTTC | p.Arg325CysfsTer10 | p.R325Cfs*10 | protein_coding | TCGA-AR-A0U0-01 | Breast | breast invasive carcinoma | Female | >=65 | I/II | Unknown | Unknown | SD | |||
| SNX6 | SNV | Missense_Mutation | rs745343835 | c.634N>A | p.Val212Ile | p.V212I | protein_coding | tolerated(0.41) | benign(0.072) | TCGA-2W-A8YY-01 | Cervix | cervical & endocervical cancer | Female | <65 | I/II | Chemotherapy | cisplatin | CR | |
| SNX6 | SNV | Missense_Mutation | novel | c.1180G>C | p.Glu394Gln | p.E394Q | protein_coding | tolerated(0.08) | probably_damaging(0.999) | TCGA-VS-A958-01 | Cervix | cervical & endocervical cancer | Female | <65 | I/II | Chemotherapy | cisplatin | CR | |
| SNX6 | deletion | Frame_Shift_Del | c.1037delA | p.Asn346IlefsTer30 | p.N346Ifs*30 | protein_coding | TCGA-A6-3809-01 | Colorectum | colon adenocarcinoma | Female | >=65 | I/II | Unknown | Unknown | SD | ||||
| SNX6 | insertion | Frame_Shift_Ins | novel | c.61_62insTTCCCCACAGGAAGGCCTGGACGACGGCC | p.Pro21LeufsTer24 | p.P21Lfs*24 | protein_coding | TCGA-AZ-5403-01 | Colorectum | colon adenocarcinoma | Male | <65 | I/II | Unknown | Unknown | PD | |||
| SNX6 | SNV | Missense_Mutation | novel | c.1045G>A | p.Val349Ile | p.V349I | protein_coding | tolerated(0.27) | probably_damaging(0.997) | TCGA-A5-A0G1-01 | Endometrium | uterine corpus endometrioid carcinoma | Female | >=65 | I/II | Unknown | Unknown | SD | |
| SNX6 | SNV | Missense_Mutation | novel | c.82G>A | p.Asp28Asn | p.D28N | protein_coding | tolerated(0.29) | benign(0.171) | TCGA-A5-A0G1-01 | Endometrium | uterine corpus endometrioid carcinoma | Female | >=65 | I/II | Unknown | Unknown | SD |
| Page: 1 2 3 4 |
Top |
Related drugs of malignant transformation related genes |
| Identification of chemicals and drugs interact with genes involved in malignant transfromation |
| (DGIdb 4.0) |
| Entrez ID | Symbol | Category | Interaction Types | Drug Claim Name | Drug Name | PMIDs |
| Page: 1 |

Copyright 2023-Present -The University of Texas Health Science Center at Houston |