
|
|||||
|
 | |
| |
| |
| |
| |
| |
|
Gene: SNX5 |
Gene summary for SNX5 |
| Gene information | Species | Human | Gene symbol | SNX5 | Gene ID | 27131 |
| Gene name | sorting nexin 5 | |
| Gene Alias | SNX5 | |
| Cytomap | 20p11.23 | |
| Gene Type | protein-coding | GO ID | GO:0003008 | UniProtAcc | Q6P5V6 |
Top |
Malignant transformation analysis |
| Identification of the aberrant gene expression in precancerous and cancerous lesions by comparing the gene expression of stem-like cells in diseased tissues with normal stem cells |
| Entrez ID | Symbol | Replicates | Species | Organ | Tissue | Adj P-value | Log2FC | Malignancy |
| 27131 | SNX5 | HTA11_78_2000001011 | Human | Colorectum | AD | 2.45e-03 | 3.88e-01 | -0.1088 |
| 27131 | SNX5 | HTA11_347_2000001011 | Human | Colorectum | AD | 3.13e-14 | 6.13e-01 | -0.1954 |
| 27131 | SNX5 | HTA11_1391_2000001011 | Human | Colorectum | AD | 6.70e-03 | 4.42e-01 | -0.059 |
| 27131 | SNX5 | HTA11_99999970781_79442 | Human | Colorectum | MSS | 2.43e-02 | 4.70e-01 | 0.294 |
| 27131 | SNX5 | HTA11_99999965104_69814 | Human | Colorectum | MSS | 8.43e-07 | 6.37e-01 | 0.281 |
| 27131 | SNX5 | A015-C-203 | Human | Colorectum | FAP | 1.28e-14 | -2.25e-01 | -0.1294 |
| 27131 | SNX5 | A015-C-204 | Human | Colorectum | FAP | 4.73e-02 | -1.80e-01 | -0.0228 |
| 27131 | SNX5 | A002-C-201 | Human | Colorectum | FAP | 1.13e-03 | -1.57e-01 | 0.0324 |
| 27131 | SNX5 | A002-C-203 | Human | Colorectum | FAP | 1.18e-06 | -1.86e-01 | 0.2786 |
| 27131 | SNX5 | A001-C-119 | Human | Colorectum | FAP | 4.06e-04 | -3.14e-01 | -0.1557 |
| 27131 | SNX5 | A001-C-108 | Human | Colorectum | FAP | 2.55e-09 | -1.47e-01 | -0.0272 |
| 27131 | SNX5 | A002-C-205 | Human | Colorectum | FAP | 8.16e-09 | -2.39e-01 | -0.1236 |
| 27131 | SNX5 | A001-C-104 | Human | Colorectum | FAP | 2.54e-02 | -1.03e-01 | 0.0184 |
| 27131 | SNX5 | A015-C-006 | Human | Colorectum | FAP | 1.21e-05 | -2.46e-01 | -0.0994 |
| 27131 | SNX5 | A015-C-106 | Human | Colorectum | FAP | 1.34e-06 | -1.86e-01 | -0.0511 |
| 27131 | SNX5 | A002-C-114 | Human | Colorectum | FAP | 2.21e-06 | -1.71e-01 | -0.1561 |
| 27131 | SNX5 | A015-C-104 | Human | Colorectum | FAP | 4.49e-16 | -2.55e-01 | -0.1899 |
| 27131 | SNX5 | A001-C-014 | Human | Colorectum | FAP | 1.28e-05 | -1.24e-01 | 0.0135 |
| 27131 | SNX5 | A002-C-016 | Human | Colorectum | FAP | 6.33e-11 | -2.12e-01 | 0.0521 |
| 27131 | SNX5 | A015-C-002 | Human | Colorectum | FAP | 8.78e-03 | -8.66e-02 | -0.0763 |
| Page: 1 2 3 4 5 6 7 8 |
| Tissue | Expression Dynamics | Abbreviation |
| Colorectum (GSE201348) | 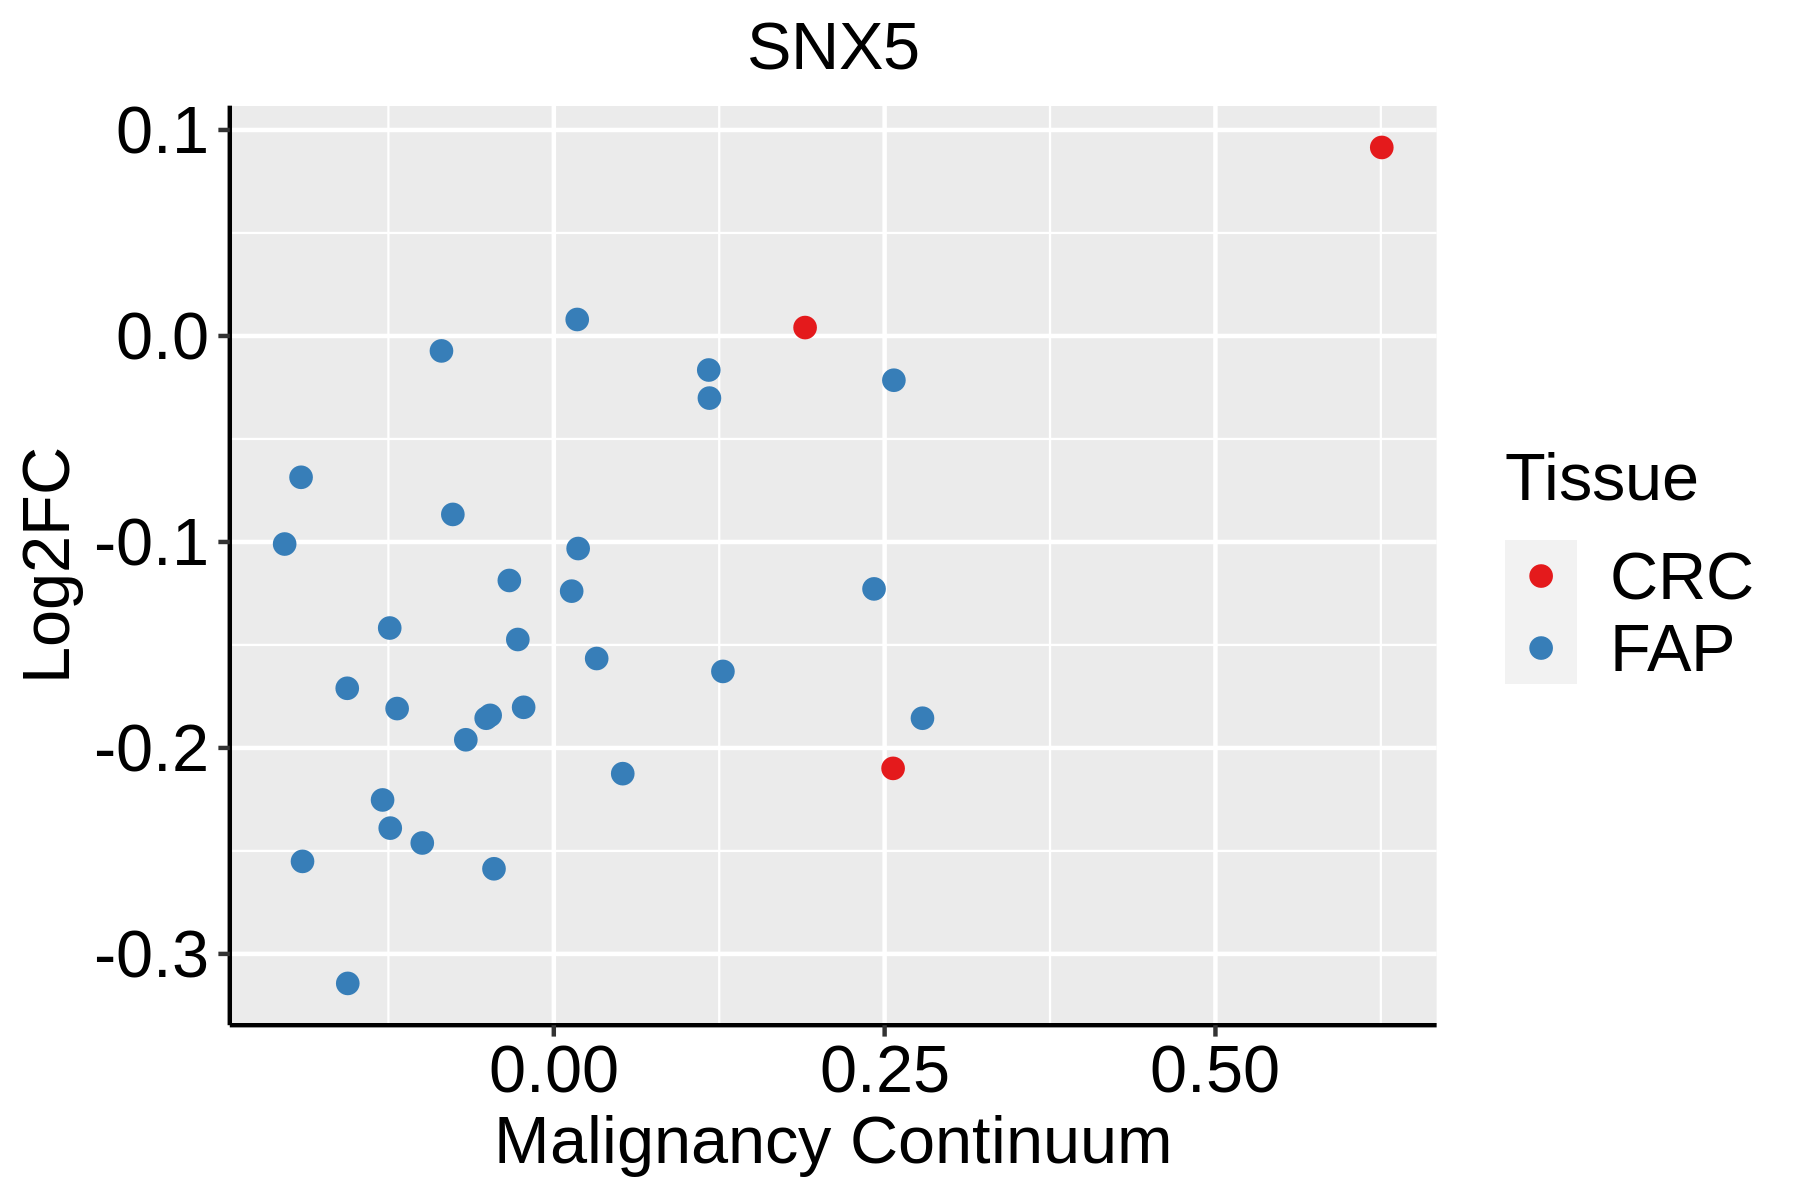 | FAP: Familial adenomatous polyposis |
| CRC: Colorectal cancer | ||
| Colorectum (HTA11) |  | AD: Adenomas |
| SER: Sessile serrated lesions | ||
| MSI-H: Microsatellite-high colorectal cancer | ||
| MSS: Microsatellite stable colorectal cancer | ||
| Esophagus |  | ESCC: Esophageal squamous cell carcinoma |
| HGIN: High-grade intraepithelial neoplasias | ||
| LGIN: Low-grade intraepithelial neoplasias | ||
| Liver | 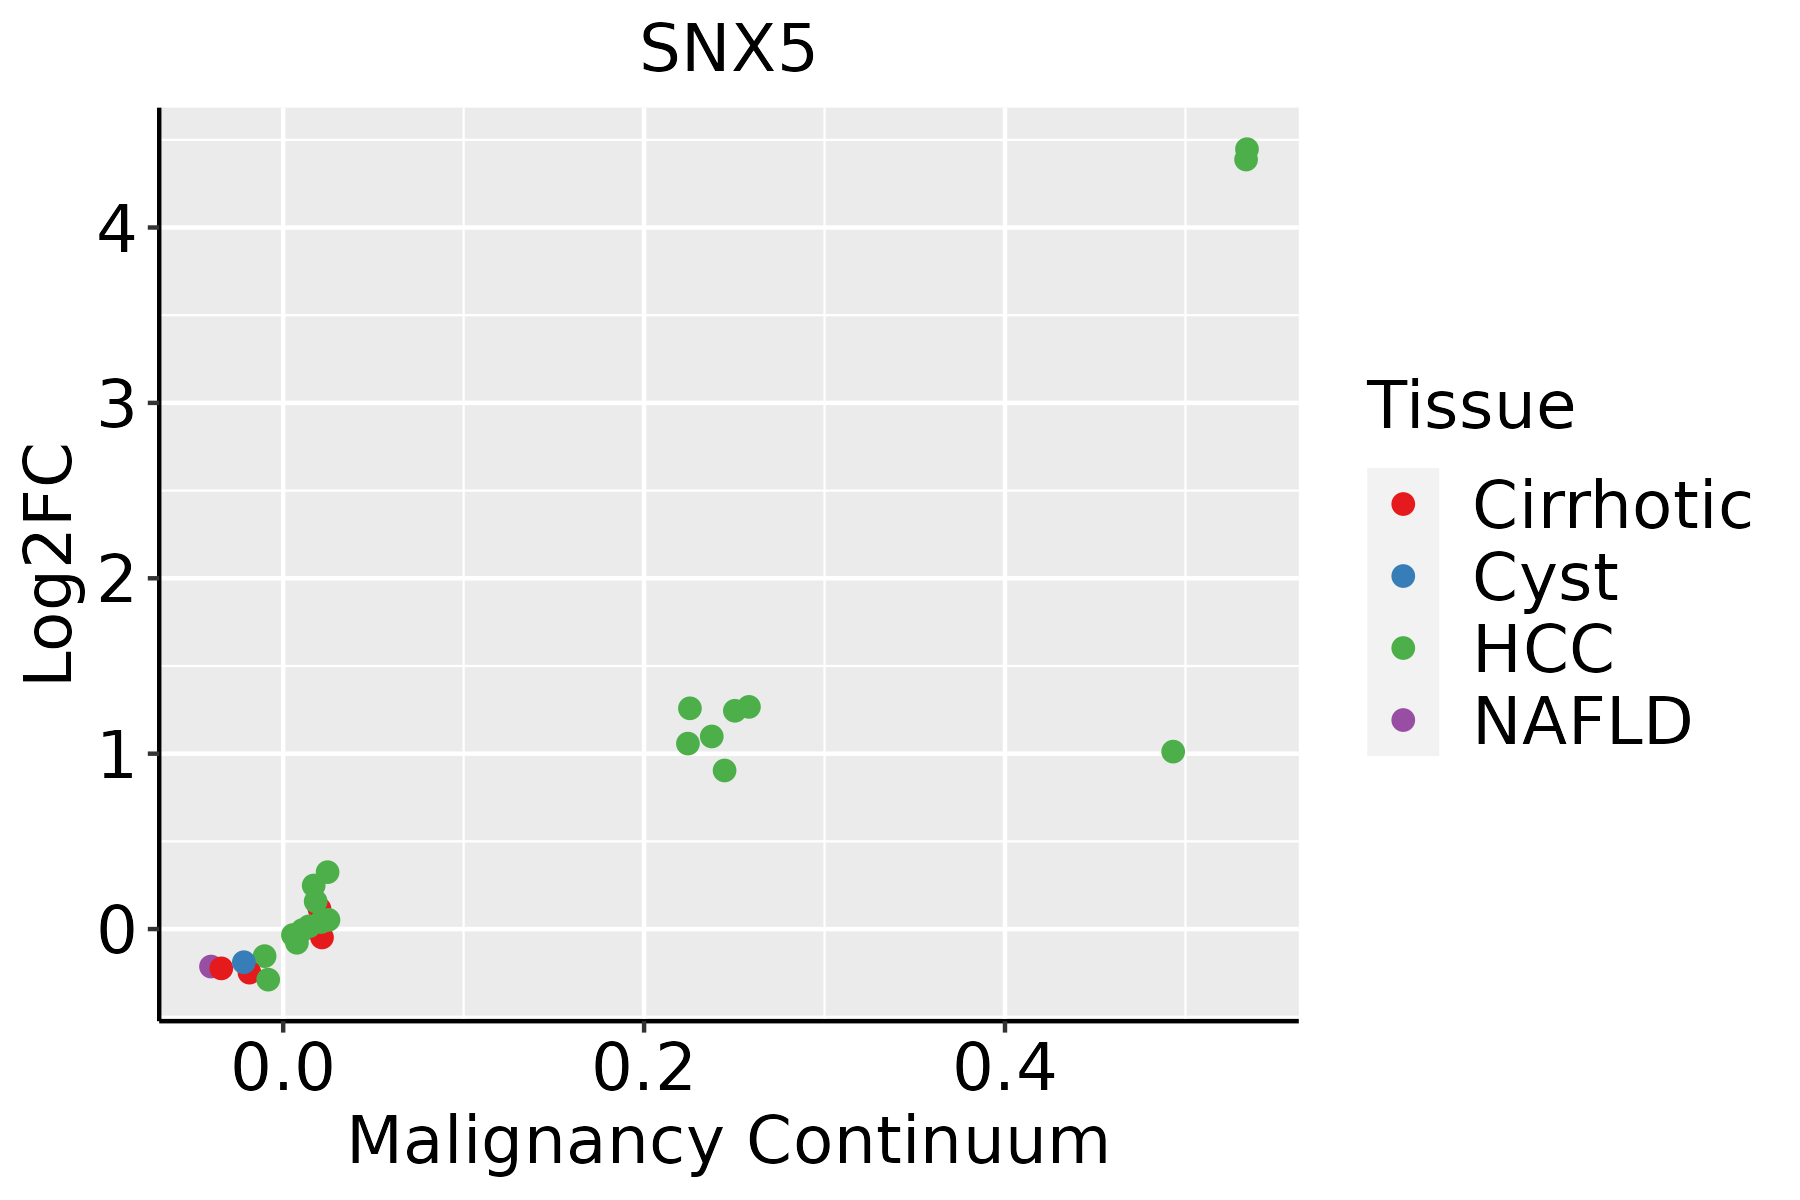 | HCC: Hepatocellular carcinoma |
| NAFLD: Non-alcoholic fatty liver disease | ||
| Oral Cavity | 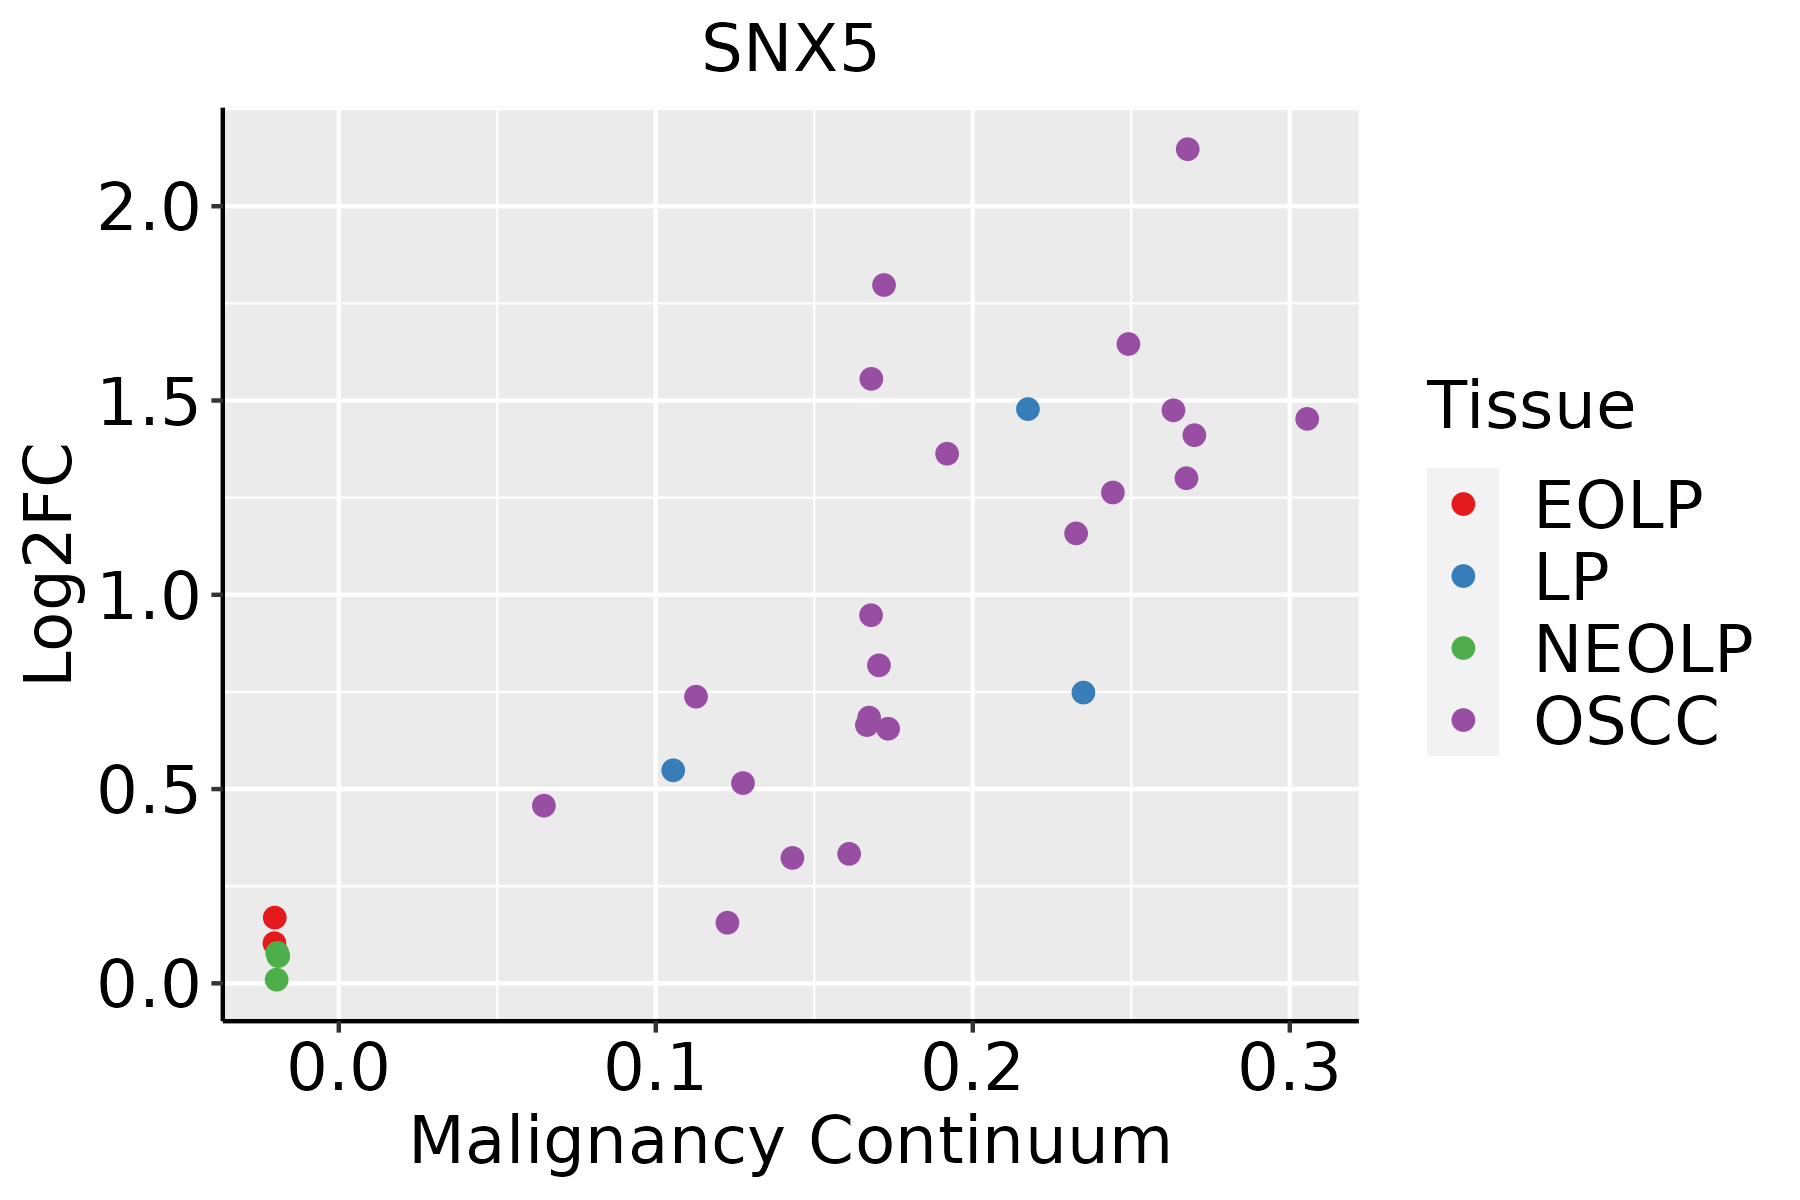 | EOLP: Erosive Oral lichen planus |
| LP: leukoplakia | ||
| NEOLP: Non-erosive oral lichen planus | ||
| OSCC: Oral squamous cell carcinoma | ||
| Skin |  | AK: Actinic keratosis |
| cSCC: Cutaneous squamous cell carcinoma | ||
| SCCIS:squamous cell carcinoma in situ | ||
| Thyroid | 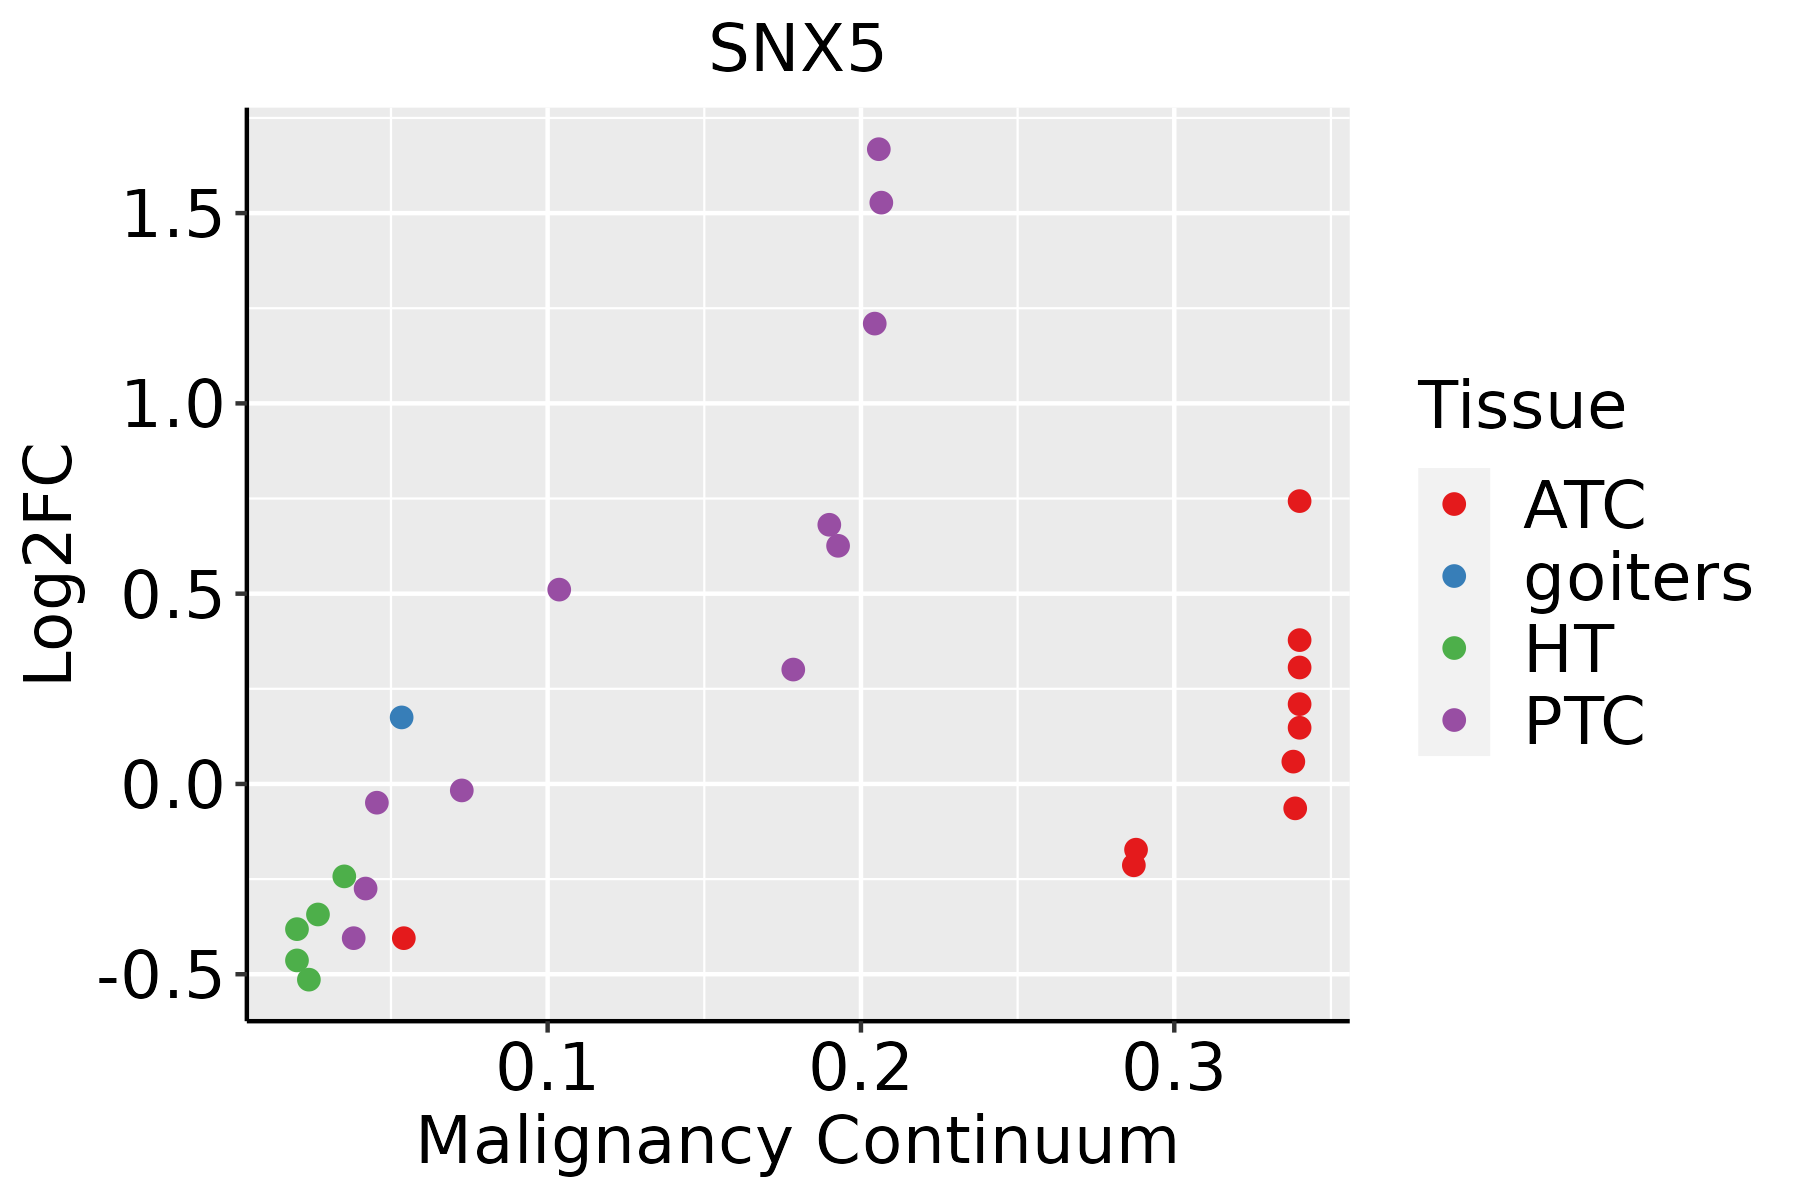 | ATC: Anaplastic thyroid cancer |
| HT: Hashimoto's thyroiditis | ||
| PTC: Papillary thyroid cancer |
| ∗log2FC in expression of this searched gene in stem-like cells from each diseased tissue sample relative to stem-like cells in normal samples in each tissue plotted against the malignancy continuum. Samples are colored based on if they are from different disease stage. |
Top |
Malignant transformation related pathway analysis |
| Find out the enriched GO biological processes and KEGG pathways involved in transition from healthy to precancer to cancer |
| Tissue | Disease Stage | Enriched GO biological Processes |
| Colorectum | AD |  |
| Colorectum | SER |  |
| Colorectum | MSS |  |
| Colorectum | MSI-H |  |
| Colorectum | FAP |  |
| ∗Top 15 enriched GO BP terms are showed in the bar plot of each disease state in each tissue. Each row represents a significant GO biological process which is colored according to the -log10(p.adjust). |
| Page: 1 2 3 4 5 6 7 8 9 |
| GO ID | Tissue | Disease Stage | Description | Gene Ratio | Bg Ratio | pvalue | p.adjust | Count |
| GO:0016197 | Colorectum | AD | endosomal transport | 90/3918 | 230/18723 | 1.88e-10 | 1.73e-08 | 90 |
| GO:0038127 | Colorectum | AD | ERBB signaling pathway | 55/3918 | 121/18723 | 1.19e-09 | 8.85e-08 | 55 |
| GO:0007173 | Colorectum | AD | epidermal growth factor receptor signaling pathway | 50/3918 | 108/18723 | 3.08e-09 | 2.07e-07 | 50 |
| GO:0010506 | Colorectum | AD | regulation of autophagy | 111/3918 | 317/18723 | 3.57e-09 | 2.35e-07 | 111 |
| GO:0016482 | Colorectum | AD | cytosolic transport | 68/3918 | 168/18723 | 6.00e-09 | 3.72e-07 | 68 |
| GO:0016236 | Colorectum | AD | macroautophagy | 103/3918 | 291/18723 | 6.76e-09 | 4.15e-07 | 103 |
| GO:0032868 | Colorectum | AD | response to insulin | 91/3918 | 264/18723 | 2.02e-07 | 8.48e-06 | 91 |
| GO:1901653 | Colorectum | AD | cellular response to peptide | 114/3918 | 359/18723 | 8.32e-07 | 2.88e-05 | 114 |
| GO:0032869 | Colorectum | AD | cellular response to insulin stimulus | 72/3918 | 203/18723 | 1.10e-06 | 3.68e-05 | 72 |
| GO:0071375 | Colorectum | AD | cellular response to peptide hormone stimulus | 95/3918 | 290/18723 | 1.50e-06 | 4.66e-05 | 95 |
| GO:1901185 | Colorectum | AD | negative regulation of ERBB signaling pathway | 19/3918 | 32/18723 | 2.39e-06 | 6.98e-05 | 19 |
| GO:0043434 | Colorectum | AD | response to peptide hormone | 126/3918 | 414/18723 | 2.70e-06 | 7.86e-05 | 126 |
| GO:1901184 | Colorectum | AD | regulation of ERBB signaling pathway | 34/3918 | 79/18723 | 7.46e-06 | 1.82e-04 | 34 |
| GO:0042147 | Colorectum | AD | retrograde transport, endosome to Golgi | 37/3918 | 91/18723 | 1.46e-05 | 3.14e-04 | 37 |
| GO:0042058 | Colorectum | AD | regulation of epidermal growth factor receptor signaling pathway | 31/3918 | 73/18723 | 2.56e-05 | 4.89e-04 | 31 |
| GO:0042059 | Colorectum | AD | negative regulation of epidermal growth factor receptor signaling pathway | 16/3918 | 28/18723 | 2.96e-05 | 5.46e-04 | 16 |
| GO:0016241 | Colorectum | AD | regulation of macroautophagy | 50/3918 | 141/18723 | 4.55e-05 | 7.92e-04 | 50 |
| GO:0051047 | Colorectum | AD | positive regulation of secretion | 90/3918 | 310/18723 | 4.11e-04 | 4.66e-03 | 90 |
| GO:0003014 | Colorectum | AD | renal system process | 35/3918 | 110/18723 | 4.85e-03 | 3.27e-02 | 35 |
| GO:0055067 | Colorectum | AD | monovalent inorganic cation homeostasis | 45/3918 | 151/18723 | 6.19e-03 | 3.88e-02 | 45 |
| Page: 1 2 3 4 5 6 7 8 9 10 11 12 13 |
| Pathway ID | Tissue | Disease Stage | Description | Gene Ratio | Bg Ratio | pvalue | p.adjust | qvalue | Count |
| hsa04144 | Colorectum | AD | Endocytosis | 111/2092 | 251/8465 | 5.95e-12 | 1.42e-10 | 9.08e-11 | 111 |
| hsa041441 | Colorectum | AD | Endocytosis | 111/2092 | 251/8465 | 5.95e-12 | 1.42e-10 | 9.08e-11 | 111 |
| hsa041444 | Colorectum | MSS | Endocytosis | 102/1875 | 251/8465 | 1.85e-11 | 4.43e-10 | 2.71e-10 | 102 |
| hsa041445 | Colorectum | MSS | Endocytosis | 102/1875 | 251/8465 | 1.85e-11 | 4.43e-10 | 2.71e-10 | 102 |
| hsa041446 | Colorectum | FAP | Endocytosis | 78/1404 | 251/8465 | 6.20e-09 | 2.96e-07 | 1.80e-07 | 78 |
| hsa041447 | Colorectum | FAP | Endocytosis | 78/1404 | 251/8465 | 6.20e-09 | 2.96e-07 | 1.80e-07 | 78 |
| hsa041448 | Colorectum | CRC | Endocytosis | 65/1091 | 251/8465 | 1.27e-08 | 1.06e-06 | 7.19e-07 | 65 |
| hsa041449 | Colorectum | CRC | Endocytosis | 65/1091 | 251/8465 | 1.27e-08 | 1.06e-06 | 7.19e-07 | 65 |
| hsa0414429 | Esophagus | HGIN | Endocytosis | 76/1383 | 251/8465 | 1.74e-08 | 3.34e-07 | 2.65e-07 | 76 |
| hsa04144113 | Esophagus | HGIN | Endocytosis | 76/1383 | 251/8465 | 1.74e-08 | 3.34e-07 | 2.65e-07 | 76 |
| hsa04144210 | Esophagus | ESCC | Endocytosis | 186/4205 | 251/8465 | 9.74e-16 | 4.66e-14 | 2.39e-14 | 186 |
| hsa0414437 | Esophagus | ESCC | Endocytosis | 186/4205 | 251/8465 | 9.74e-16 | 4.66e-14 | 2.39e-14 | 186 |
| hsa0414412 | Liver | Cirrhotic | Endocytosis | 119/2530 | 251/8465 | 2.33e-09 | 4.56e-08 | 2.81e-08 | 119 |
| hsa0414413 | Liver | Cirrhotic | Endocytosis | 119/2530 | 251/8465 | 2.33e-09 | 4.56e-08 | 2.81e-08 | 119 |
| hsa0414422 | Liver | HCC | Endocytosis | 178/4020 | 251/8465 | 2.03e-14 | 5.22e-13 | 2.91e-13 | 178 |
| hsa0414432 | Liver | HCC | Endocytosis | 178/4020 | 251/8465 | 2.03e-14 | 5.22e-13 | 2.91e-13 | 178 |
| hsa0414427 | Oral cavity | OSCC | Endocytosis | 174/3704 | 251/8465 | 9.42e-17 | 4.51e-15 | 2.29e-15 | 174 |
| hsa04144112 | Oral cavity | OSCC | Endocytosis | 174/3704 | 251/8465 | 9.42e-17 | 4.51e-15 | 2.29e-15 | 174 |
| hsa0414428 | Oral cavity | LP | Endocytosis | 121/2418 | 251/8465 | 1.89e-11 | 3.70e-10 | 2.38e-10 | 121 |
| hsa0414436 | Oral cavity | LP | Endocytosis | 121/2418 | 251/8465 | 1.89e-11 | 3.70e-10 | 2.38e-10 | 121 |
| Page: 1 |
Top |
Cell-cell communication analysis |
| Identification of potential cell-cell interactions between two cell types and their ligand-receptor pairs for different disease states |
| Ligand | Receptor | LRpair | Pathway | Tissue | Disease Stage |
| Page: 1 |
Top |
Single-cell gene regulatory network inference analysis |
| Find out the significant the regulons (TFs) and the target genes of each regulon across cell types for different disease states |
| TF | Cell Type | Tissue | Disease Stage | Target Gene | RSS | Regulon Activity |
| ∗The dot plots of a searched regulon are shown for all cell subpopulations in each disease state of each tissue based on the regulon specific score inferred using pySCENIC and by calculating the average expression. |
| Page: 1 |
Top |
Somatic mutation of malignant transformation related genes |
| Annotation of somatic variants for genes involved in malignant transformation |
| Hugo Symbol | Variant Class | Variant Classification | dbSNP RS | HGVSc | HGVSp | HGVSp Short | SWISSPROT | BIOTYPE | SIFT | PolyPhen | Tumor Sample Barcode | Tissue | Histology | Sex | Age | Stage | Therapy Types | Drugs | Outcome |
| SNX5 | SNV | Missense_Mutation | c.677N>T | p.Ser226Phe | p.S226F | Q9Y5X3 | protein_coding | deleterious(0) | benign(0.039) | TCGA-2W-A8YY-01 | Cervix | cervical & endocervical cancer | Female | <65 | I/II | Chemotherapy | cisplatin | CR | |
| SNX5 | SNV | Missense_Mutation | rs771429766 | c.365N>T | p.Ala122Val | p.A122V | Q9Y5X3 | protein_coding | tolerated(0.14) | benign(0) | TCGA-2W-A8YY-01 | Cervix | cervical & endocervical cancer | Female | <65 | I/II | Chemotherapy | cisplatin | CR |
| SNX5 | SNV | Missense_Mutation | c.727N>A | p.Asp243Asn | p.D243N | Q9Y5X3 | protein_coding | tolerated(0.29) | benign(0.007) | TCGA-IR-A3LH-01 | Cervix | cervical & endocervical cancer | Female | <65 | I/II | Chemotherapy | cisplatin | CR | |
| SNX5 | SNV | Missense_Mutation | novel | c.400N>A | p.Ala134Thr | p.A134T | Q9Y5X3 | protein_coding | deleterious(0.01) | probably_damaging(0.988) | TCGA-CA-6717-01 | Colorectum | colon adenocarcinoma | Male | <65 | I/II | Chemotherapy | oxaliplatin | CR |
| SNX5 | SNV | Missense_Mutation | c.95N>G | p.Gln32Arg | p.Q32R | Q9Y5X3 | protein_coding | tolerated(0.38) | possibly_damaging(0.706) | TCGA-G4-6302-01 | Colorectum | colon adenocarcinoma | Female | >=65 | I/II | Unknown | Unknown | SD | |
| SNX5 | SNV | Missense_Mutation | rs139196479 | c.1063G>A | p.Glu355Lys | p.E355K | Q9Y5X3 | protein_coding | tolerated(0.2) | benign(0.053) | TCGA-F5-6814-01 | Colorectum | rectum adenocarcinoma | Male | <65 | I/II | Unknown | Unknown | SD |
| SNX5 | SNV | Missense_Mutation | rs376369085 | c.1097N>A | p.Arg366Gln | p.R366Q | Q9Y5X3 | protein_coding | tolerated(0.63) | benign(0.009) | TCGA-A5-A0G2-01 | Endometrium | uterine corpus endometrioid carcinoma | Female | <65 | III/IV | Unknown | Unknown | SD |
| SNX5 | SNV | Missense_Mutation | rs761676504 | c.292G>A | p.Asp98Asn | p.D98N | Q9Y5X3 | protein_coding | tolerated(0.1) | probably_damaging(0.949) | TCGA-AP-A059-01 | Endometrium | uterine corpus endometrioid carcinoma | Female | >=65 | I/II | Unknown | Unknown | SD |
| SNX5 | SNV | Missense_Mutation | novel | c.883N>A | p.Leu295Ile | p.L295I | Q9Y5X3 | protein_coding | deleterious(0) | probably_damaging(0.98) | TCGA-AP-A1DK-01 | Endometrium | uterine corpus endometrioid carcinoma | Female | <65 | I/II | Unknown | Unknown | SD |
| SNX5 | SNV | Missense_Mutation | c.677N>A | p.Ser226Tyr | p.S226Y | Q9Y5X3 | protein_coding | deleterious(0) | benign(0.436) | TCGA-AX-A0J0-01 | Endometrium | uterine corpus endometrioid carcinoma | Female | <65 | I/II | Unknown | Unknown | SD |
| Page: 1 2 3 |
Top |
Related drugs of malignant transformation related genes |
| Identification of chemicals and drugs interact with genes involved in malignant transfromation |
| (DGIdb 4.0) |
| Entrez ID | Symbol | Category | Interaction Types | Drug Claim Name | Drug Name | PMIDs |
| Page: 1 |

Copyright 2023-Present -The University of Texas Health Science Center at Houston |