
|
|||||
|
 | |
| |
| |
| |
| |
| |
|
Gene: SNX4 |
Gene summary for SNX4 |
| Gene information | Species | Human | Gene symbol | SNX4 | Gene ID | 8723 |
| Gene name | sorting nexin 4 | |
| Gene Alias | ATG24B | |
| Cytomap | 3q21.2 | |
| Gene Type | protein-coding | GO ID | GO:0001775 | UniProtAcc | O95219 |
Top |
Malignant transformation analysis |
| Identification of the aberrant gene expression in precancerous and cancerous lesions by comparing the gene expression of stem-like cells in diseased tissues with normal stem cells |
| Entrez ID | Symbol | Replicates | Species | Organ | Tissue | Adj P-value | Log2FC | Malignancy |
| 8723 | SNX4 | LZE2T | Human | Esophagus | ESCC | 2.05e-07 | 5.74e-01 | 0.082 |
| 8723 | SNX4 | LZE4T | Human | Esophagus | ESCC | 5.06e-16 | 3.46e-01 | 0.0811 |
| 8723 | SNX4 | LZE7T | Human | Esophagus | ESCC | 2.31e-07 | 4.86e-01 | 0.0667 |
| 8723 | SNX4 | LZE8T | Human | Esophagus | ESCC | 1.12e-03 | 1.33e-01 | 0.067 |
| 8723 | SNX4 | LZE20T | Human | Esophagus | ESCC | 7.26e-05 | 1.08e-01 | 0.0662 |
| 8723 | SNX4 | LZE22T | Human | Esophagus | ESCC | 2.04e-04 | 4.12e-01 | 0.068 |
| 8723 | SNX4 | LZE24T | Human | Esophagus | ESCC | 1.51e-17 | 4.83e-01 | 0.0596 |
| 8723 | SNX4 | LZE6T | Human | Esophagus | ESCC | 5.06e-07 | 2.76e-01 | 0.0845 |
| 8723 | SNX4 | P1T-E | Human | Esophagus | ESCC | 4.12e-07 | 3.04e-01 | 0.0875 |
| 8723 | SNX4 | P2T-E | Human | Esophagus | ESCC | 7.43e-24 | 3.61e-01 | 0.1177 |
| 8723 | SNX4 | P4T-E | Human | Esophagus | ESCC | 1.62e-12 | 2.50e-01 | 0.1323 |
| 8723 | SNX4 | P5T-E | Human | Esophagus | ESCC | 1.11e-16 | 2.27e-01 | 0.1327 |
| 8723 | SNX4 | P8T-E | Human | Esophagus | ESCC | 6.42e-39 | 6.85e-01 | 0.0889 |
| 8723 | SNX4 | P9T-E | Human | Esophagus | ESCC | 3.25e-13 | 2.60e-01 | 0.1131 |
| 8723 | SNX4 | P10T-E | Human | Esophagus | ESCC | 4.72e-41 | 6.99e-01 | 0.116 |
| 8723 | SNX4 | P11T-E | Human | Esophagus | ESCC | 3.44e-13 | 5.18e-01 | 0.1426 |
| 8723 | SNX4 | P12T-E | Human | Esophagus | ESCC | 1.25e-32 | 5.84e-01 | 0.1122 |
| 8723 | SNX4 | P15T-E | Human | Esophagus | ESCC | 4.40e-31 | 6.70e-01 | 0.1149 |
| 8723 | SNX4 | P16T-E | Human | Esophagus | ESCC | 1.32e-37 | 6.38e-01 | 0.1153 |
| 8723 | SNX4 | P17T-E | Human | Esophagus | ESCC | 1.27e-06 | 3.51e-01 | 0.1278 |
| Page: 1 2 3 4 5 6 |
| Tissue | Expression Dynamics | Abbreviation |
| Esophagus |  | ESCC: Esophageal squamous cell carcinoma |
| HGIN: High-grade intraepithelial neoplasias | ||
| LGIN: Low-grade intraepithelial neoplasias | ||
| Liver |  | HCC: Hepatocellular carcinoma |
| NAFLD: Non-alcoholic fatty liver disease | ||
| Oral Cavity | 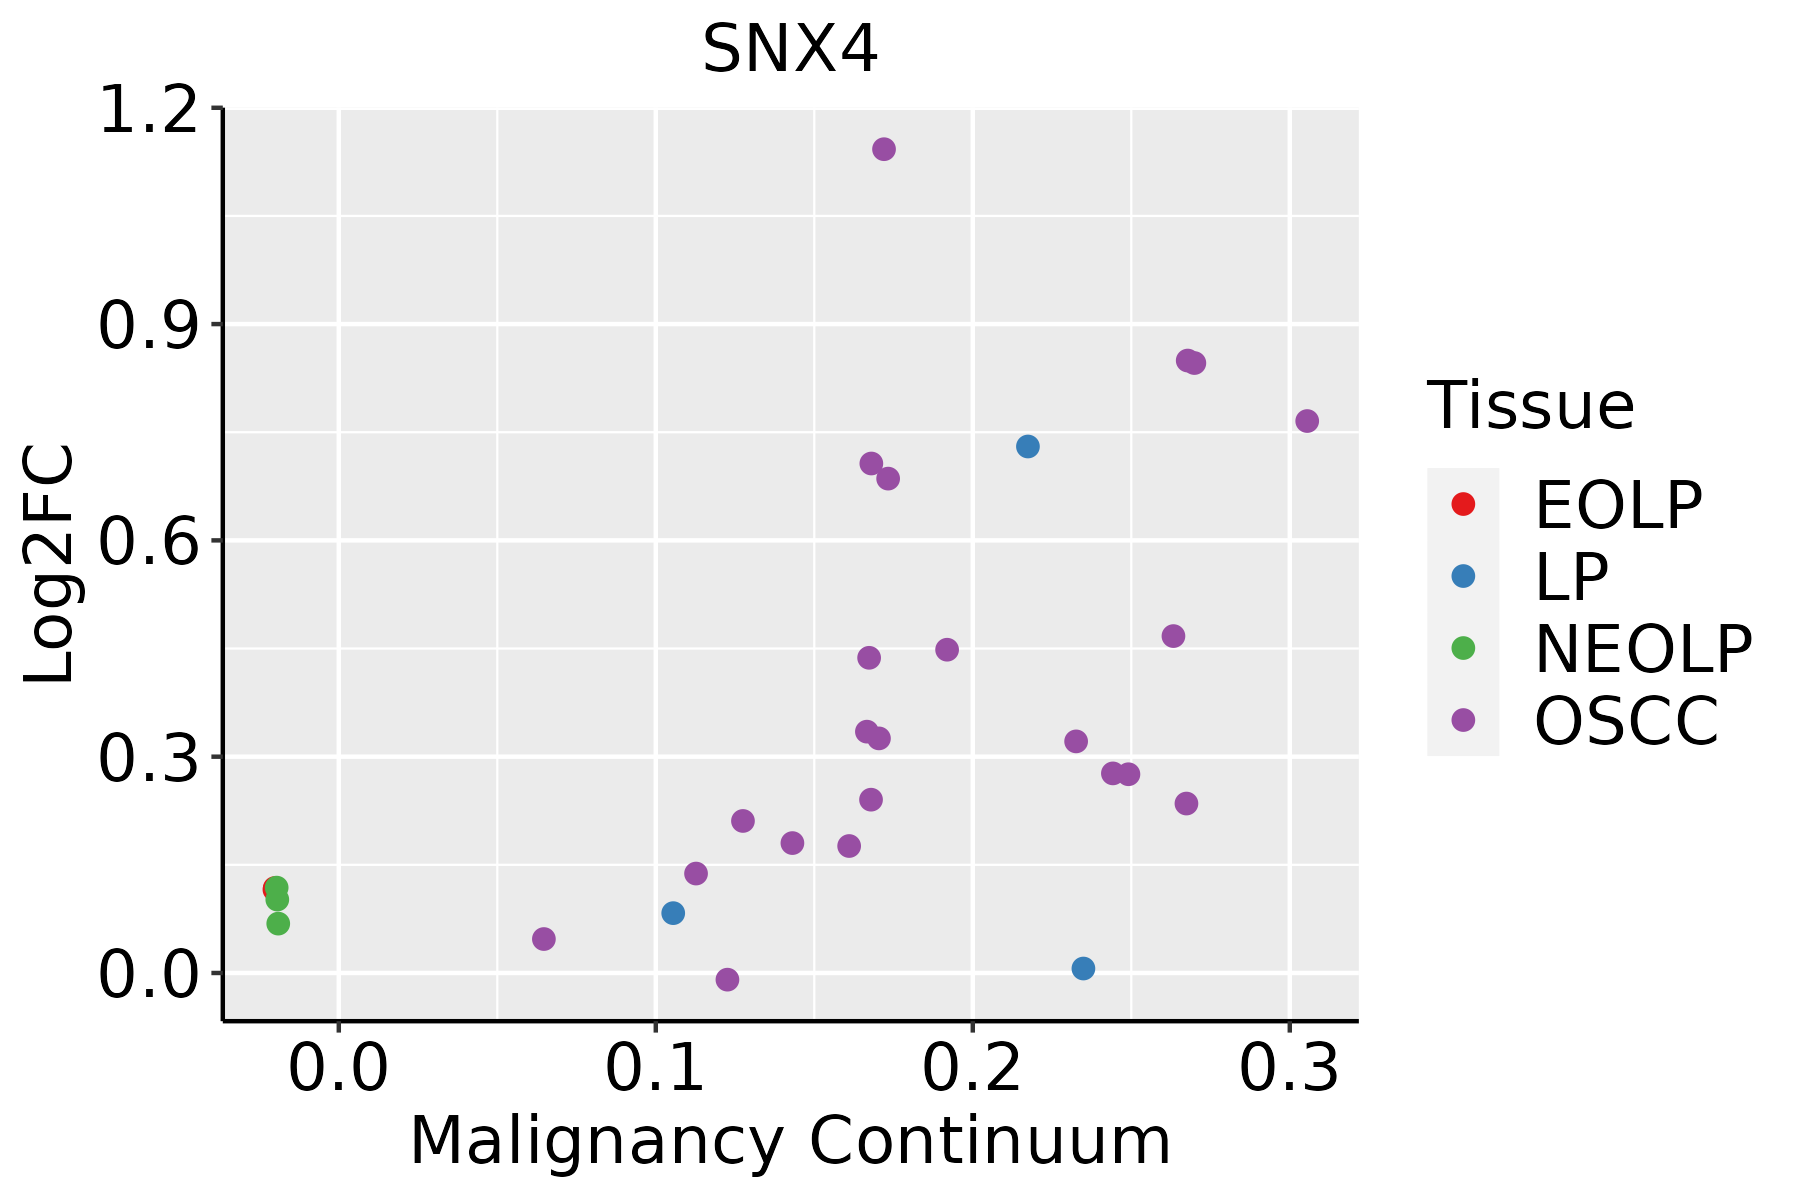 | EOLP: Erosive Oral lichen planus |
| LP: leukoplakia | ||
| NEOLP: Non-erosive oral lichen planus | ||
| OSCC: Oral squamous cell carcinoma | ||
| Skin | 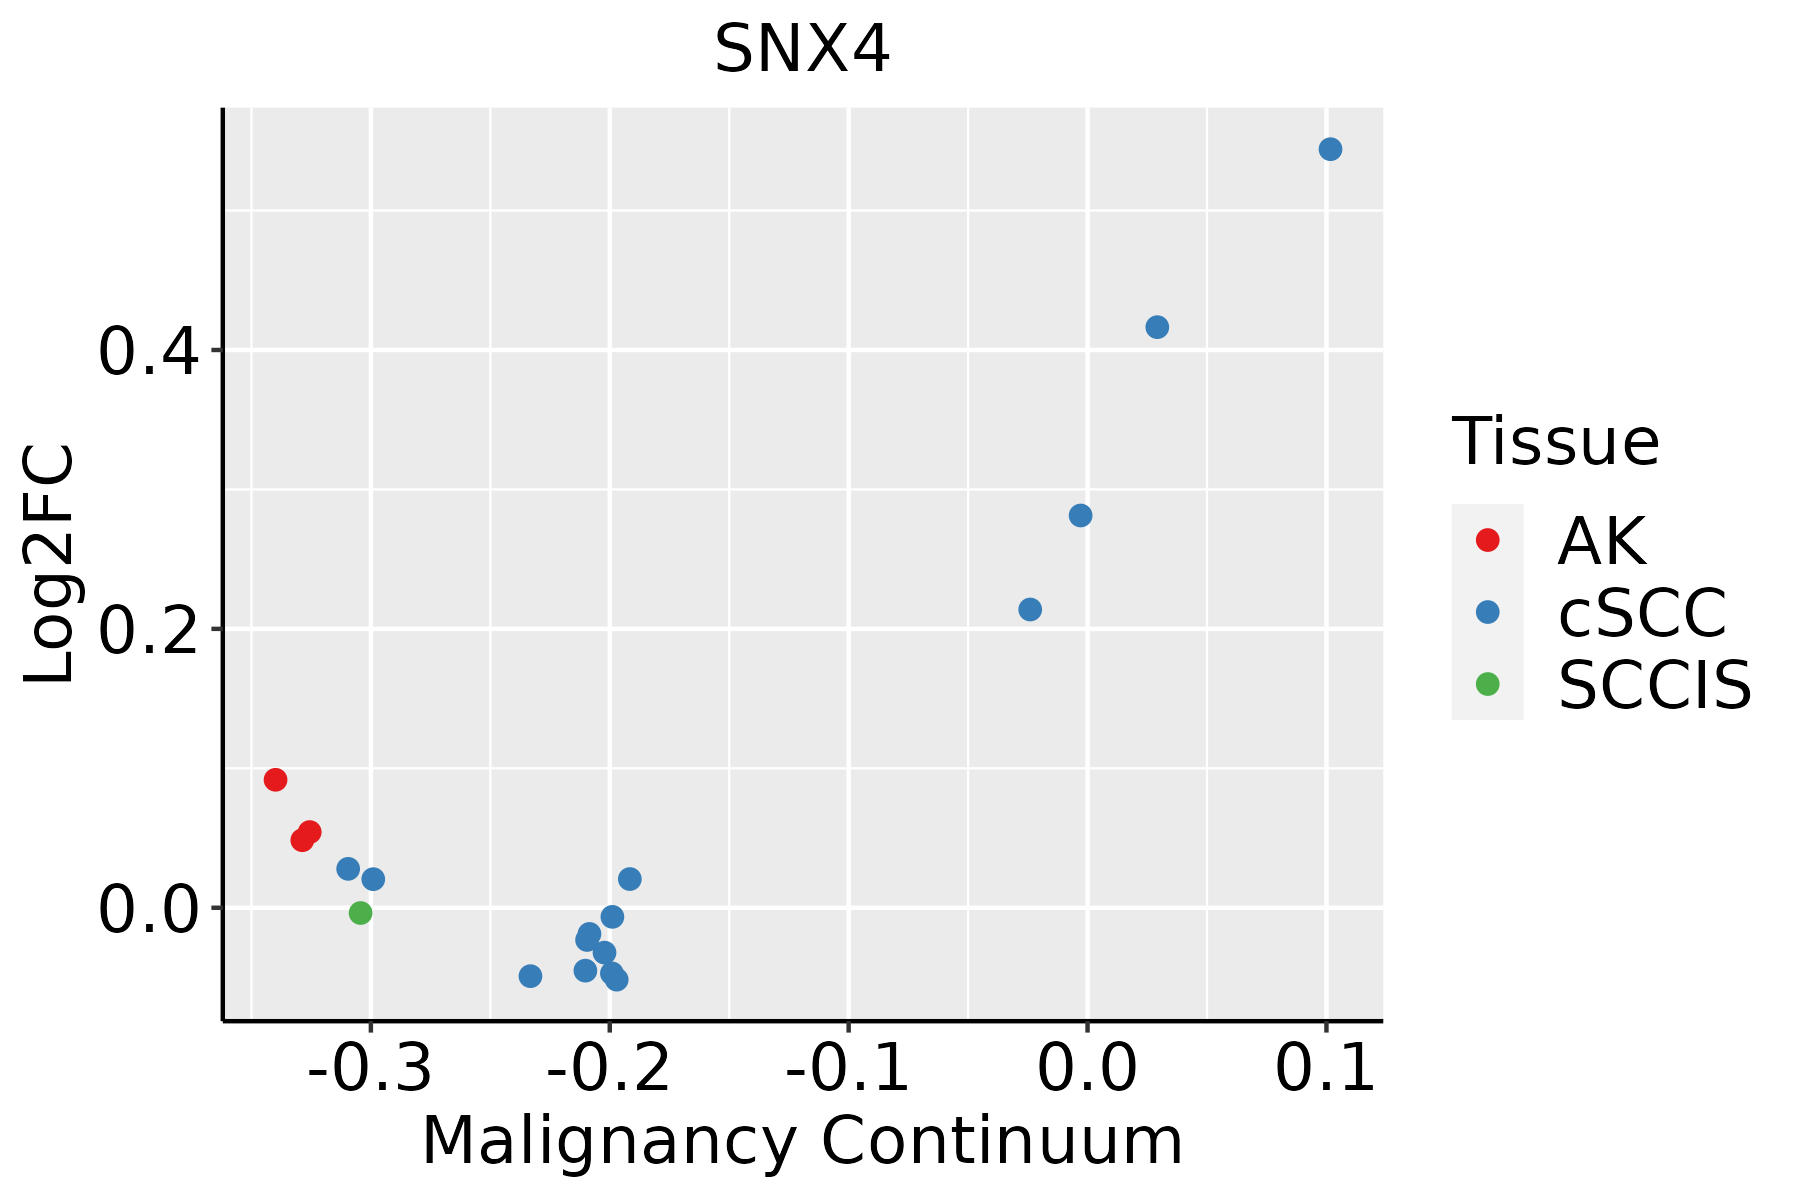 | AK: Actinic keratosis |
| cSCC: Cutaneous squamous cell carcinoma | ||
| SCCIS:squamous cell carcinoma in situ | ||
| Thyroid |  | ATC: Anaplastic thyroid cancer |
| HT: Hashimoto's thyroiditis | ||
| PTC: Papillary thyroid cancer |
| ∗log2FC in expression of this searched gene in stem-like cells from each diseased tissue sample relative to stem-like cells in normal samples in each tissue plotted against the malignancy continuum. Samples are colored based on if they are from different disease stage. |
Top |
Malignant transformation related pathway analysis |
| Find out the enriched GO biological processes and KEGG pathways involved in transition from healthy to precancer to cancer |
| Tissue | Disease Stage | Enriched GO biological Processes |
| Colorectum | AD |  |
| Colorectum | SER |  |
| Colorectum | MSS |  |
| Colorectum | MSI-H |  |
| Colorectum | FAP |  |
| ∗Top 15 enriched GO BP terms are showed in the bar plot of each disease state in each tissue. Each row represents a significant GO biological process which is colored according to the -log10(p.adjust). |
| Page: 1 2 3 4 5 6 7 8 9 |
| GO ID | Tissue | Disease Stage | Description | Gene Ratio | Bg Ratio | pvalue | p.adjust | Count |
| GO:005165617 | Esophagus | ESCC | establishment of organelle localization | 273/8552 | 390/18723 | 9.13e-23 | 1.81e-20 | 273 |
| GO:001619715 | Esophagus | ESCC | endosomal transport | 168/8552 | 230/18723 | 2.28e-17 | 1.93e-15 | 168 |
| GO:009887615 | Esophagus | ESCC | vesicle-mediated transport to the plasma membrane | 99/8552 | 136/18723 | 1.13e-10 | 3.39e-09 | 99 |
| GO:00324565 | Esophagus | ESCC | endocytic recycling | 51/8552 | 73/18723 | 2.47e-05 | 2.10e-04 | 51 |
| GO:001619711 | Liver | Cirrhotic | endosomal transport | 93/4634 | 230/18723 | 1.01e-07 | 2.93e-06 | 93 |
| GO:009887611 | Liver | Cirrhotic | vesicle-mediated transport to the plasma membrane | 59/4634 | 136/18723 | 1.46e-06 | 2.88e-05 | 59 |
| GO:005165611 | Liver | Cirrhotic | establishment of organelle localization | 128/4634 | 390/18723 | 1.78e-04 | 1.67e-03 | 128 |
| GO:00321032 | Liver | Cirrhotic | positive regulation of response to external stimulus | 131/4634 | 427/18723 | 2.90e-03 | 1.66e-02 | 131 |
| GO:001619721 | Liver | HCC | endosomal transport | 154/7958 | 230/18723 | 4.74e-14 | 2.95e-12 | 154 |
| GO:005165621 | Liver | HCC | establishment of organelle localization | 226/7958 | 390/18723 | 4.15e-10 | 1.34e-08 | 226 |
| GO:009887621 | Liver | HCC | vesicle-mediated transport to the plasma membrane | 92/7958 | 136/18723 | 2.57e-09 | 7.07e-08 | 92 |
| GO:00324562 | Liver | HCC | endocytic recycling | 48/7958 | 73/18723 | 5.07e-05 | 4.83e-04 | 48 |
| GO:005165610 | Oral cavity | OSCC | establishment of organelle localization | 239/7305 | 390/18723 | 2.46e-19 | 3.31e-17 | 239 |
| GO:00161979 | Oral cavity | OSCC | endosomal transport | 141/7305 | 230/18723 | 5.40e-12 | 2.06e-10 | 141 |
| GO:00988769 | Oral cavity | OSCC | vesicle-mediated transport to the plasma membrane | 79/7305 | 136/18723 | 4.93e-06 | 5.58e-05 | 79 |
| GO:00321037 | Oral cavity | OSCC | positive regulation of response to external stimulus | 203/7305 | 427/18723 | 1.79e-04 | 1.22e-03 | 203 |
| GO:00024441 | Oral cavity | OSCC | myeloid leukocyte mediated immunity | 50/7305 | 99/18723 | 1.31e-02 | 4.34e-02 | 50 |
| GO:00313495 | Oral cavity | OSCC | positive regulation of defense response | 127/7305 | 278/18723 | 1.32e-02 | 4.39e-02 | 127 |
| GO:005165624 | Skin | cSCC | establishment of organelle localization | 178/4864 | 390/18723 | 2.18e-17 | 2.32e-15 | 178 |
| GO:001619717 | Skin | cSCC | endosomal transport | 98/4864 | 230/18723 | 2.71e-08 | 7.41e-07 | 98 |
| Page: 1 2 |
| Pathway ID | Tissue | Disease Stage | Description | Gene Ratio | Bg Ratio | pvalue | p.adjust | qvalue | Count |
| hsa04144210 | Esophagus | ESCC | Endocytosis | 186/4205 | 251/8465 | 9.74e-16 | 4.66e-14 | 2.39e-14 | 186 |
| hsa0414437 | Esophagus | ESCC | Endocytosis | 186/4205 | 251/8465 | 9.74e-16 | 4.66e-14 | 2.39e-14 | 186 |
| hsa0414412 | Liver | Cirrhotic | Endocytosis | 119/2530 | 251/8465 | 2.33e-09 | 4.56e-08 | 2.81e-08 | 119 |
| hsa0414413 | Liver | Cirrhotic | Endocytosis | 119/2530 | 251/8465 | 2.33e-09 | 4.56e-08 | 2.81e-08 | 119 |
| hsa0414422 | Liver | HCC | Endocytosis | 178/4020 | 251/8465 | 2.03e-14 | 5.22e-13 | 2.91e-13 | 178 |
| hsa0414432 | Liver | HCC | Endocytosis | 178/4020 | 251/8465 | 2.03e-14 | 5.22e-13 | 2.91e-13 | 178 |
| hsa0414427 | Oral cavity | OSCC | Endocytosis | 174/3704 | 251/8465 | 9.42e-17 | 4.51e-15 | 2.29e-15 | 174 |
| hsa04144112 | Oral cavity | OSCC | Endocytosis | 174/3704 | 251/8465 | 9.42e-17 | 4.51e-15 | 2.29e-15 | 174 |
| Page: 1 |
Top |
Cell-cell communication analysis |
| Identification of potential cell-cell interactions between two cell types and their ligand-receptor pairs for different disease states |
| Ligand | Receptor | LRpair | Pathway | Tissue | Disease Stage |
| Page: 1 |
Top |
Single-cell gene regulatory network inference analysis |
| Find out the significant the regulons (TFs) and the target genes of each regulon across cell types for different disease states |
| TF | Cell Type | Tissue | Disease Stage | Target Gene | RSS | Regulon Activity |
| ∗The dot plots of a searched regulon are shown for all cell subpopulations in each disease state of each tissue based on the regulon specific score inferred using pySCENIC and by calculating the average expression. |
| Page: 1 |
Top |
Somatic mutation of malignant transformation related genes |
| Annotation of somatic variants for genes involved in malignant transformation |
| Hugo Symbol | Variant Class | Variant Classification | dbSNP RS | HGVSc | HGVSp | HGVSp Short | SWISSPROT | BIOTYPE | SIFT | PolyPhen | Tumor Sample Barcode | Tissue | Histology | Sex | Age | Stage | Therapy Types | Drugs | Outcome |
| SNX4 | SNV | Missense_Mutation | novel | c.1150N>A | p.Glu384Lys | p.E384K | O95219 | protein_coding | deleterious(0.01) | possibly_damaging(0.696) | TCGA-AC-A23H-01 | Breast | breast invasive carcinoma | Female | >=65 | I/II | Unknown | Unknown | PD |
| SNX4 | SNV | Missense_Mutation | novel | c.1138N>C | p.Glu380Gln | p.E380Q | O95219 | protein_coding | tolerated(0.6) | benign(0.003) | TCGA-AC-A5XS-01 | Breast | breast invasive carcinoma | Female | >=65 | I/II | Hormone Therapy | femara | SD |
| SNX4 | insertion | In_Frame_Ins | novel | c.983_984insCGGCCTTCTCACTTGTGAAAA | p.Leu328delinsPheGlyLeuLeuThrCysGluLys | p.L328delinsFGLLTCEK | O95219 | protein_coding | TCGA-A2-A04Y-01 | Breast | breast invasive carcinoma | Female | <65 | I/II | Chemotherapy | cytoxan | SD | ||
| SNX4 | SNV | Missense_Mutation | novel | c.760G>T | p.Val254Leu | p.V254L | O95219 | protein_coding | tolerated(0.65) | benign(0.009) | TCGA-A6-3810-01 | Colorectum | colon adenocarcinoma | Male | <65 | I/II | Unknown | Unknown | SD |
| SNX4 | SNV | Missense_Mutation | novel | c.1009T>C | p.Ser337Pro | p.S337P | O95219 | protein_coding | deleterious(0.04) | benign(0.341) | TCGA-AA-3814-01 | Colorectum | colon adenocarcinoma | Female | >=65 | I/II | Unknown | Unknown | SD |
| SNX4 | SNV | Missense_Mutation | c.617N>A | p.Ala206Glu | p.A206E | O95219 | protein_coding | deleterious(0) | benign(0.338) | TCGA-AA-A01D-01 | Colorectum | colon adenocarcinoma | Female | <65 | III/IV | Chemotherapy | capecitabine | PD | |
| SNX4 | SNV | Missense_Mutation | c.1024N>C | p.Cys342Arg | p.C342R | O95219 | protein_coding | tolerated(0.92) | benign(0) | TCGA-AD-6889-01 | Colorectum | colon adenocarcinoma | Male | >=65 | I/II | Chemotherapy | xeloda | PD | |
| SNX4 | SNV | Missense_Mutation | novel | c.863N>T | p.Ser288Phe | p.S288F | O95219 | protein_coding | deleterious(0.01) | benign(0.26) | TCGA-AZ-4315-01 | Colorectum | colon adenocarcinoma | Male | <65 | I/II | Unknown | Unknown | SD |
| SNX4 | SNV | Missense_Mutation | rs772965145 | c.313N>T | p.Arg105Trp | p.R105W | O95219 | protein_coding | deleterious(0) | probably_damaging(1) | TCGA-AZ-6598-01 | Colorectum | colon adenocarcinoma | Female | >=65 | I/II | Unknown | Unknown | SD |
| SNX4 | SNV | Missense_Mutation | novel | c.911T>C | p.Leu304Ser | p.L304S | O95219 | protein_coding | deleterious(0) | probably_damaging(0.927) | TCGA-EF-5830-01 | Colorectum | rectum adenocarcinoma | Male | <65 | I/II | Unknown | Unknown | SD |
| Page: 1 2 3 4 5 |
Top |
Related drugs of malignant transformation related genes |
| Identification of chemicals and drugs interact with genes involved in malignant transfromation |
| (DGIdb 4.0) |
| Entrez ID | Symbol | Category | Interaction Types | Drug Claim Name | Drug Name | PMIDs |
| Page: 1 |

Copyright 2023-Present -The University of Texas Health Science Center at Houston |