
|
|||||
|
 | |
| |
| |
| |
| |
| |
|
Gene: SNX33 |
Gene summary for SNX33 |
| Gene information | Species | Human | Gene symbol | SNX33 | Gene ID | 257364 |
| Gene name | sorting nexin 33 | |
| Gene Alias | SH3PX3 | |
| Cytomap | 15q24.2 | |
| Gene Type | protein-coding | GO ID | GO:0000278 | UniProtAcc | Q8WV41 |
Top |
Malignant transformation analysis |
| Identification of the aberrant gene expression in precancerous and cancerous lesions by comparing the gene expression of stem-like cells in diseased tissues with normal stem cells |
| Entrez ID | Symbol | Replicates | Species | Organ | Tissue | Adj P-value | Log2FC | Malignancy |
| 257364 | SNX33 | HCC1_Meng | Human | Liver | HCC | 4.98e-21 | 2.09e-02 | 0.0246 |
| 257364 | SNX33 | HCC2_Meng | Human | Liver | HCC | 3.13e-09 | 7.84e-02 | 0.0107 |
| 257364 | SNX33 | HCC5 | Human | Liver | HCC | 2.77e-03 | 6.64e-01 | 0.4932 |
| 257364 | SNX33 | S014 | Human | Liver | HCC | 1.54e-05 | 2.34e-01 | 0.2254 |
| 257364 | SNX33 | S015 | Human | Liver | HCC | 8.73e-07 | 3.35e-01 | 0.2375 |
| 257364 | SNX33 | S016 | Human | Liver | HCC | 1.30e-06 | 2.23e-01 | 0.2243 |
| 257364 | SNX33 | S027 | Human | Liver | HCC | 2.46e-07 | 6.21e-01 | 0.2446 |
| 257364 | SNX33 | S028 | Human | Liver | HCC | 2.67e-16 | 5.44e-01 | 0.2503 |
| 257364 | SNX33 | S029 | Human | Liver | HCC | 2.53e-21 | 6.63e-01 | 0.2581 |
| 257364 | SNX33 | C21 | Human | Oral cavity | OSCC | 5.34e-09 | 3.18e-01 | 0.2678 |
| 257364 | SNX33 | C30 | Human | Oral cavity | OSCC | 9.58e-17 | 5.99e-01 | 0.3055 |
| 257364 | SNX33 | C43 | Human | Oral cavity | OSCC | 1.41e-02 | 1.46e-01 | 0.1704 |
| 257364 | SNX33 | C51 | Human | Oral cavity | OSCC | 9.98e-05 | 2.67e-01 | 0.2674 |
| 257364 | SNX33 | C07 | Human | Oral cavity | OSCC | 3.37e-03 | 4.76e-01 | 0.2491 |
| 257364 | SNX33 | LP15 | Human | Oral cavity | LP | 1.79e-04 | 5.23e-01 | 0.2174 |
| 257364 | SNX33 | SYSMH3 | Human | Oral cavity | OSCC | 2.34e-06 | 2.42e-01 | 0.2442 |
| Page: 1 |
| Tissue | Expression Dynamics | Abbreviation |
| Liver | 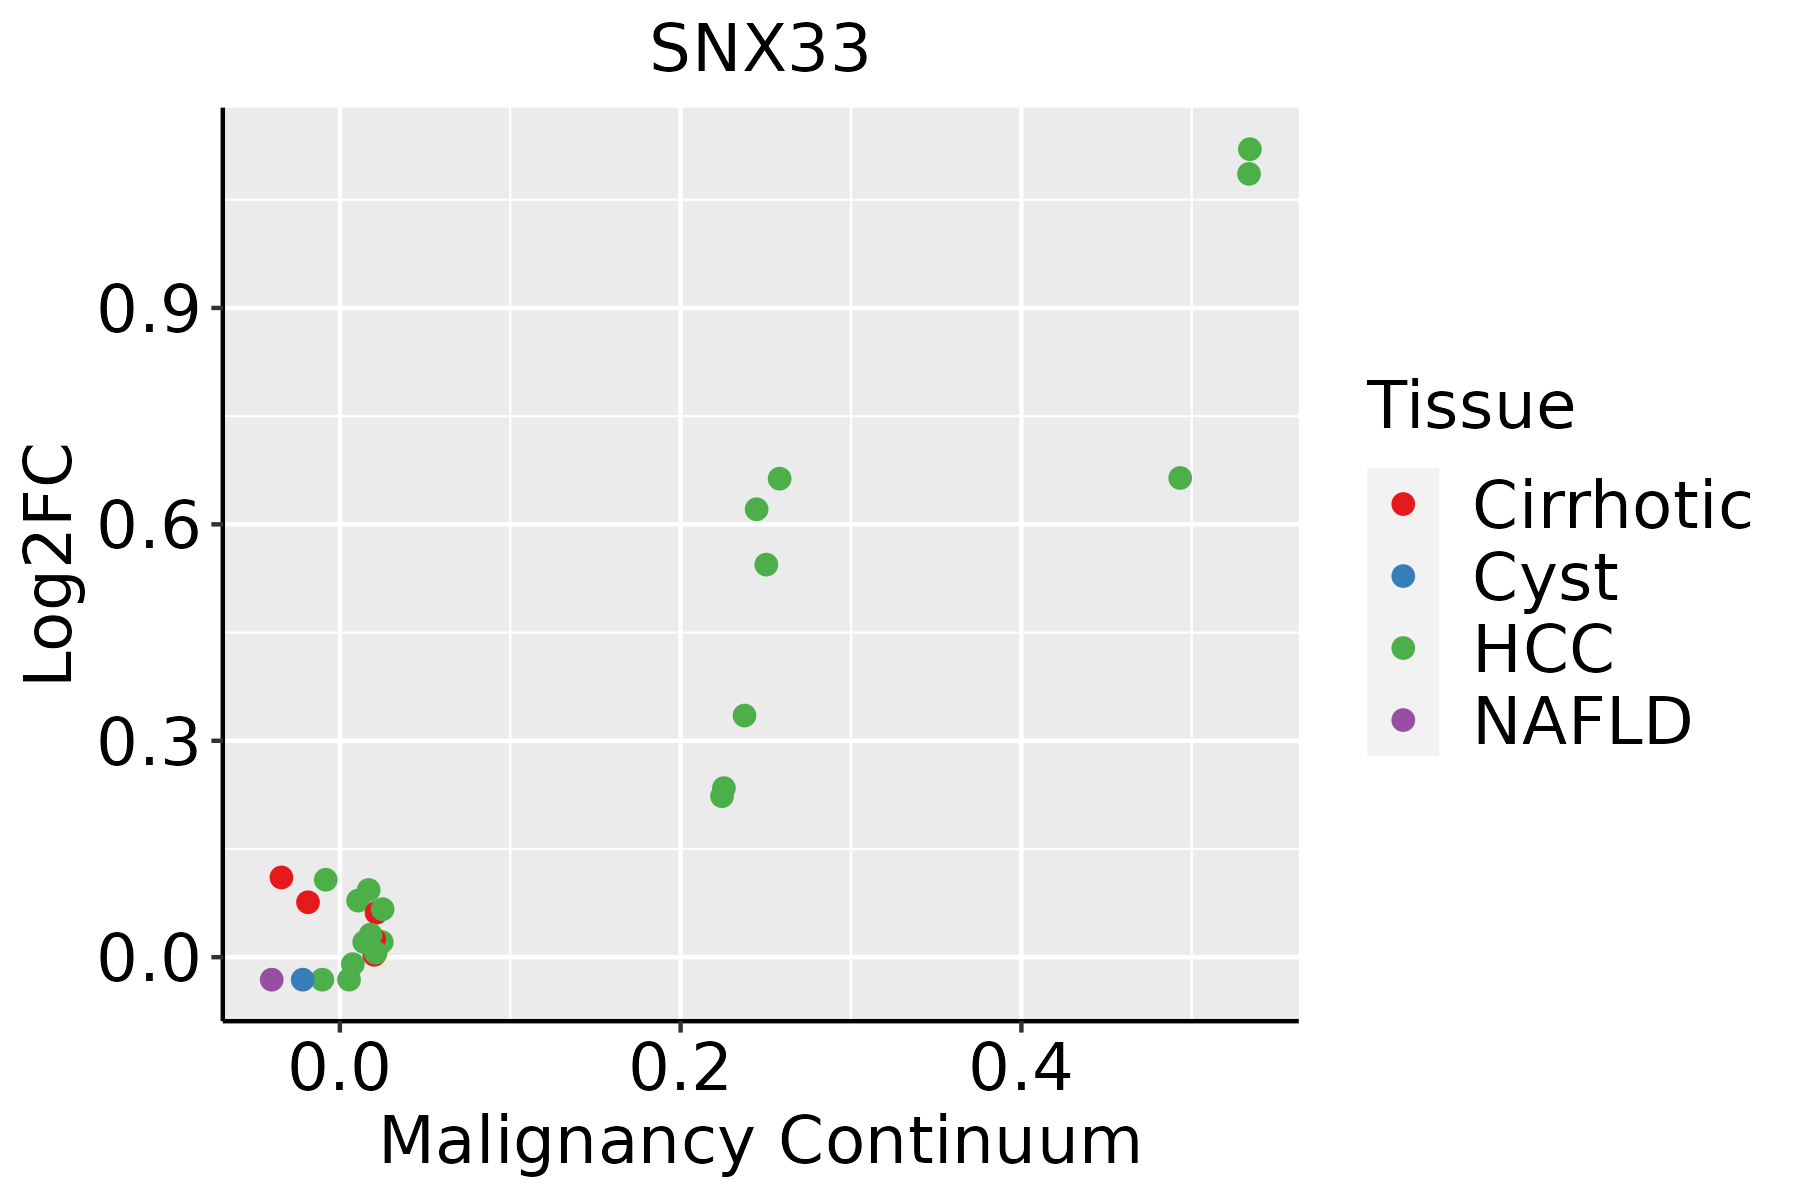 | HCC: Hepatocellular carcinoma |
| NAFLD: Non-alcoholic fatty liver disease | ||
| Oral Cavity |  | EOLP: Erosive Oral lichen planus |
| LP: leukoplakia | ||
| NEOLP: Non-erosive oral lichen planus | ||
| OSCC: Oral squamous cell carcinoma |
| ∗log2FC in expression of this searched gene in stem-like cells from each diseased tissue sample relative to stem-like cells in normal samples in each tissue plotted against the malignancy continuum. Samples are colored based on if they are from different disease stage. |
Top |
Malignant transformation related pathway analysis |
| Find out the enriched GO biological processes and KEGG pathways involved in transition from healthy to precancer to cancer |
| Tissue | Disease Stage | Enriched GO biological Processes |
| Colorectum | AD |  |
| Colorectum | SER |  |
| Colorectum | MSS |  |
| Colorectum | MSI-H |  |
| Colorectum | FAP |  |
| ∗Top 15 enriched GO BP terms are showed in the bar plot of each disease state in each tissue. Each row represents a significant GO biological process which is colored according to the -log10(p.adjust). |
| Page: 1 2 3 4 5 6 7 8 9 |
| GO ID | Tissue | Disease Stage | Description | Gene Ratio | Bg Ratio | pvalue | p.adjust | Count |
| GO:000989622 | Liver | HCC | positive regulation of catabolic process | 335/7958 | 492/18723 | 3.83e-31 | 1.87e-28 | 335 |
| GO:003133122 | Liver | HCC | positive regulation of cellular catabolic process | 295/7958 | 427/18723 | 3.20e-29 | 1.45e-26 | 295 |
| GO:004217622 | Liver | HCC | regulation of protein catabolic process | 267/7958 | 391/18723 | 2.45e-25 | 7.38e-23 | 267 |
| GO:190382922 | Liver | HCC | positive regulation of cellular protein localization | 199/7958 | 276/18723 | 1.15e-23 | 2.62e-21 | 199 |
| GO:004573222 | Liver | HCC | positive regulation of protein catabolic process | 163/7958 | 231/18723 | 4.00e-18 | 4.69e-16 | 163 |
| GO:001605021 | Liver | HCC | vesicle organization | 194/7958 | 300/18723 | 5.58e-15 | 3.97e-13 | 194 |
| GO:004586222 | Liver | HCC | positive regulation of proteolysis | 232/7958 | 372/18723 | 5.66e-15 | 3.98e-13 | 232 |
| GO:001619721 | Liver | HCC | endosomal transport | 154/7958 | 230/18723 | 4.74e-14 | 2.95e-12 | 154 |
| GO:001703811 | Liver | HCC | protein import | 140/7958 | 206/18723 | 1.12e-13 | 6.46e-12 | 140 |
| GO:000703211 | Liver | HCC | endosome organization | 61/7958 | 82/18723 | 4.36e-09 | 1.15e-07 | 61 |
| GO:003250611 | Liver | HCC | cytokinetic process | 32/7958 | 39/18723 | 4.73e-07 | 7.69e-06 | 32 |
| GO:000028111 | Liver | HCC | mitotic cytokinesis | 51/7958 | 71/18723 | 5.20e-07 | 8.38e-06 | 51 |
| GO:000091011 | Liver | HCC | cytokinesis | 100/7958 | 173/18723 | 3.38e-05 | 3.39e-04 | 100 |
| GO:190382811 | Liver | HCC | negative regulation of cellular protein localization | 71/7958 | 117/18723 | 5.44e-05 | 5.12e-04 | 71 |
| GO:003010021 | Liver | HCC | regulation of endocytosis | 117/7958 | 211/18723 | 9.56e-05 | 8.32e-04 | 117 |
| GO:006164011 | Liver | HCC | cytoskeleton-dependent cytokinesis | 60/7958 | 100/18723 | 3.09e-04 | 2.20e-03 | 60 |
| GO:00065091 | Liver | HCC | membrane protein ectodomain proteolysis | 28/7958 | 43/18723 | 2.30e-03 | 1.14e-02 | 28 |
| GO:003361911 | Liver | HCC | membrane protein proteolysis | 35/7958 | 57/18723 | 3.08e-03 | 1.43e-02 | 35 |
| GO:00069071 | Liver | HCC | pinocytosis | 16/7958 | 22/18723 | 4.03e-03 | 1.76e-02 | 16 |
| GO:000989620 | Oral cavity | OSCC | positive regulation of catabolic process | 307/7305 | 492/18723 | 2.29e-26 | 7.64e-24 | 307 |
| Page: 1 2 3 |
| Pathway ID | Tissue | Disease Stage | Description | Gene Ratio | Bg Ratio | pvalue | p.adjust | qvalue | Count |
| hsa0513242 | Liver | HCC | Salmonella infection | 178/4020 | 249/8465 | 5.90e-15 | 1.98e-13 | 1.10e-13 | 178 |
| hsa0513252 | Liver | HCC | Salmonella infection | 178/4020 | 249/8465 | 5.90e-15 | 1.98e-13 | 1.10e-13 | 178 |
| hsa0513230 | Oral cavity | OSCC | Salmonella infection | 174/3704 | 249/8465 | 2.67e-17 | 1.49e-15 | 7.58e-16 | 174 |
| hsa05132114 | Oral cavity | OSCC | Salmonella infection | 174/3704 | 249/8465 | 2.67e-17 | 1.49e-15 | 7.58e-16 | 174 |
| hsa05132210 | Oral cavity | LP | Salmonella infection | 128/2418 | 249/8465 | 1.17e-14 | 2.79e-13 | 1.80e-13 | 128 |
| hsa0513238 | Oral cavity | LP | Salmonella infection | 128/2418 | 249/8465 | 1.17e-14 | 2.79e-13 | 1.80e-13 | 128 |
| Page: 1 |
Top |
Cell-cell communication analysis |
| Identification of potential cell-cell interactions between two cell types and their ligand-receptor pairs for different disease states |
| Ligand | Receptor | LRpair | Pathway | Tissue | Disease Stage |
| Page: 1 |
Top |
Single-cell gene regulatory network inference analysis |
| Find out the significant the regulons (TFs) and the target genes of each regulon across cell types for different disease states |
| TF | Cell Type | Tissue | Disease Stage | Target Gene | RSS | Regulon Activity |
| ∗The dot plots of a searched regulon are shown for all cell subpopulations in each disease state of each tissue based on the regulon specific score inferred using pySCENIC and by calculating the average expression. |
| Page: 1 |
Top |
Somatic mutation of malignant transformation related genes |
| Annotation of somatic variants for genes involved in malignant transformation |
| Hugo Symbol | Variant Class | Variant Classification | dbSNP RS | HGVSc | HGVSp | HGVSp Short | SWISSPROT | BIOTYPE | SIFT | PolyPhen | Tumor Sample Barcode | Tissue | Histology | Sex | Age | Stage | Therapy Types | Drugs | Outcome |
| SNX33 | SNV | Missense_Mutation | c.1559G>A | p.Cys520Tyr | p.C520Y | Q8WV41 | protein_coding | deleterious(0) | probably_damaging(0.942) | TCGA-A2-A0YJ-01 | Breast | breast invasive carcinoma | Female | <65 | III/IV | Chemotherapy | cytoxan | PD | |
| SNX33 | SNV | Missense_Mutation | novel | c.805N>G | p.His269Asp | p.H269D | Q8WV41 | protein_coding | deleterious(0) | probably_damaging(0.962) | TCGA-A8-A07P-01 | Breast | breast invasive carcinoma | Female | >=65 | I/II | Chemotherapy | 5-fluorouracil | SD |
| SNX33 | SNV | Missense_Mutation | c.656G>A | p.Arg219His | p.R219H | Q8WV41 | protein_coding | tolerated(0.54) | benign(0.223) | TCGA-A8-A0AD-01 | Breast | breast invasive carcinoma | Female | >=65 | I/II | Hormone Therapy | tamoxiphen | SD | |
| SNX33 | insertion | In_Frame_Ins | novel | c.803_804insGGCTGCTAAGGGAGGAGG | p.Lys268_His269insAlaAlaLysGlyGlyGly | p.K268_H269insAAKGGG | Q8WV41 | protein_coding | TCGA-A8-A07P-01 | Breast | breast invasive carcinoma | Female | >=65 | I/II | Chemotherapy | 5-fluorouracil | SD | ||
| SNX33 | insertion | Nonsense_Mutation | novel | c.695_696insAGCCCAGCTAGGAGTGGTGGGGGCAGTGGCTTCCT | p.Cys232Ter | p.C232* | Q8WV41 | protein_coding | TCGA-AN-A0FN-01 | Breast | breast invasive carcinoma | Female | <65 | I/II | Unknown | Unknown | SD | ||
| SNX33 | SNV | Missense_Mutation | novel | c.5N>T | p.Ala2Val | p.A2V | Q8WV41 | protein_coding | deleterious(0) | possibly_damaging(0.516) | TCGA-2W-A8YY-01 | Cervix | cervical & endocervical cancer | Female | <65 | I/II | Chemotherapy | cisplatin | CR |
| SNX33 | SNV | Missense_Mutation | rs765176187 | c.524N>A | p.Arg175Gln | p.R175Q | Q8WV41 | protein_coding | tolerated(0.25) | benign(0.06) | TCGA-EK-A2PG-01 | Cervix | cervical & endocervical cancer | Female | >=65 | I/II | Unknown | Unknown | SD |
| SNX33 | SNV | Missense_Mutation | c.1593G>T | p.Met531Ile | p.M531I | Q8WV41 | protein_coding | tolerated(1) | benign(0.007) | TCGA-AA-3510-01 | Colorectum | colon adenocarcinoma | Male | >=65 | I/II | Unknown | Unknown | SD | |
| SNX33 | SNV | Missense_Mutation | c.797N>A | p.Arg266His | p.R266H | Q8WV41 | protein_coding | deleterious(0) | probably_damaging(1) | TCGA-AA-3667-01 | Colorectum | colon adenocarcinoma | Female | <65 | I/II | Unknown | Unknown | SD | |
| SNX33 | SNV | Missense_Mutation | c.1146G>T | p.Lys382Asn | p.K382N | Q8WV41 | protein_coding | deleterious(0.01) | benign(0.444) | TCGA-AA-A010-01 | Colorectum | colon adenocarcinoma | Female | <65 | I/II | Chemotherapy | folinic | CR |
| Page: 1 2 3 4 5 |
Top |
Related drugs of malignant transformation related genes |
| Identification of chemicals and drugs interact with genes involved in malignant transfromation |
| (DGIdb 4.0) |
| Entrez ID | Symbol | Category | Interaction Types | Drug Claim Name | Drug Name | PMIDs |
| Page: 1 |

Copyright 2023-Present -The University of Texas Health Science Center at Houston |