
|
|||||
|
 | |
| |
| |
| |
| |
| |
|
Gene: SNX3 |
Gene summary for SNX3 |
| Gene information | Species | Human | Gene symbol | SNX3 | Gene ID | 8724 |
| Gene name | sorting nexin 3 | |
| Gene Alias | Grd19 | |
| Cytomap | 6q21 | |
| Gene Type | protein-coding | GO ID | GO:0006807 | UniProtAcc | O60493 |
Top |
Malignant transformation analysis |
| Identification of the aberrant gene expression in precancerous and cancerous lesions by comparing the gene expression of stem-like cells in diseased tissues with normal stem cells |
| Entrez ID | Symbol | Replicates | Species | Organ | Tissue | Adj P-value | Log2FC | Malignancy |
| 8724 | SNX3 | GSM4909280 | Human | Breast | Precancer | 3.95e-06 | -5.58e-01 | 0.0305 |
| 8724 | SNX3 | GSM4909289 | Human | Breast | IDC | 4.24e-10 | 5.17e-01 | 0.1064 |
| 8724 | SNX3 | GSM4909293 | Human | Breast | IDC | 7.03e-07 | -1.94e-01 | 0.1581 |
| 8724 | SNX3 | GSM4909294 | Human | Breast | IDC | 3.08e-07 | -1.84e-01 | 0.2022 |
| 8724 | SNX3 | GSM4909296 | Human | Breast | IDC | 9.15e-26 | -5.62e-01 | 0.1524 |
| 8724 | SNX3 | GSM4909297 | Human | Breast | IDC | 5.37e-27 | -3.66e-01 | 0.1517 |
| 8724 | SNX3 | GSM4909301 | Human | Breast | IDC | 4.46e-23 | -5.65e-01 | 0.1577 |
| 8724 | SNX3 | GSM4909302 | Human | Breast | IDC | 1.37e-12 | -4.87e-01 | 0.1545 |
| 8724 | SNX3 | GSM4909304 | Human | Breast | IDC | 5.05e-11 | -4.18e-01 | 0.1636 |
| 8724 | SNX3 | GSM4909308 | Human | Breast | IDC | 4.59e-15 | 4.29e-01 | 0.158 |
| 8724 | SNX3 | GSM4909309 | Human | Breast | IDC | 1.80e-06 | -1.42e-01 | 0.0483 |
| 8724 | SNX3 | GSM4909311 | Human | Breast | IDC | 5.60e-51 | -6.76e-01 | 0.1534 |
| 8724 | SNX3 | GSM4909312 | Human | Breast | IDC | 8.39e-18 | -1.63e-01 | 0.1552 |
| 8724 | SNX3 | GSM4909313 | Human | Breast | IDC | 2.35e-02 | -8.24e-02 | 0.0391 |
| 8724 | SNX3 | GSM4909315 | Human | Breast | IDC | 2.23e-23 | 3.81e-01 | 0.21 |
| 8724 | SNX3 | GSM4909316 | Human | Breast | IDC | 3.06e-16 | 3.27e-01 | 0.21 |
| 8724 | SNX3 | GSM4909317 | Human | Breast | IDC | 2.76e-05 | -3.71e-01 | 0.1355 |
| 8724 | SNX3 | GSM4909318 | Human | Breast | IDC | 1.81e-02 | -2.58e-01 | 0.2031 |
| 8724 | SNX3 | GSM4909319 | Human | Breast | IDC | 1.09e-58 | -7.36e-01 | 0.1563 |
| 8724 | SNX3 | GSM4909320 | Human | Breast | IDC | 2.32e-11 | -6.08e-01 | 0.1575 |
| Page: 1 2 3 4 5 6 7 8 9 10 11 |
| Tissue | Expression Dynamics | Abbreviation |
| Breast |  | IDC: Invasive ductal carcinoma |
| DCIS: Ductal carcinoma in situ | ||
| Precancer(BRCA1-mut): Precancerous lesion from BRCA1 mutation carriers | ||
| Cervix | 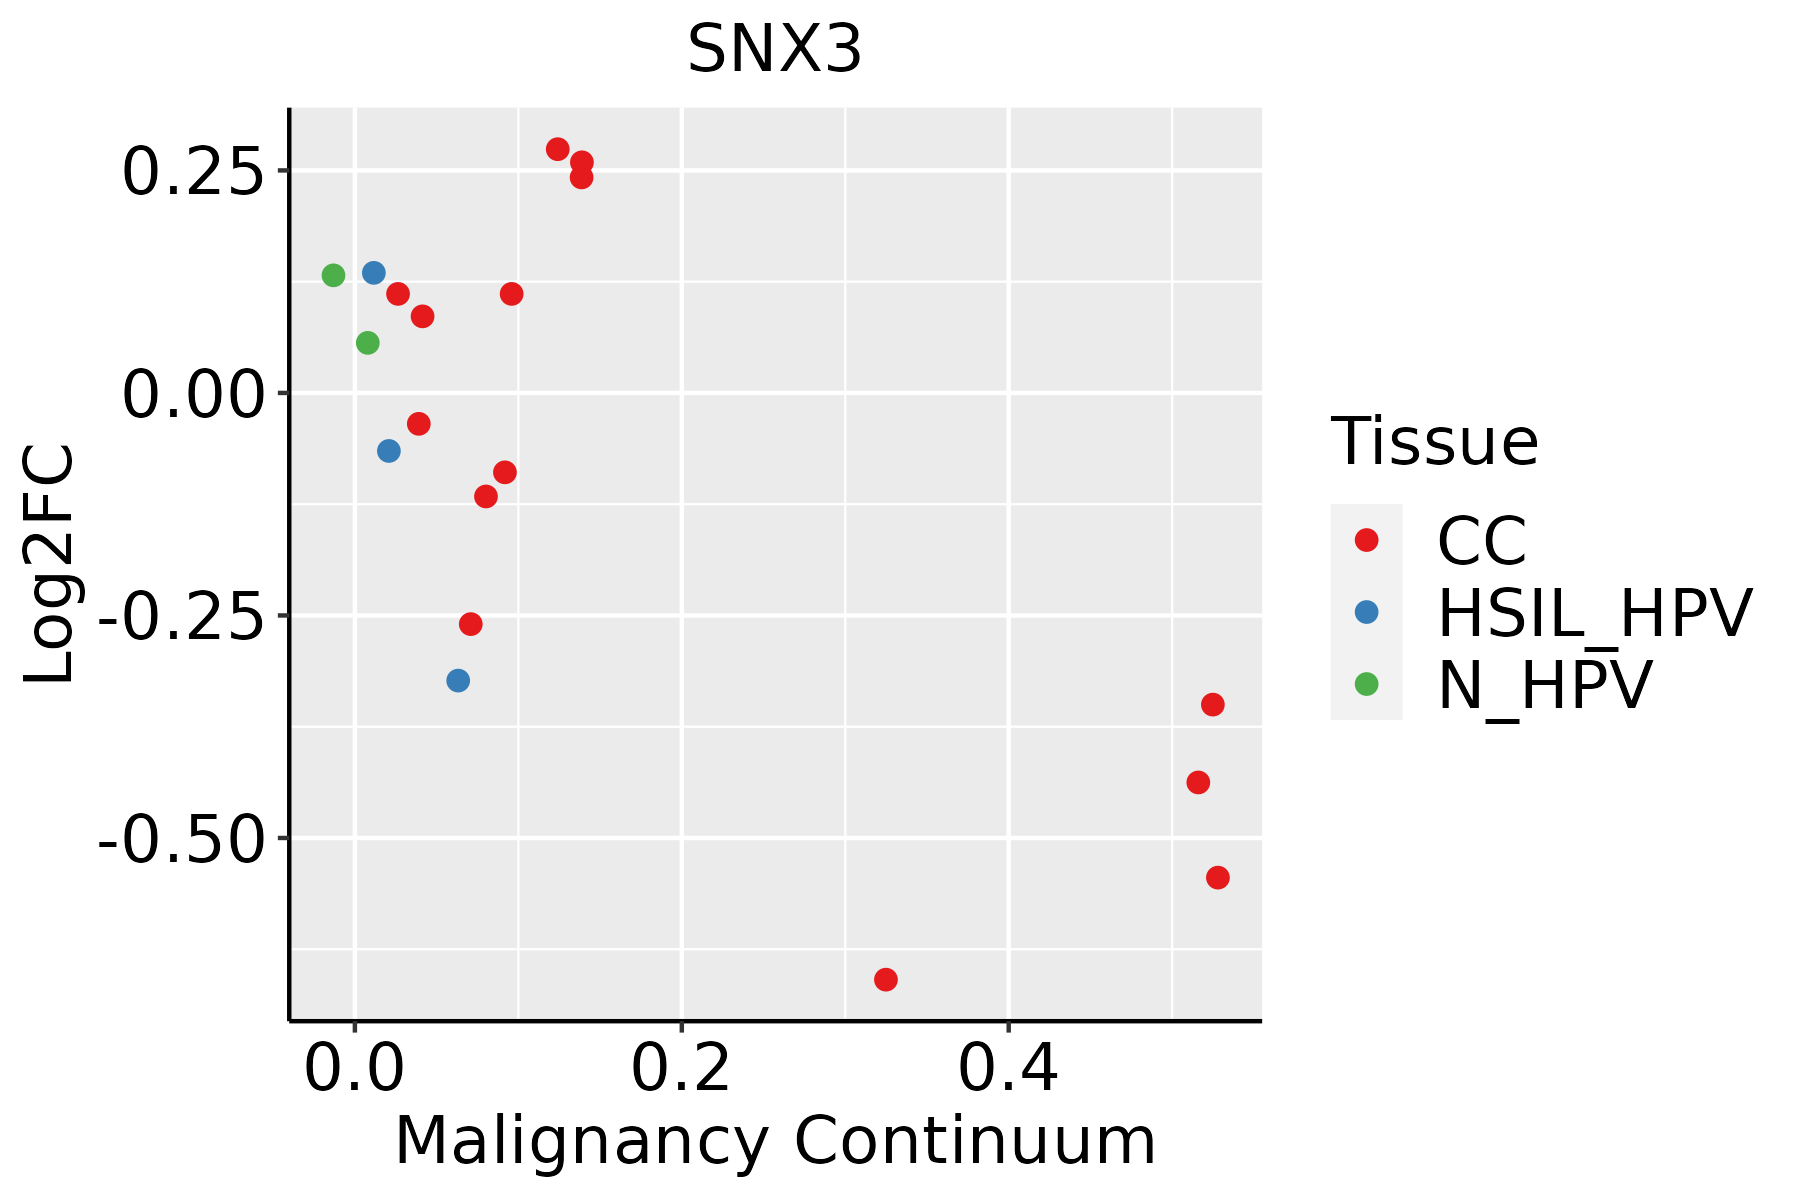 | CC: Cervix cancer |
| HSIL_HPV: HPV-infected high-grade squamous intraepithelial lesions | ||
| N_HPV: HPV-infected normal cervix | ||
| Endometrium | 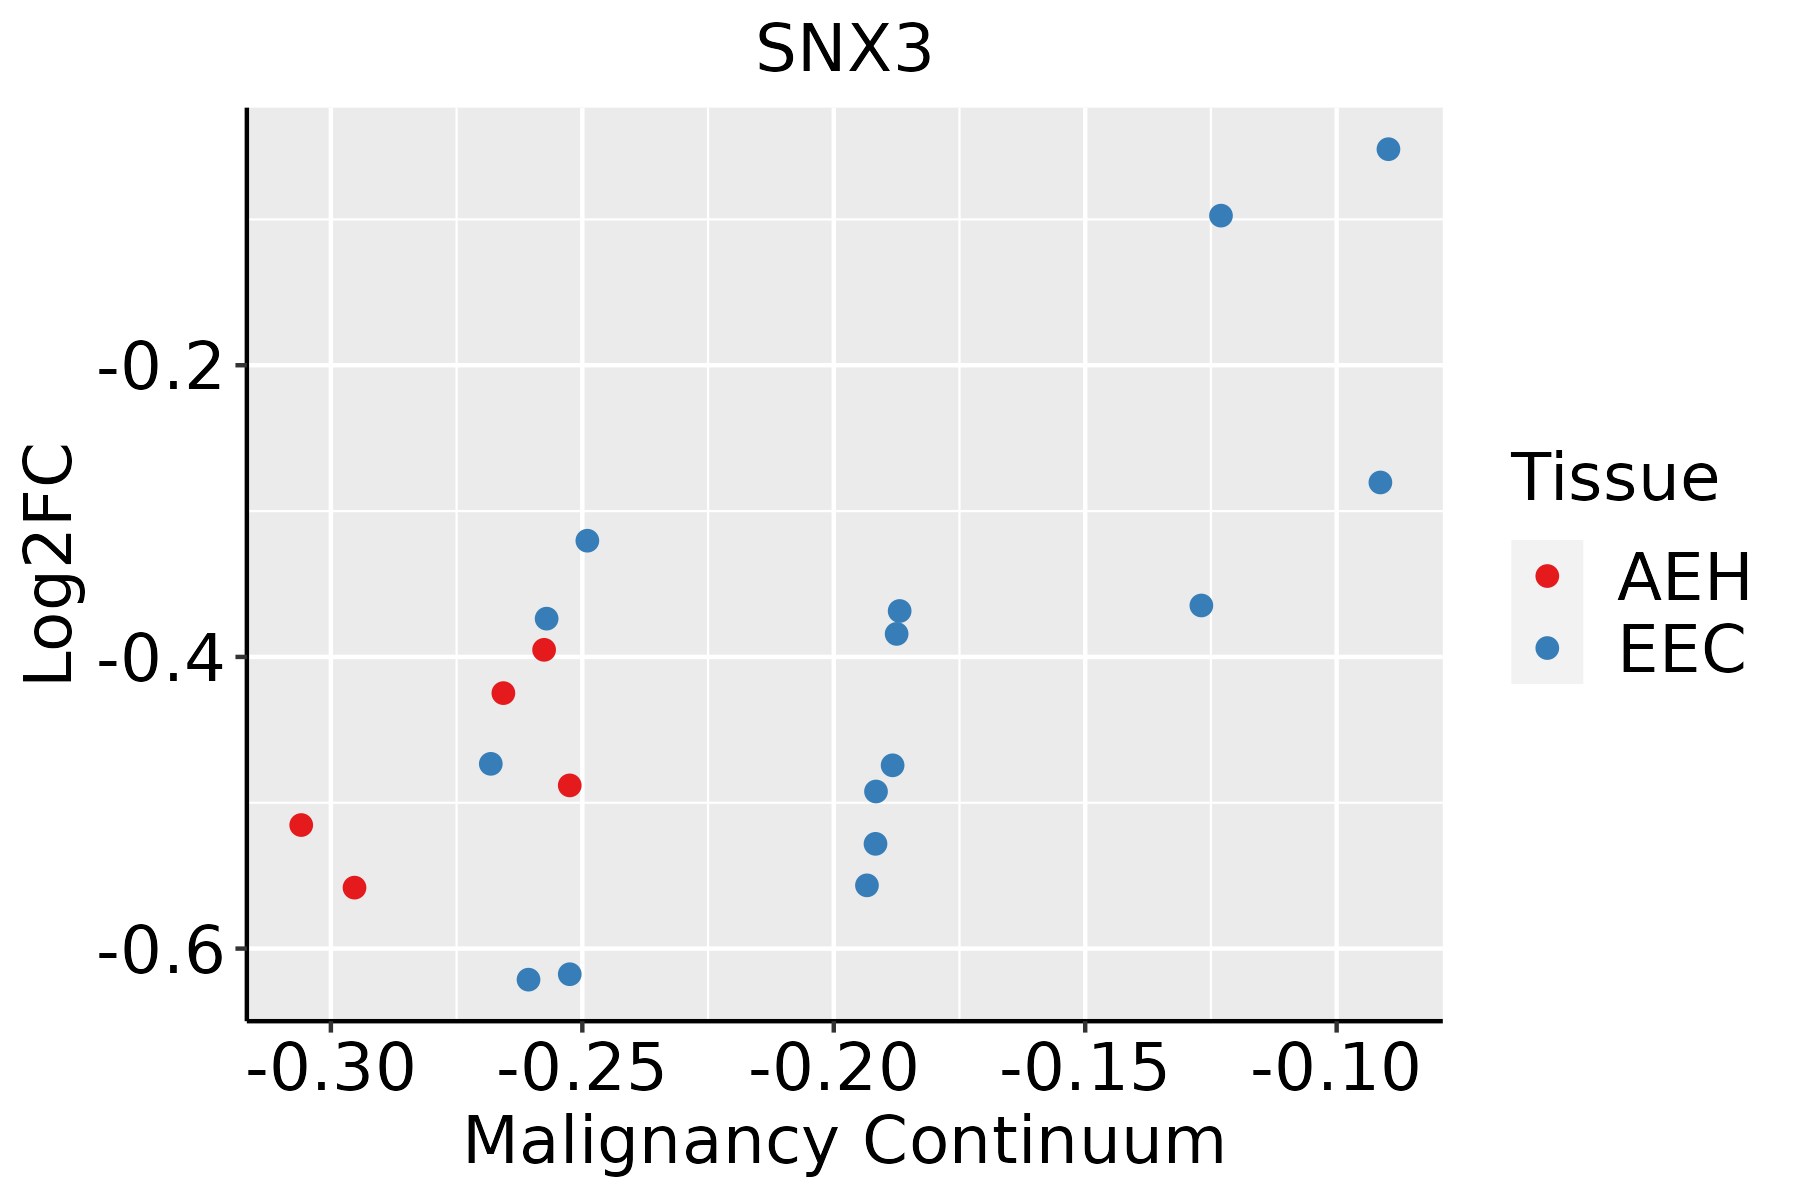 | AEH: Atypical endometrial hyperplasia |
| EEC: Endometrioid Cancer | ||
| Esophagus | 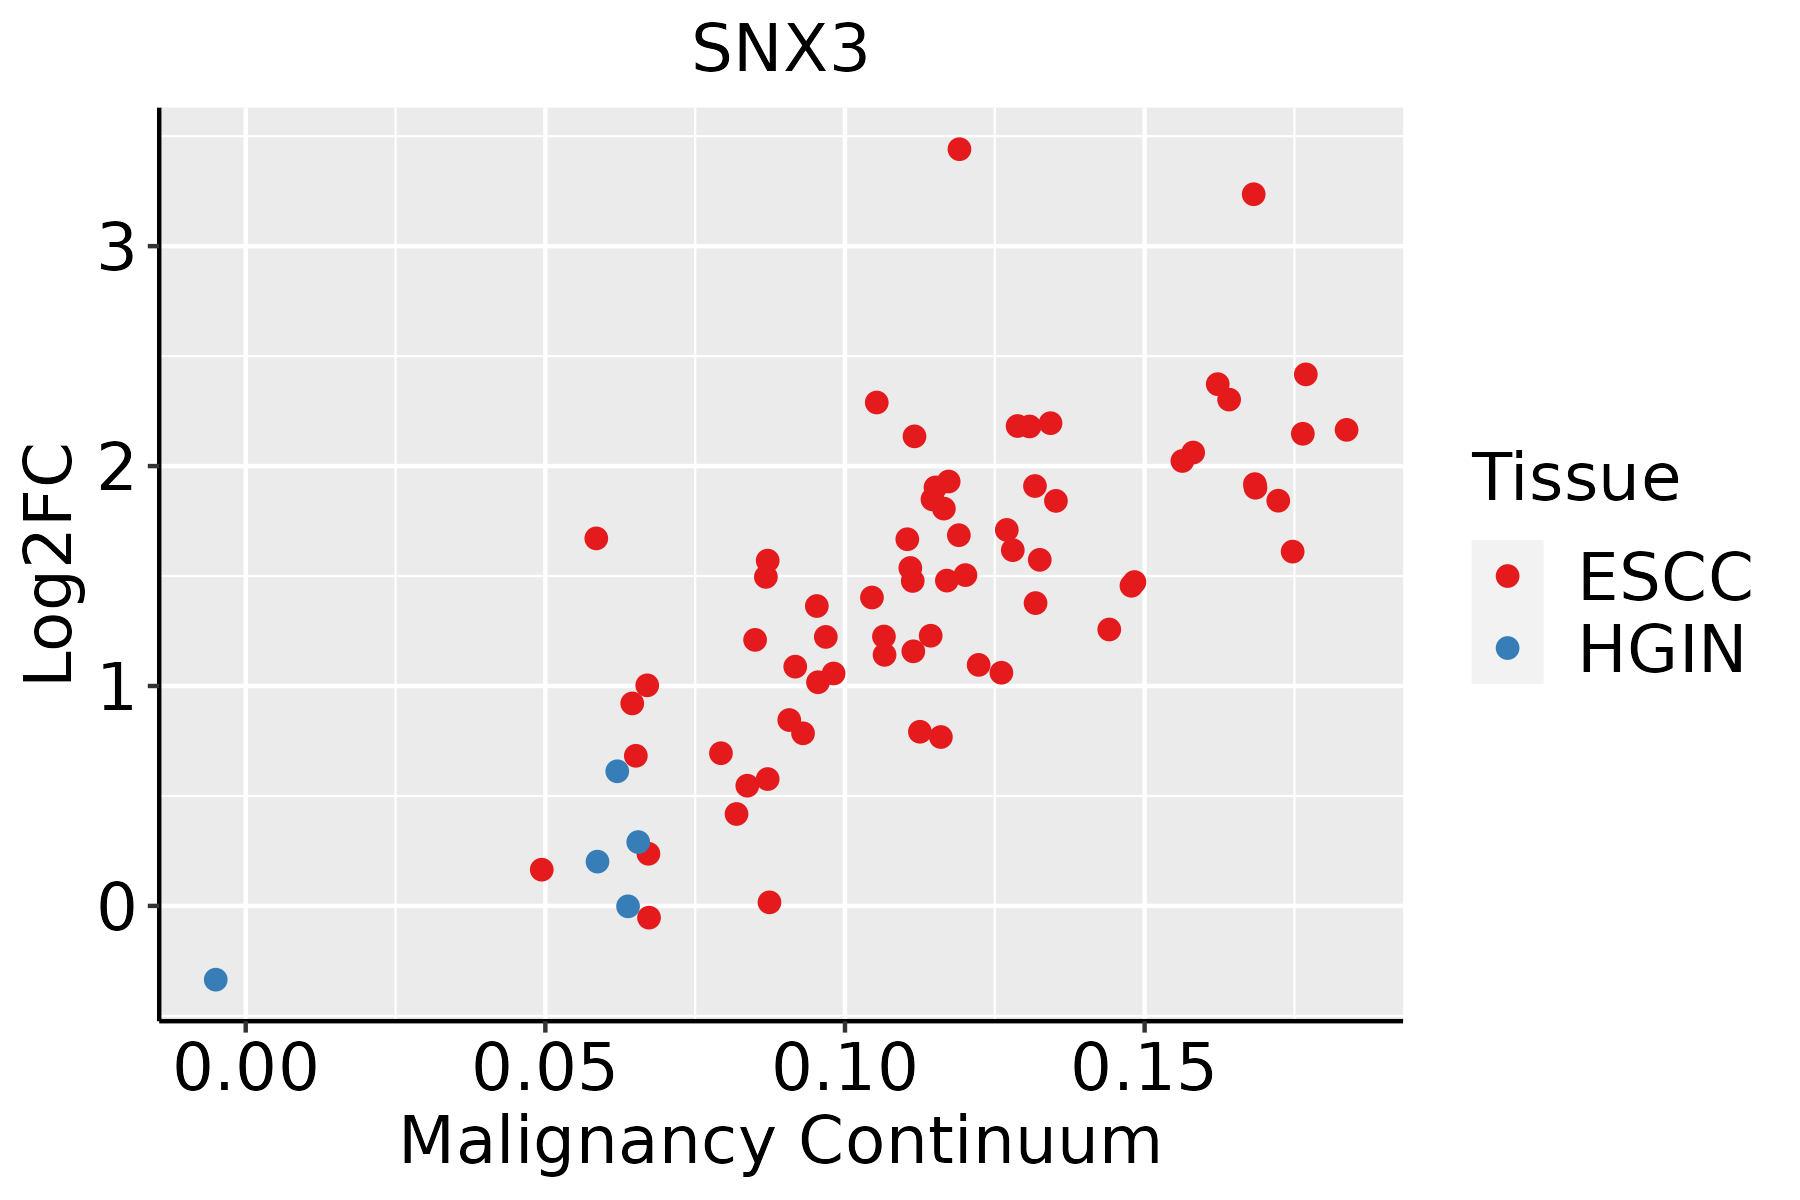 | ESCC: Esophageal squamous cell carcinoma |
| HGIN: High-grade intraepithelial neoplasias | ||
| LGIN: Low-grade intraepithelial neoplasias | ||
| Liver | 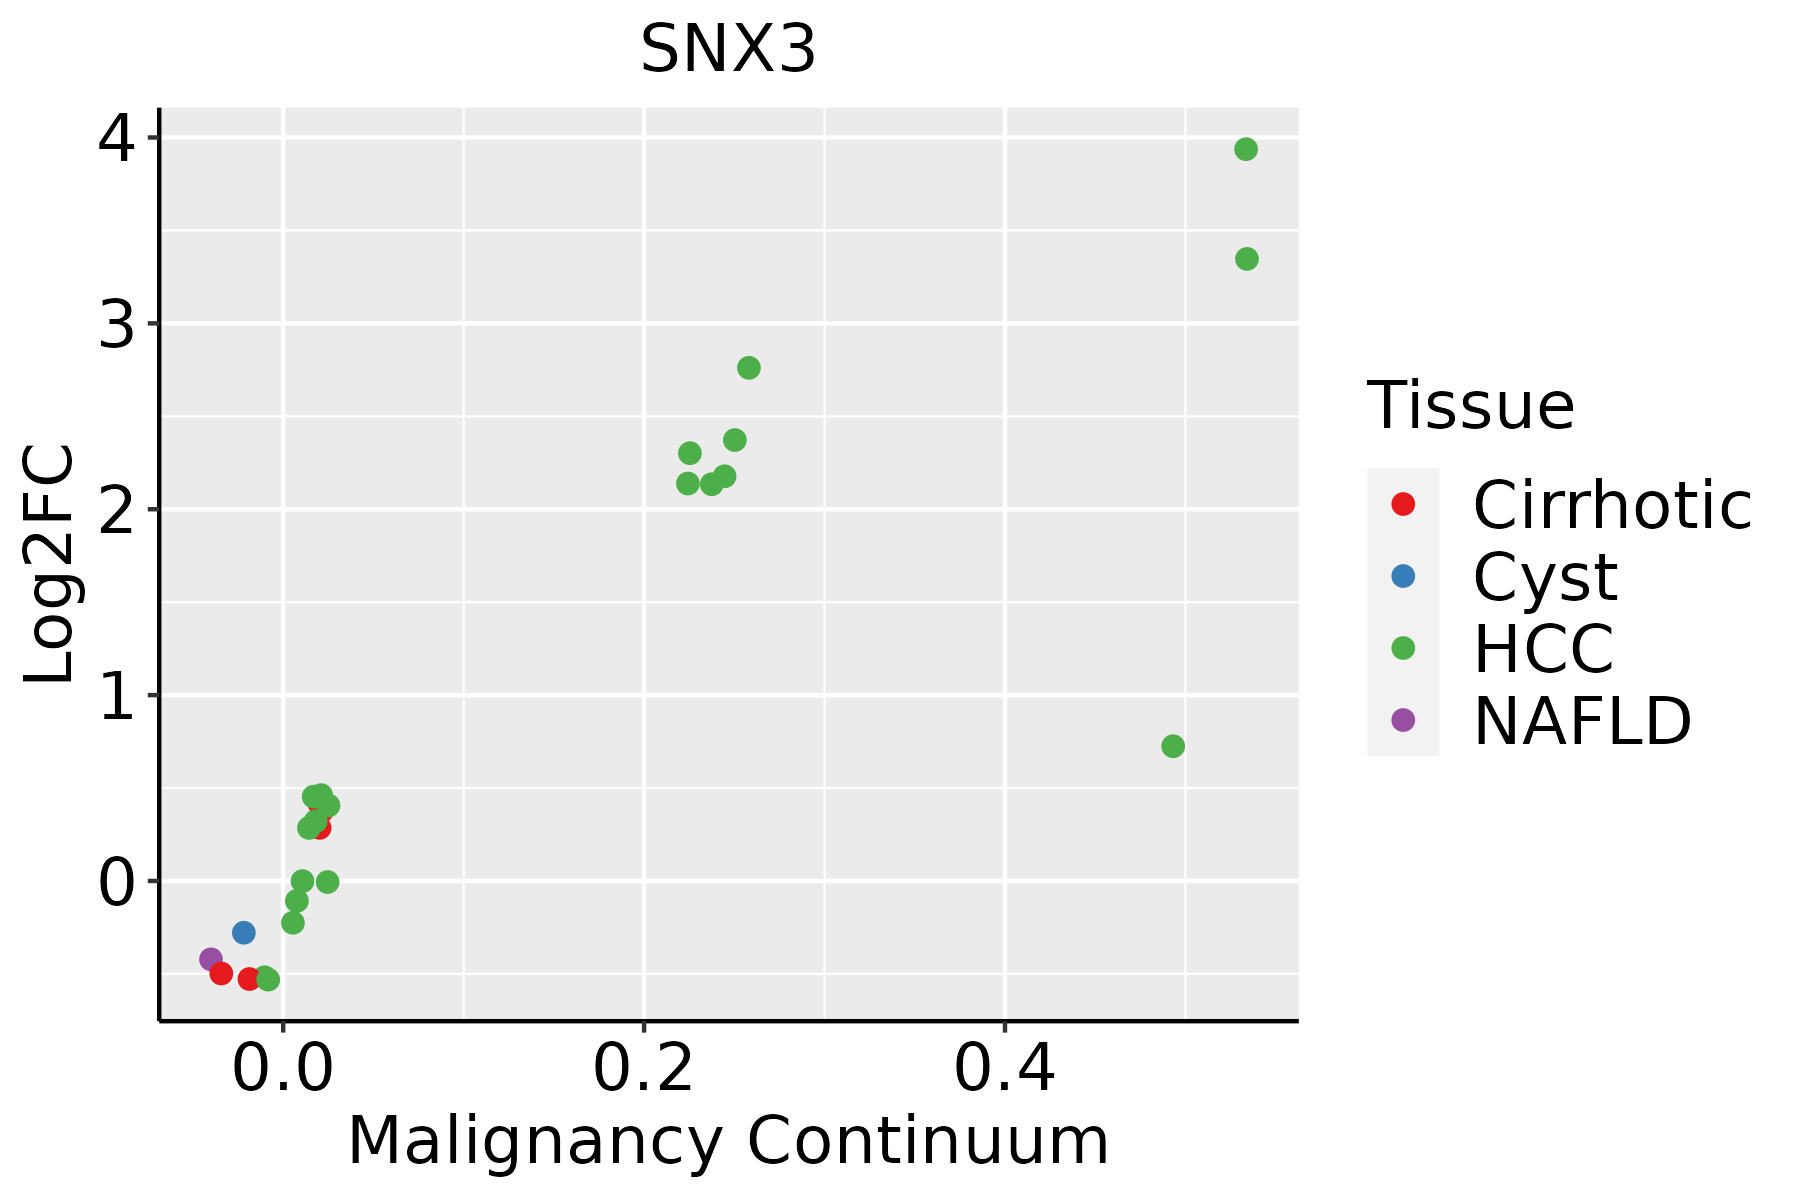 | HCC: Hepatocellular carcinoma |
| NAFLD: Non-alcoholic fatty liver disease | ||
| Oral Cavity | 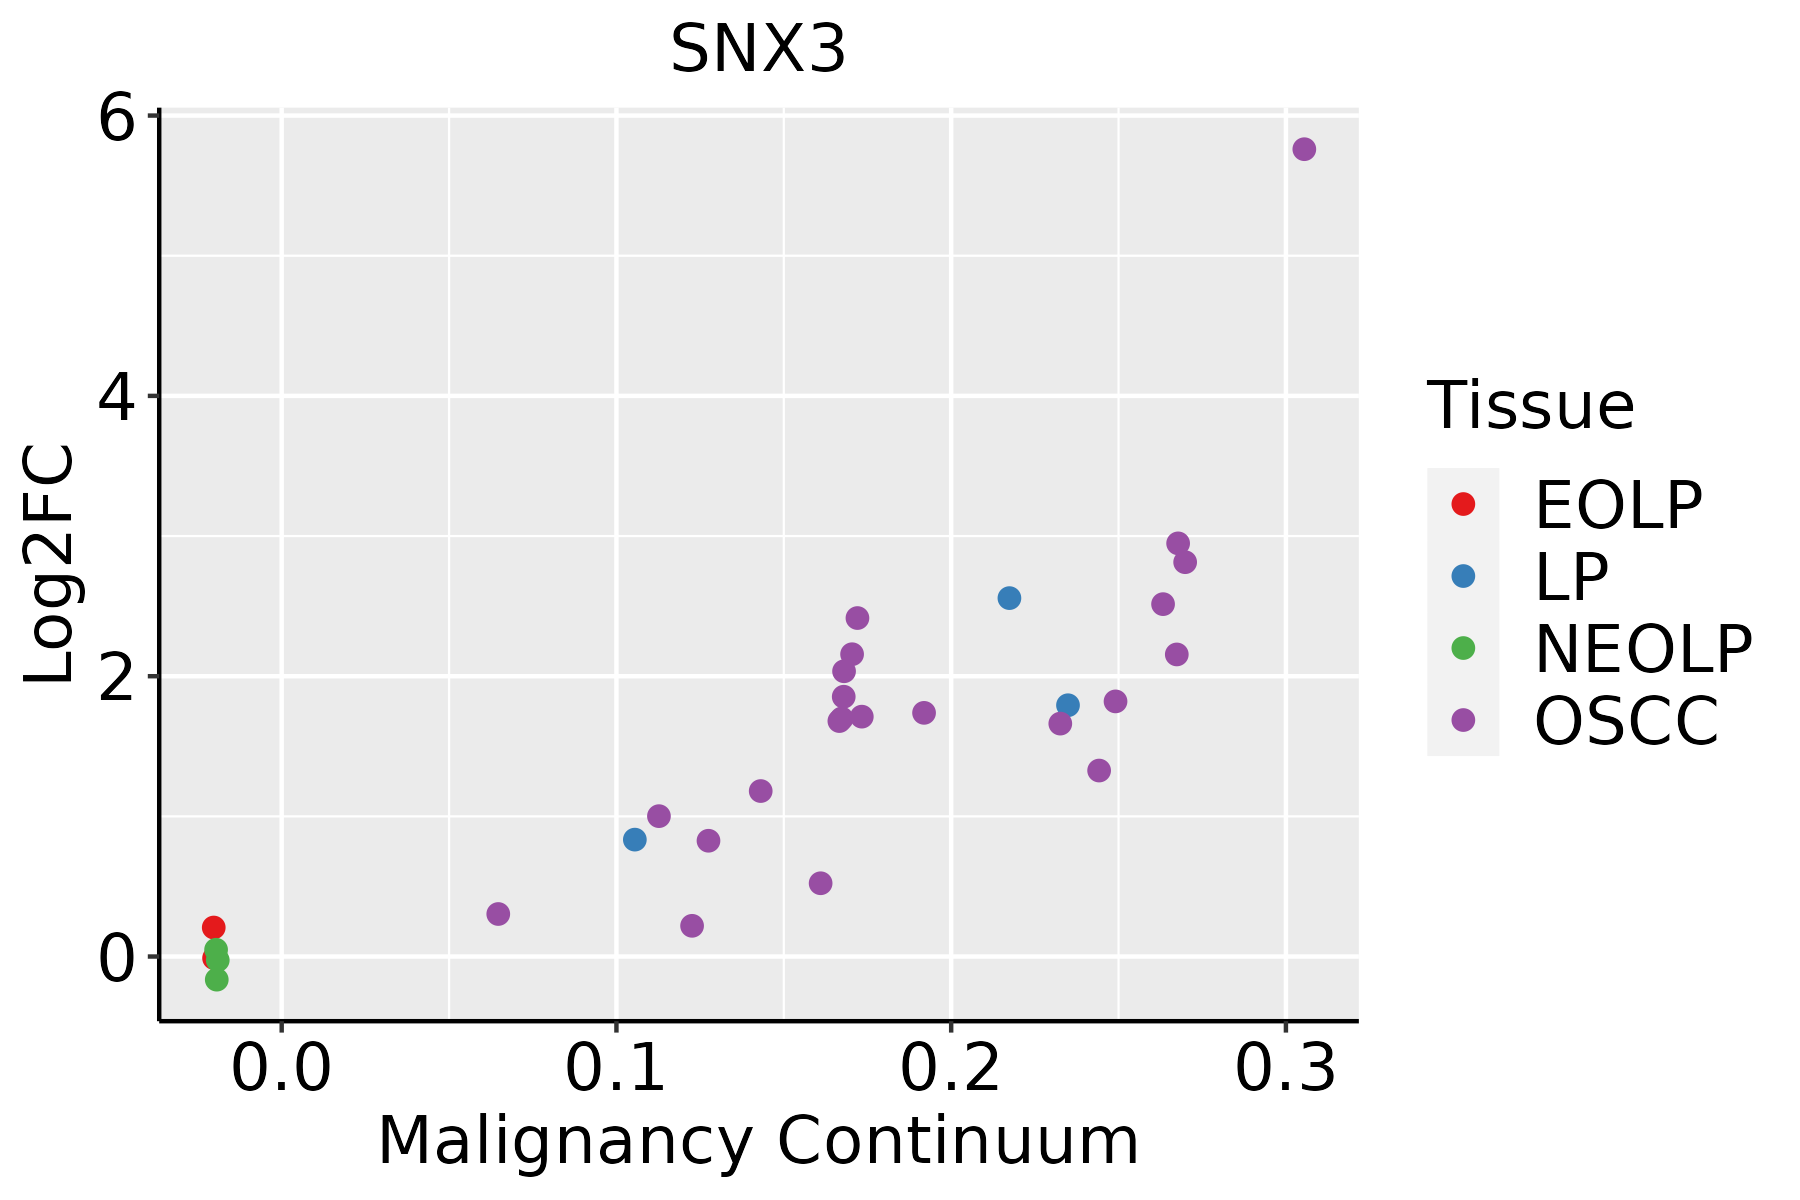 | EOLP: Erosive Oral lichen planus |
| LP: leukoplakia | ||
| NEOLP: Non-erosive oral lichen planus | ||
| OSCC: Oral squamous cell carcinoma | ||
| Prostate | 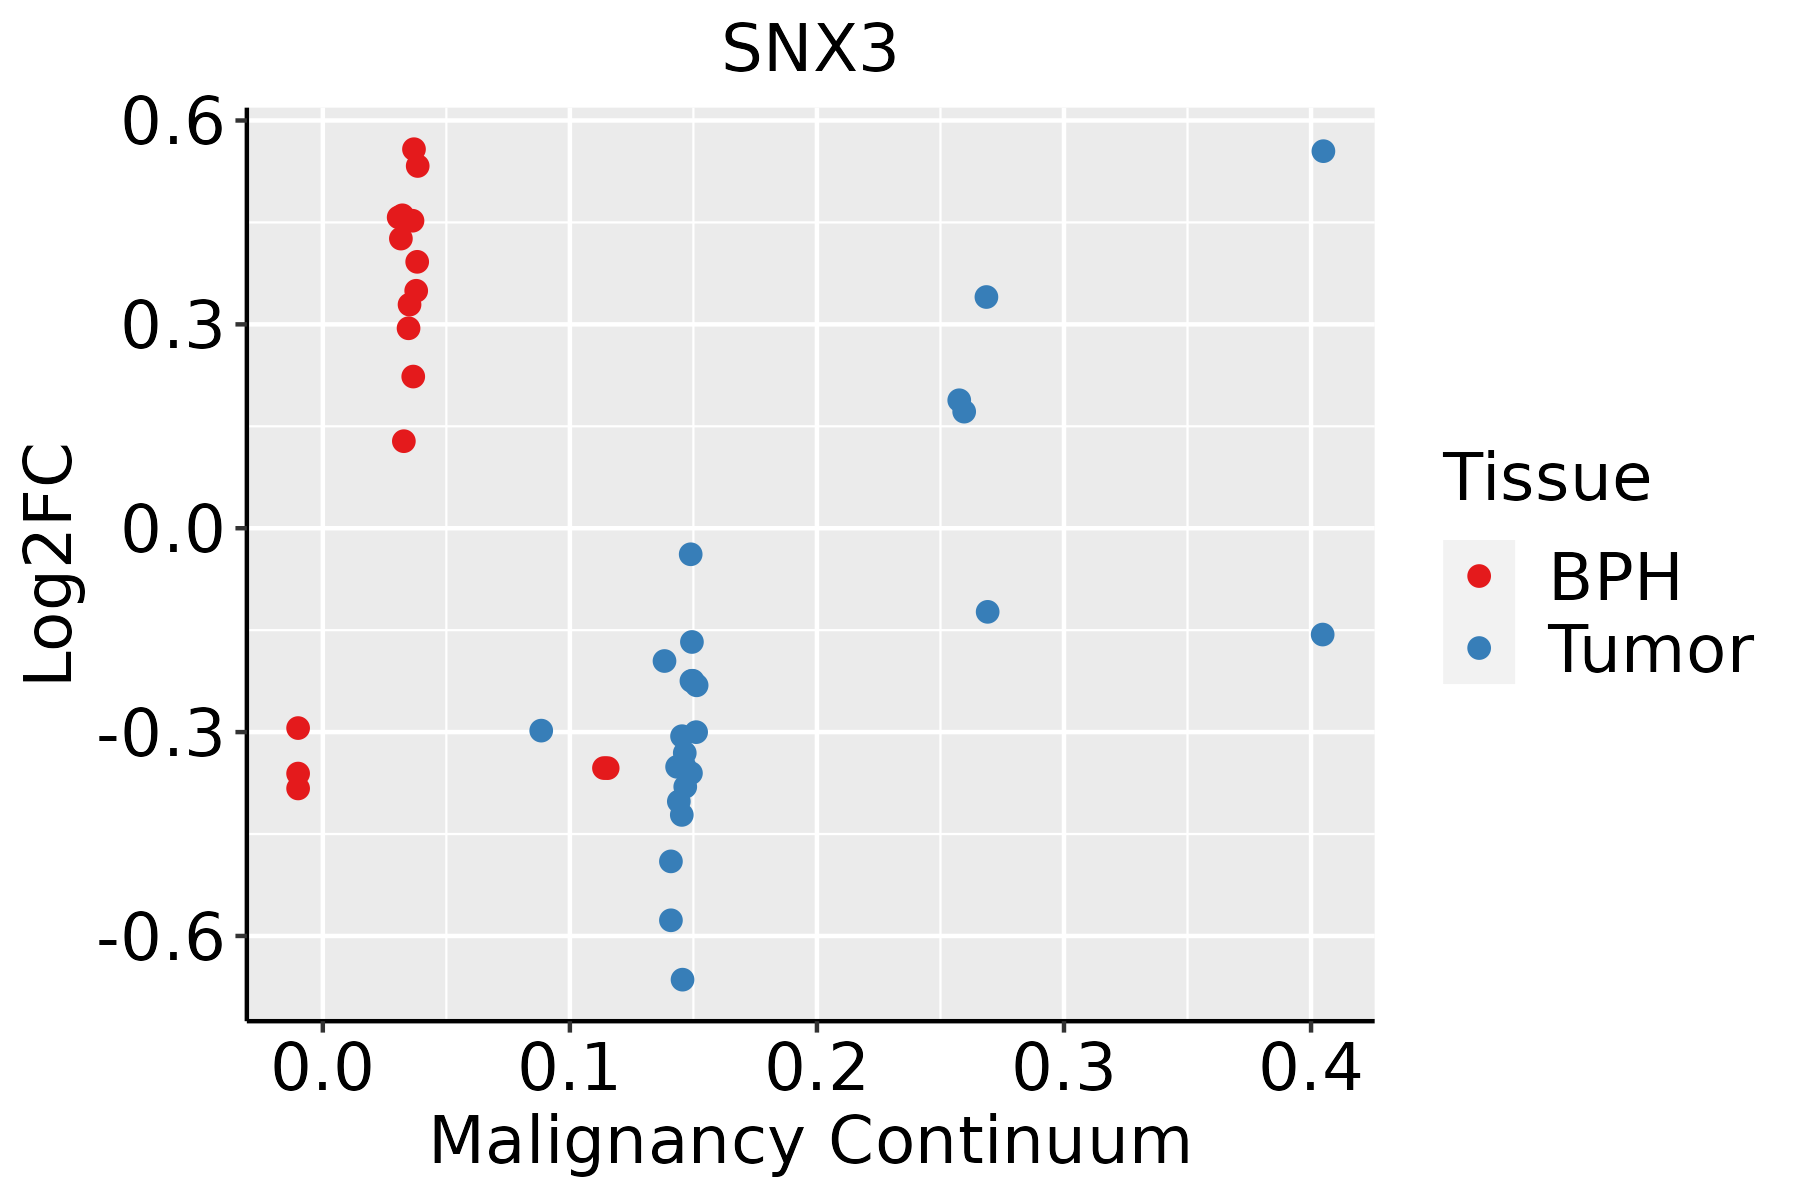 | BPH: Benign Prostatic Hyperplasia |
| Skin | 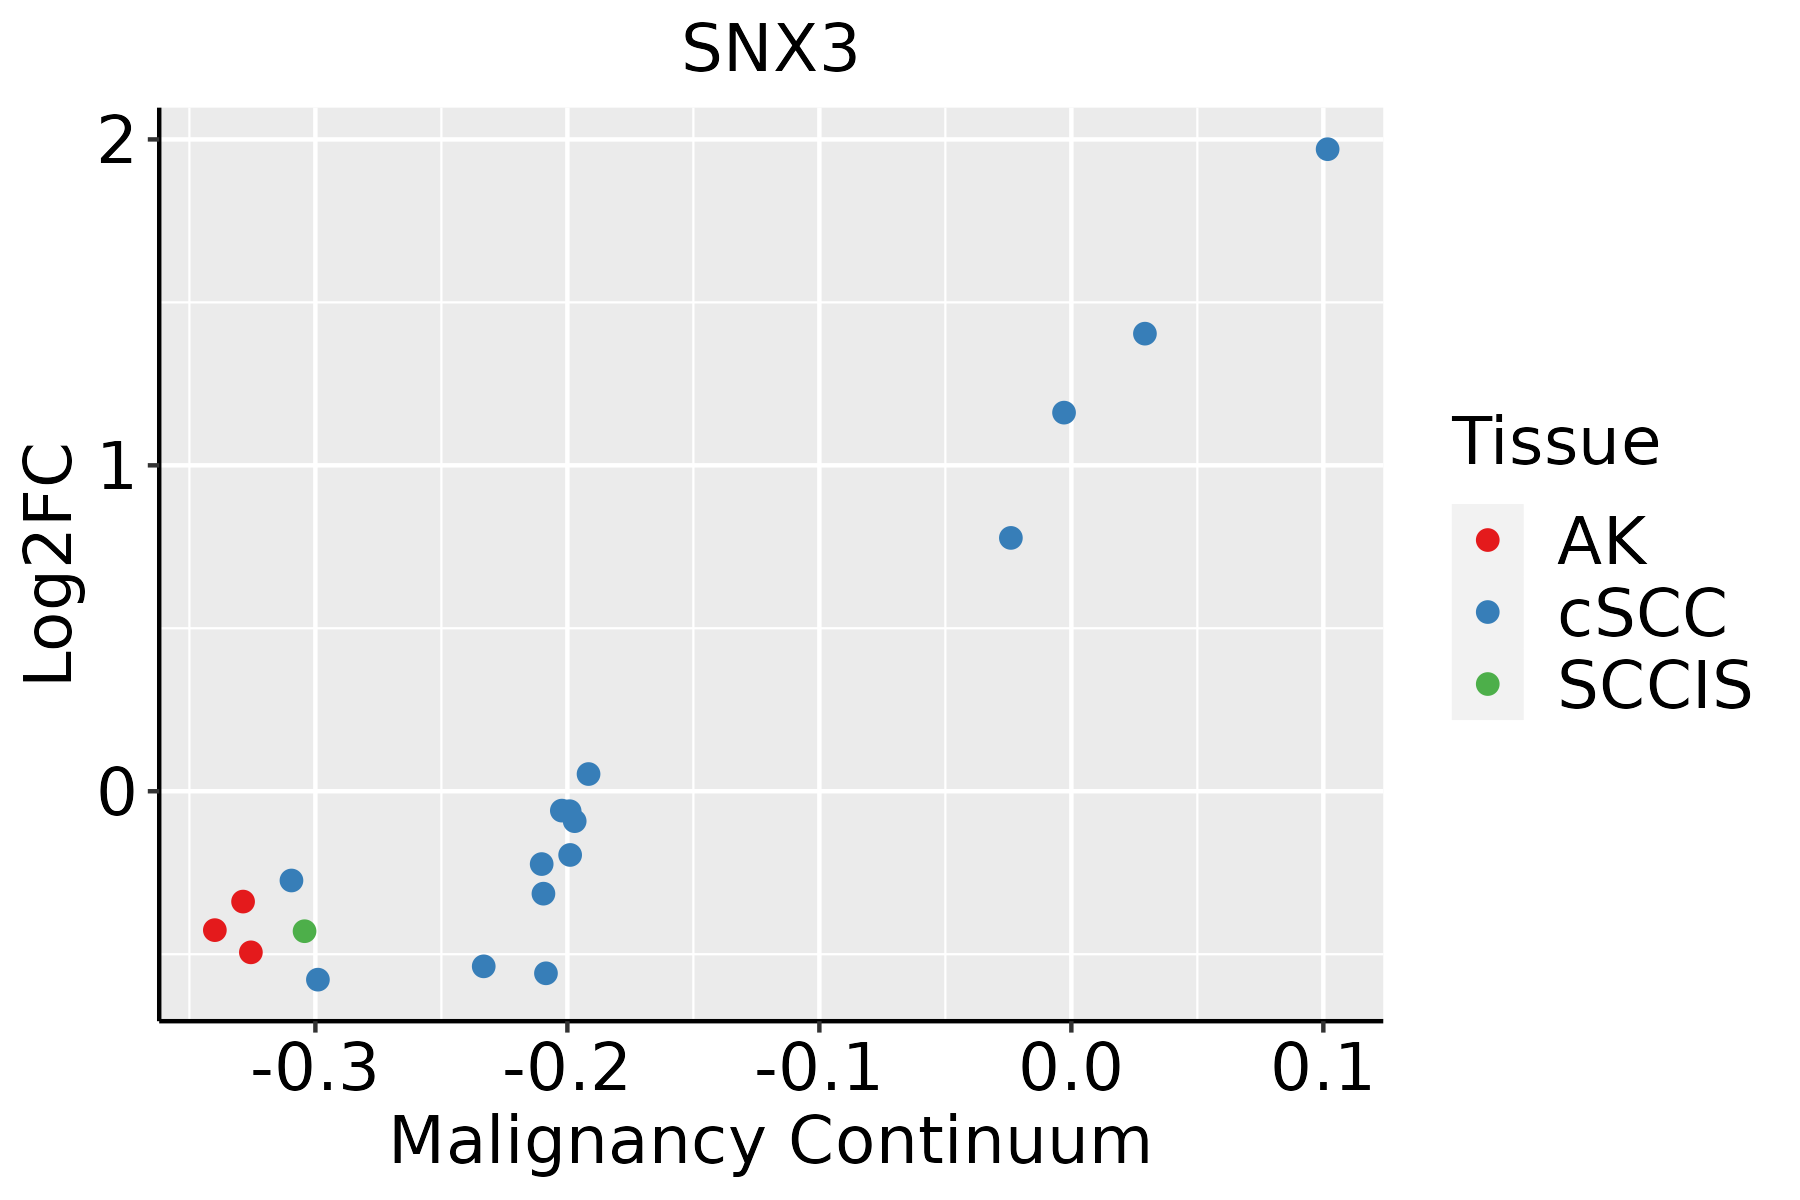 | AK: Actinic keratosis |
| cSCC: Cutaneous squamous cell carcinoma | ||
| SCCIS:squamous cell carcinoma in situ | ||
| Thyroid |  | ATC: Anaplastic thyroid cancer |
| HT: Hashimoto's thyroiditis | ||
| PTC: Papillary thyroid cancer |
| ∗log2FC in expression of this searched gene in stem-like cells from each diseased tissue sample relative to stem-like cells in normal samples in each tissue plotted against the malignancy continuum. Samples are colored based on if they are from different disease stage. |
Top |
Malignant transformation related pathway analysis |
| Find out the enriched GO biological processes and KEGG pathways involved in transition from healthy to precancer to cancer |
| Tissue | Disease Stage | Enriched GO biological Processes |
| Colorectum | AD |  |
| Colorectum | SER |  |
| Colorectum | MSS |  |
| Colorectum | MSI-H |  |
| Colorectum | FAP |  |
| ∗Top 15 enriched GO BP terms are showed in the bar plot of each disease state in each tissue. Each row represents a significant GO biological process which is colored according to the -log10(p.adjust). |
| Page: 1 2 3 4 5 6 7 8 9 |
| GO ID | Tissue | Disease Stage | Description | Gene Ratio | Bg Ratio | pvalue | p.adjust | Count |
| GO:00160329 | Breast | Precancer | viral process | 58/1080 | 415/18723 | 3.42e-10 | 3.16e-08 | 58 |
| GO:00190589 | Breast | Precancer | viral life cycle | 47/1080 | 317/18723 | 2.42e-09 | 1.99e-07 | 47 |
| GO:00444039 | Breast | Precancer | biological process involved in symbiotic interaction | 42/1080 | 290/18723 | 3.40e-08 | 2.11e-06 | 42 |
| GO:00521269 | Breast | Precancer | movement in host environment | 29/1080 | 175/18723 | 2.59e-07 | 1.28e-05 | 29 |
| GO:00517019 | Breast | Precancer | biological process involved in interaction with host | 31/1080 | 203/18723 | 6.52e-07 | 2.71e-05 | 31 |
| GO:00507929 | Breast | Precancer | regulation of viral process | 27/1080 | 164/18723 | 7.59e-07 | 3.05e-05 | 27 |
| GO:00421769 | Breast | Precancer | regulation of protein catabolic process | 47/1080 | 391/18723 | 1.50e-06 | 5.58e-05 | 47 |
| GO:00444099 | Breast | Precancer | entry into host | 25/1080 | 151/18723 | 1.74e-06 | 6.19e-05 | 25 |
| GO:00467189 | Breast | Precancer | viral entry into host cell | 24/1080 | 144/18723 | 2.46e-06 | 8.35e-05 | 24 |
| GO:00439039 | Breast | Precancer | regulation of biological process involved in symbiotic interaction | 15/1080 | 72/18723 | 1.23e-05 | 3.17e-04 | 15 |
| GO:19039009 | Breast | Precancer | regulation of viral life cycle | 23/1080 | 148/18723 | 1.31e-05 | 3.30e-04 | 23 |
| GO:00523727 | Breast | Precancer | modulation by symbiont of entry into host | 12/1080 | 49/18723 | 1.61e-05 | 3.93e-04 | 12 |
| GO:00465964 | Breast | Precancer | regulation of viral entry into host cell | 11/1080 | 42/18723 | 1.83e-05 | 4.35e-04 | 11 |
| GO:00098959 | Breast | Precancer | negative regulation of catabolic process | 36/1080 | 320/18723 | 9.92e-05 | 1.83e-03 | 36 |
| GO:00069009 | Breast | Precancer | vesicle budding from membrane | 12/1080 | 61/18723 | 1.61e-04 | 2.69e-03 | 12 |
| GO:19039014 | Breast | Precancer | negative regulation of viral life cycle | 7/1080 | 25/18723 | 4.00e-04 | 5.42e-03 | 7 |
| GO:00421779 | Breast | Precancer | negative regulation of protein catabolic process | 17/1080 | 121/18723 | 5.76e-04 | 7.28e-03 | 17 |
| GO:0046597 | Breast | Precancer | negative regulation of viral entry into host cell | 6/1080 | 21/18723 | 9.31e-04 | 1.06e-02 | 6 |
| GO:00485255 | Breast | Precancer | negative regulation of viral process | 12/1080 | 92/18723 | 6.51e-03 | 4.51e-02 | 12 |
| GO:001603214 | Breast | IDC | viral process | 75/1434 | 415/18723 | 1.98e-12 | 4.02e-10 | 75 |
| Page: 1 2 3 4 5 6 7 8 9 10 11 12 13 14 15 16 17 18 19 20 21 22 23 24 25 26 27 28 29 30 31 32 33 |
| Pathway ID | Tissue | Disease Stage | Description | Gene Ratio | Bg Ratio | pvalue | p.adjust | qvalue | Count |
| hsa0414416 | Breast | DCIS | Endocytosis | 37/846 | 251/8465 | 9.92e-03 | 4.40e-02 | 3.24e-02 | 37 |
| hsa0414417 | Breast | DCIS | Endocytosis | 37/846 | 251/8465 | 9.92e-03 | 4.40e-02 | 3.24e-02 | 37 |
| hsa0414418 | Cervix | CC | Endocytosis | 64/1267 | 251/8465 | 6.97e-06 | 6.10e-05 | 3.61e-05 | 64 |
| hsa0414419 | Cervix | CC | Endocytosis | 64/1267 | 251/8465 | 6.97e-06 | 6.10e-05 | 3.61e-05 | 64 |
| hsa0414420 | Endometrium | AEH | Endocytosis | 56/1197 | 251/8465 | 2.58e-04 | 2.15e-03 | 1.57e-03 | 56 |
| hsa04144110 | Endometrium | AEH | Endocytosis | 56/1197 | 251/8465 | 2.58e-04 | 2.15e-03 | 1.57e-03 | 56 |
| hsa0414424 | Endometrium | EEC | Endocytosis | 57/1237 | 251/8465 | 3.34e-04 | 2.82e-03 | 2.10e-03 | 57 |
| hsa0414434 | Endometrium | EEC | Endocytosis | 57/1237 | 251/8465 | 3.34e-04 | 2.82e-03 | 2.10e-03 | 57 |
| hsa04144210 | Esophagus | ESCC | Endocytosis | 186/4205 | 251/8465 | 9.74e-16 | 4.66e-14 | 2.39e-14 | 186 |
| hsa0414437 | Esophagus | ESCC | Endocytosis | 186/4205 | 251/8465 | 9.74e-16 | 4.66e-14 | 2.39e-14 | 186 |
| hsa0414412 | Liver | Cirrhotic | Endocytosis | 119/2530 | 251/8465 | 2.33e-09 | 4.56e-08 | 2.81e-08 | 119 |
| hsa0414413 | Liver | Cirrhotic | Endocytosis | 119/2530 | 251/8465 | 2.33e-09 | 4.56e-08 | 2.81e-08 | 119 |
| hsa0414422 | Liver | HCC | Endocytosis | 178/4020 | 251/8465 | 2.03e-14 | 5.22e-13 | 2.91e-13 | 178 |
| hsa0414432 | Liver | HCC | Endocytosis | 178/4020 | 251/8465 | 2.03e-14 | 5.22e-13 | 2.91e-13 | 178 |
| hsa0414427 | Oral cavity | OSCC | Endocytosis | 174/3704 | 251/8465 | 9.42e-17 | 4.51e-15 | 2.29e-15 | 174 |
| hsa04144112 | Oral cavity | OSCC | Endocytosis | 174/3704 | 251/8465 | 9.42e-17 | 4.51e-15 | 2.29e-15 | 174 |
| hsa0414428 | Oral cavity | LP | Endocytosis | 121/2418 | 251/8465 | 1.89e-11 | 3.70e-10 | 2.38e-10 | 121 |
| hsa0414436 | Oral cavity | LP | Endocytosis | 121/2418 | 251/8465 | 1.89e-11 | 3.70e-10 | 2.38e-10 | 121 |
| hsa0414461 | Oral cavity | NEOLP | Endocytosis | 62/1112 | 251/8465 | 3.56e-07 | 4.92e-06 | 3.09e-06 | 62 |
| hsa0414471 | Oral cavity | NEOLP | Endocytosis | 62/1112 | 251/8465 | 3.56e-07 | 4.92e-06 | 3.09e-06 | 62 |
| Page: 1 2 |
Top |
Cell-cell communication analysis |
| Identification of potential cell-cell interactions between two cell types and their ligand-receptor pairs for different disease states |
| Ligand | Receptor | LRpair | Pathway | Tissue | Disease Stage |
| Page: 1 |
Top |
Single-cell gene regulatory network inference analysis |
| Find out the significant the regulons (TFs) and the target genes of each regulon across cell types for different disease states |
| TF | Cell Type | Tissue | Disease Stage | Target Gene | RSS | Regulon Activity |
| ∗The dot plots of a searched regulon are shown for all cell subpopulations in each disease state of each tissue based on the regulon specific score inferred using pySCENIC and by calculating the average expression. |
| Page: 1 |
Top |
Somatic mutation of malignant transformation related genes |
| Annotation of somatic variants for genes involved in malignant transformation |
| Hugo Symbol | Variant Class | Variant Classification | dbSNP RS | HGVSc | HGVSp | HGVSp Short | SWISSPROT | BIOTYPE | SIFT | PolyPhen | Tumor Sample Barcode | Tissue | Histology | Sex | Age | Stage | Therapy Types | Drugs | Outcome |
| SNX3 | SNV | Missense_Mutation | c.134N>T | p.Arg45Leu | p.R45L | O60493 | protein_coding | tolerated(0.1) | probably_damaging(0.944) | TCGA-A2-A0EX-01 | Breast | breast invasive carcinoma | Female | <65 | I/II | Hormone Therapy | tamoxiphen | SD | |
| SNX3 | SNV | Missense_Mutation | c.235A>C | p.Ser79Arg | p.S79R | O60493 | protein_coding | tolerated(0.05) | benign(0.094) | TCGA-A8-A08L-01 | Breast | breast invasive carcinoma | Female | >=65 | III/IV | Unknown | Unknown | SD | |
| SNX3 | SNV | Missense_Mutation | novel | c.61N>A | p.Ala21Thr | p.A21T | O60493 | protein_coding | tolerated(0.13) | possibly_damaging(0.465) | TCGA-LL-A740-01 | Breast | breast invasive carcinoma | Female | <65 | I/II | Chemotherapy | adriamycin | CR |
| SNX3 | insertion | Nonsense_Mutation | novel | c.202_203insAAATGTATTGAG | p.Arg68delinsLysMetTyrTerGly | p.R68delinsKMY*G | O60493 | protein_coding | TCGA-AR-A0U0-01 | Breast | breast invasive carcinoma | Female | >=65 | I/II | Unknown | Unknown | SD | ||
| SNX3 | SNV | Missense_Mutation | c.260N>G | p.Val87Gly | p.V87G | O60493 | protein_coding | deleterious(0) | possibly_damaging(0.58) | TCGA-AD-6895-01 | Colorectum | colon adenocarcinoma | Male | >=65 | III/IV | Unknown | Unknown | SD | |
| SNX3 | SNV | Missense_Mutation | novel | c.353N>T | p.Arg118Ile | p.R118I | O60493 | protein_coding | deleterious(0) | probably_damaging(0.967) | TCGA-AG-A002-01 | Colorectum | rectum adenocarcinoma | Male | <65 | I/II | Unknown | Unknown | SD |
| SNX3 | SNV | Missense_Mutation | c.485N>T | p.Ala162Val | p.A162V | O60493 | protein_coding | tolerated_low_confidence(0.06) | benign(0.001) | TCGA-AP-A051-01 | Endometrium | uterine corpus endometrioid carcinoma | Female | >=65 | I/II | Unknown | Unknown | SD | |
| SNX3 | SNV | Missense_Mutation | c.150N>C | p.Glu50Asp | p.E50D | O60493 | protein_coding | deleterious(0.01) | possibly_damaging(0.555) | TCGA-AP-A0LM-01 | Endometrium | uterine corpus endometrioid carcinoma | Female | <65 | III/IV | Chemotherapy | cisplatin | SD | |
| SNX3 | SNV | Missense_Mutation | novel | c.316N>A | p.Asp106Asn | p.D106N | O60493 | protein_coding | tolerated(0.09) | probably_damaging(0.954) | TCGA-77-7141-01 | Lung | lung squamous cell carcinoma | Male | <65 | I/II | Unknown | Unknown | SD |
| SNX3 | SNV | Missense_Mutation | novel | c.442N>A | p.Glu148Lys | p.E148K | O60493 | protein_coding | tolerated(0.13) | benign(0.005) | TCGA-CR-7390-01 | Oral cavity | head & neck squamous cell carcinoma | Male | >=65 | I/II | Unknown | Unknown | SD |
| Page: 1 2 |
Top |
Related drugs of malignant transformation related genes |
| Identification of chemicals and drugs interact with genes involved in malignant transfromation |
| (DGIdb 4.0) |
| Entrez ID | Symbol | Category | Interaction Types | Drug Claim Name | Drug Name | PMIDs |
| Page: 1 |

Copyright 2023-Present -The University of Texas Health Science Center at Houston |