
|
|||||
|
 | |
| |
| |
| |
| |
| |
|
Gene: SNX29 |
Gene summary for SNX29 |
| Gene information | Species | Human | Gene symbol | SNX29 | Gene ID | 92017 |
| Gene name | sorting nexin 29 | |
| Gene Alias | A-388D4.1 | |
| Cytomap | 16p13.13-p13.12 | |
| Gene Type | protein-coding | GO ID | GO:0003674 | UniProtAcc | Q8TEQ0 |
Top |
Malignant transformation analysis |
| Identification of the aberrant gene expression in precancerous and cancerous lesions by comparing the gene expression of stem-like cells in diseased tissues with normal stem cells |
| Entrez ID | Symbol | Replicates | Species | Organ | Tissue | Adj P-value | Log2FC | Malignancy |
| 92017 | SNX29 | AEH-subject1 | Human | Endometrium | AEH | 5.97e-08 | 3.02e-01 | -0.3059 |
| 92017 | SNX29 | AEH-subject2 | Human | Endometrium | AEH | 1.45e-06 | 3.24e-01 | -0.2525 |
| 92017 | SNX29 | AEH-subject3 | Human | Endometrium | AEH | 2.92e-11 | 3.84e-01 | -0.2576 |
| 92017 | SNX29 | AEH-subject4 | Human | Endometrium | AEH | 4.30e-18 | 5.74e-01 | -0.2657 |
| 92017 | SNX29 | AEH-subject5 | Human | Endometrium | AEH | 9.58e-10 | 3.73e-01 | -0.2953 |
| 92017 | SNX29 | EEC-subject1 | Human | Endometrium | EEC | 1.15e-02 | 2.26e-01 | -0.2682 |
| 92017 | SNX29 | EEC-subject2 | Human | Endometrium | EEC | 2.43e-05 | 3.31e-01 | -0.2607 |
| 92017 | SNX29 | EEC-subject4 | Human | Endometrium | EEC | 3.34e-08 | 3.99e-01 | -0.2571 |
| 92017 | SNX29 | EEC-subject5 | Human | Endometrium | EEC | 5.84e-09 | 3.30e-01 | -0.249 |
| 92017 | SNX29 | GSM6177620_NYU_UCEC1_lib2_lib2 | Human | Endometrium | EEC | 4.68e-02 | -5.02e-02 | -0.1875 |
| 92017 | SNX29 | GSM6177621_NYU_UCEC2_lib1_lib1 | Human | Endometrium | EEC | 3.18e-03 | -6.37e-03 | -0.1934 |
| 92017 | SNX29 | GSM6177622_NYU_UCEC3_lib1_lib1 | Human | Endometrium | EEC | 1.46e-04 | -3.56e-03 | -0.1917 |
| 92017 | SNX29 | LZE4T | Human | Esophagus | ESCC | 3.39e-03 | 1.51e-01 | 0.0811 |
| 92017 | SNX29 | LZE7T | Human | Esophagus | ESCC | 2.29e-02 | 2.39e-01 | 0.0667 |
| 92017 | SNX29 | LZE20T | Human | Esophagus | ESCC | 4.36e-03 | 8.05e-02 | 0.0662 |
| 92017 | SNX29 | LZE21D1 | Human | Esophagus | HGIN | 6.79e-04 | 3.01e-01 | 0.0632 |
| 92017 | SNX29 | LZE22T | Human | Esophagus | ESCC | 3.56e-02 | 2.19e-01 | 0.068 |
| 92017 | SNX29 | LZE24T | Human | Esophagus | ESCC | 4.14e-07 | 1.09e-01 | 0.0596 |
| 92017 | SNX29 | LZE21T | Human | Esophagus | ESCC | 2.32e-06 | 2.82e-01 | 0.0655 |
| 92017 | SNX29 | P1T-E | Human | Esophagus | ESCC | 3.30e-08 | 3.04e-01 | 0.0875 |
| Page: 1 2 3 4 5 6 7 |
| Tissue | Expression Dynamics | Abbreviation |
| Endometrium | 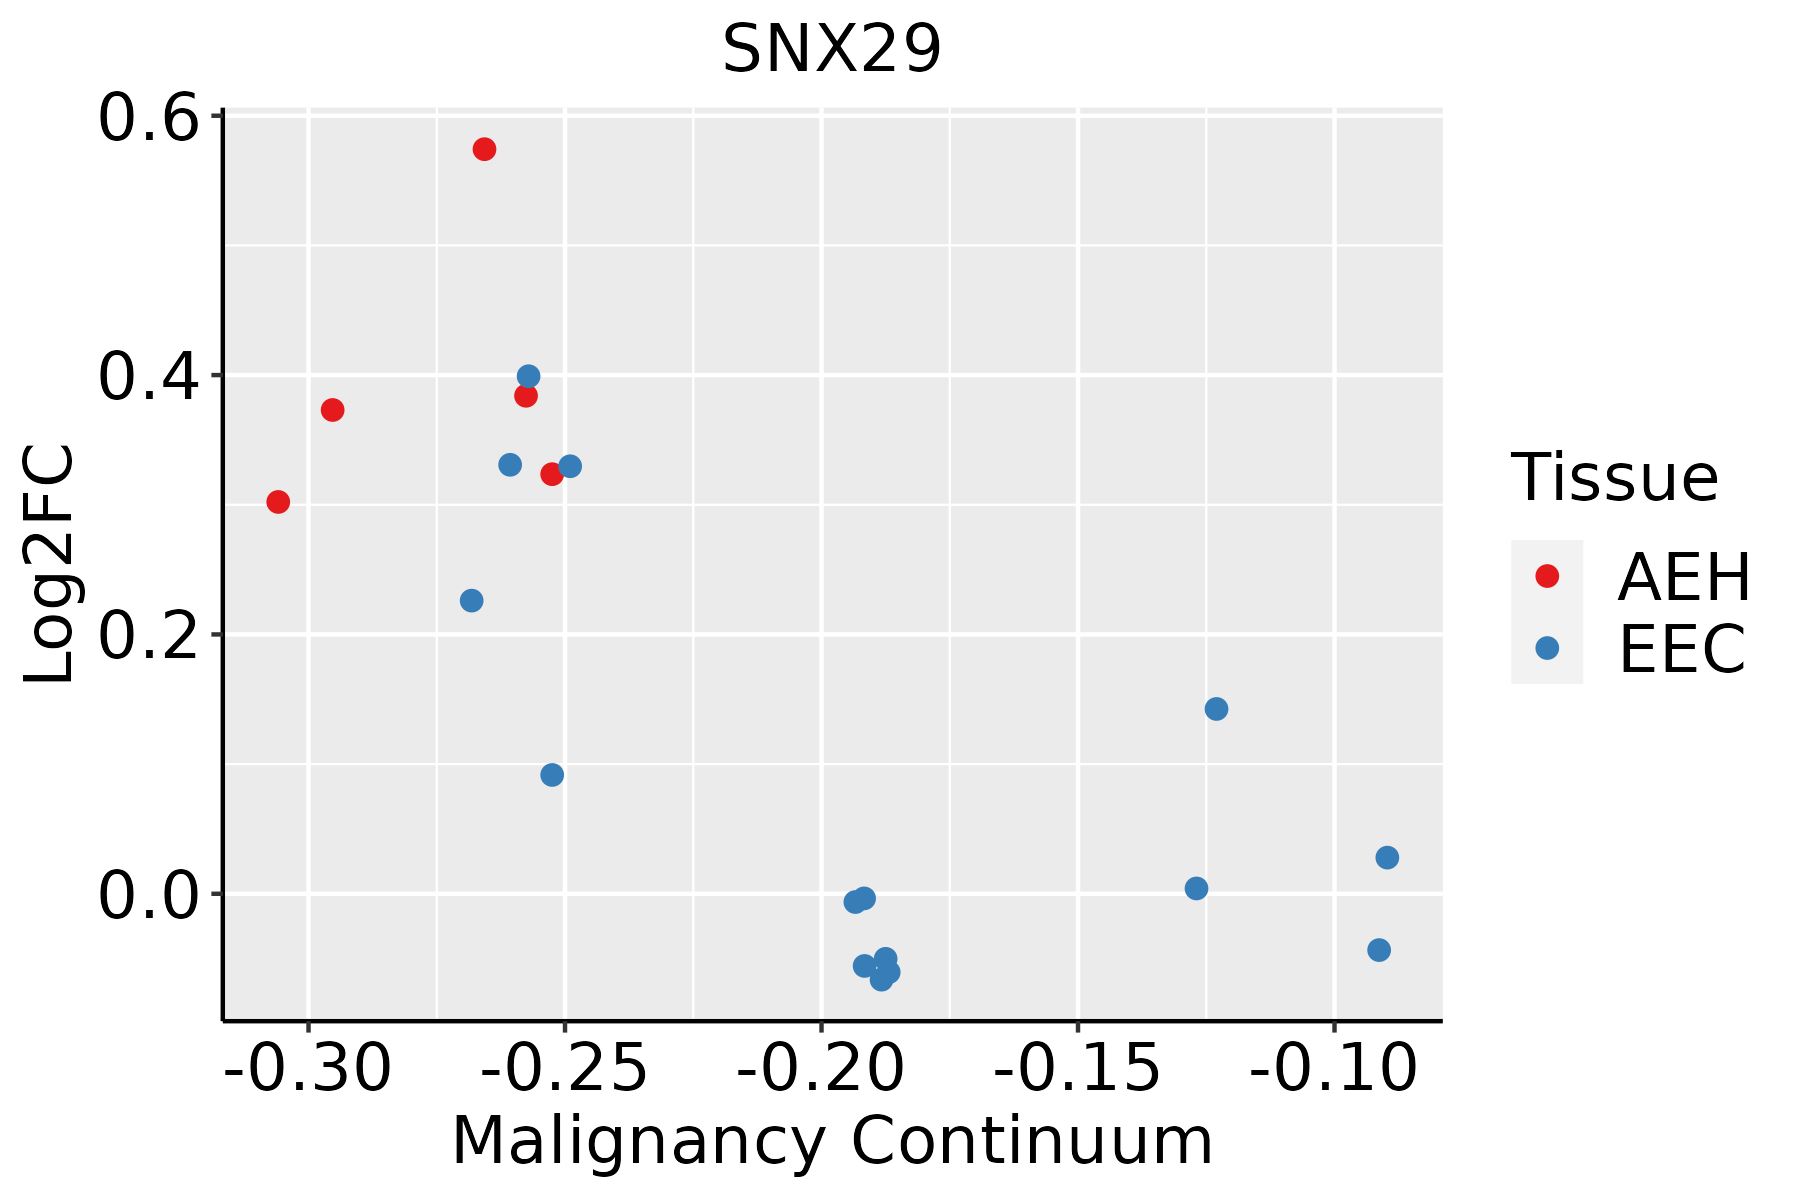 | AEH: Atypical endometrial hyperplasia |
| EEC: Endometrioid Cancer | ||
| Esophagus |  | ESCC: Esophageal squamous cell carcinoma |
| HGIN: High-grade intraepithelial neoplasias | ||
| LGIN: Low-grade intraepithelial neoplasias | ||
| Liver | 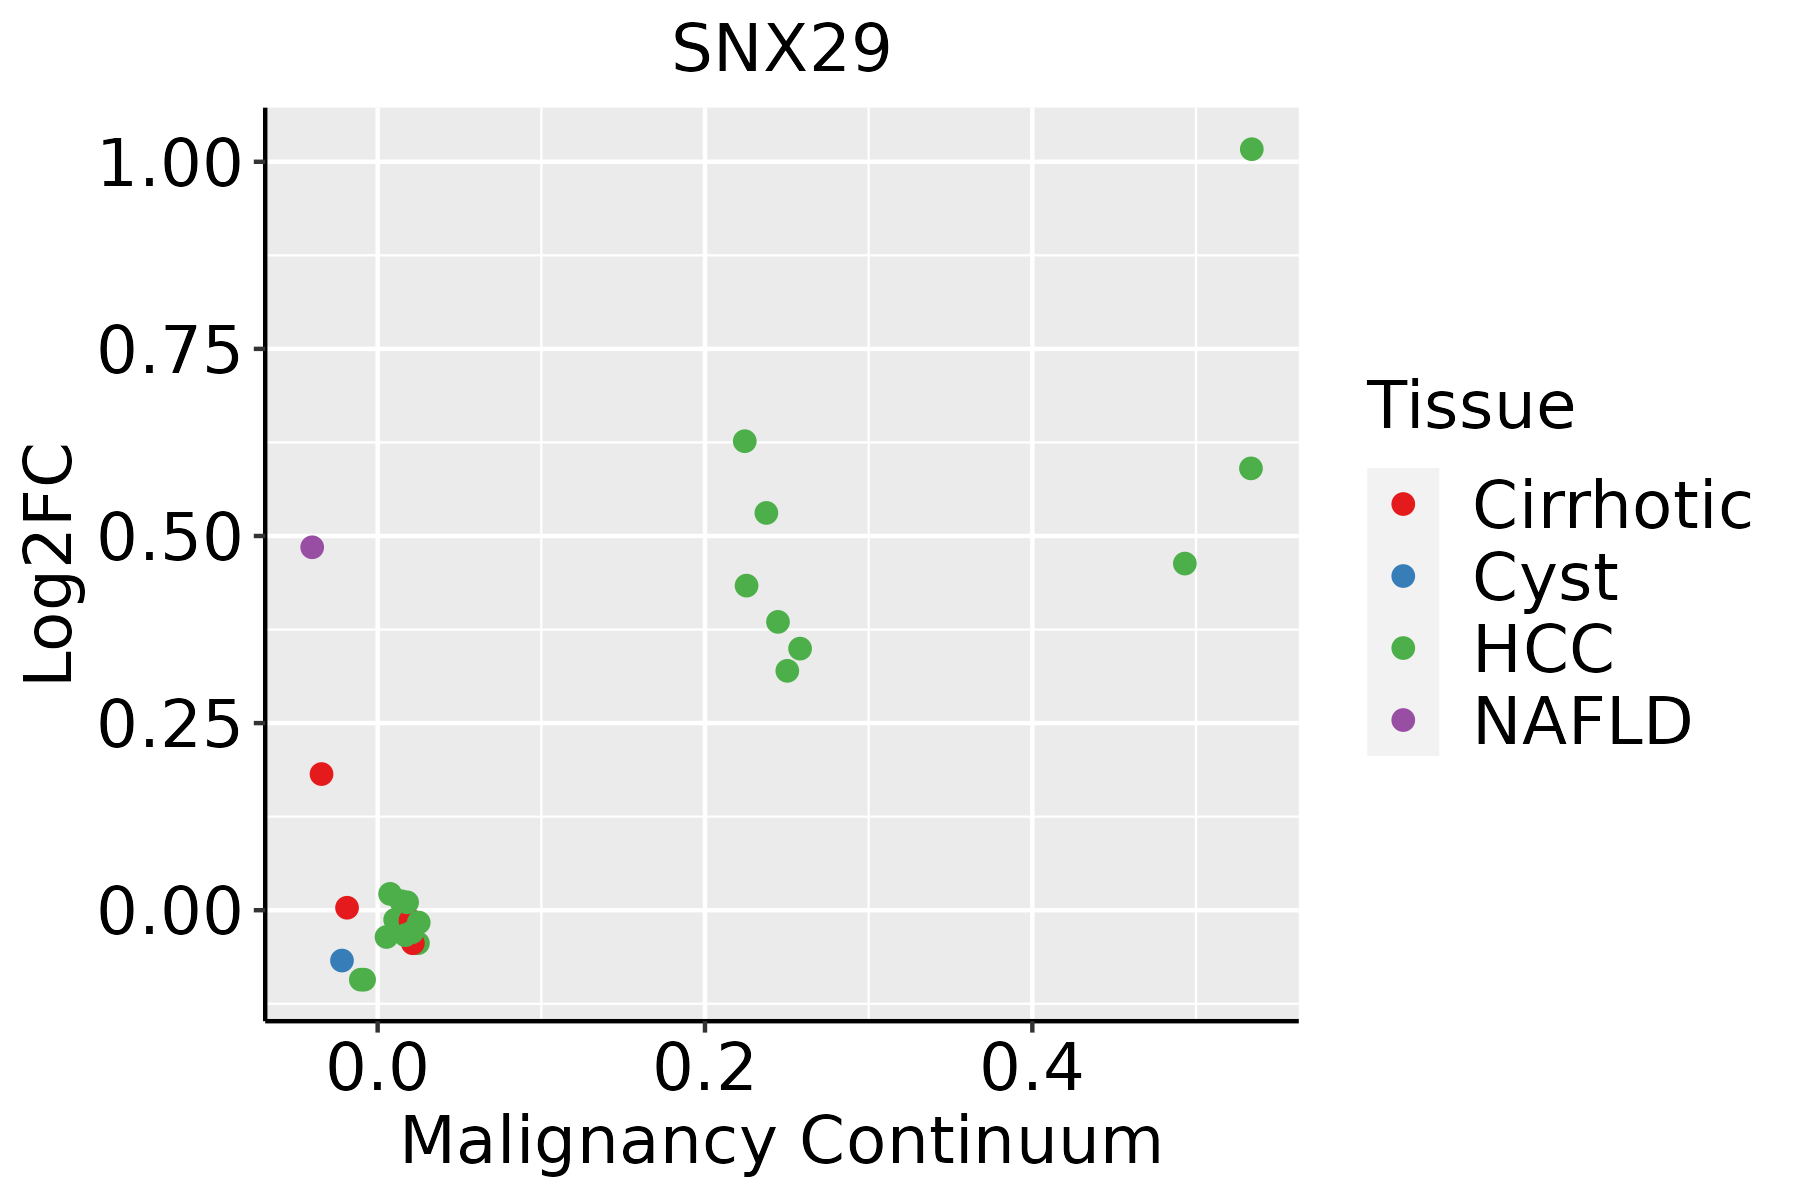 | HCC: Hepatocellular carcinoma |
| NAFLD: Non-alcoholic fatty liver disease | ||
| Lung |  | AAH: Atypical adenomatous hyperplasia |
| AIS: Adenocarcinoma in situ | ||
| IAC: Invasive lung adenocarcinoma | ||
| MIA: Minimally invasive adenocarcinoma | ||
| Oral Cavity | 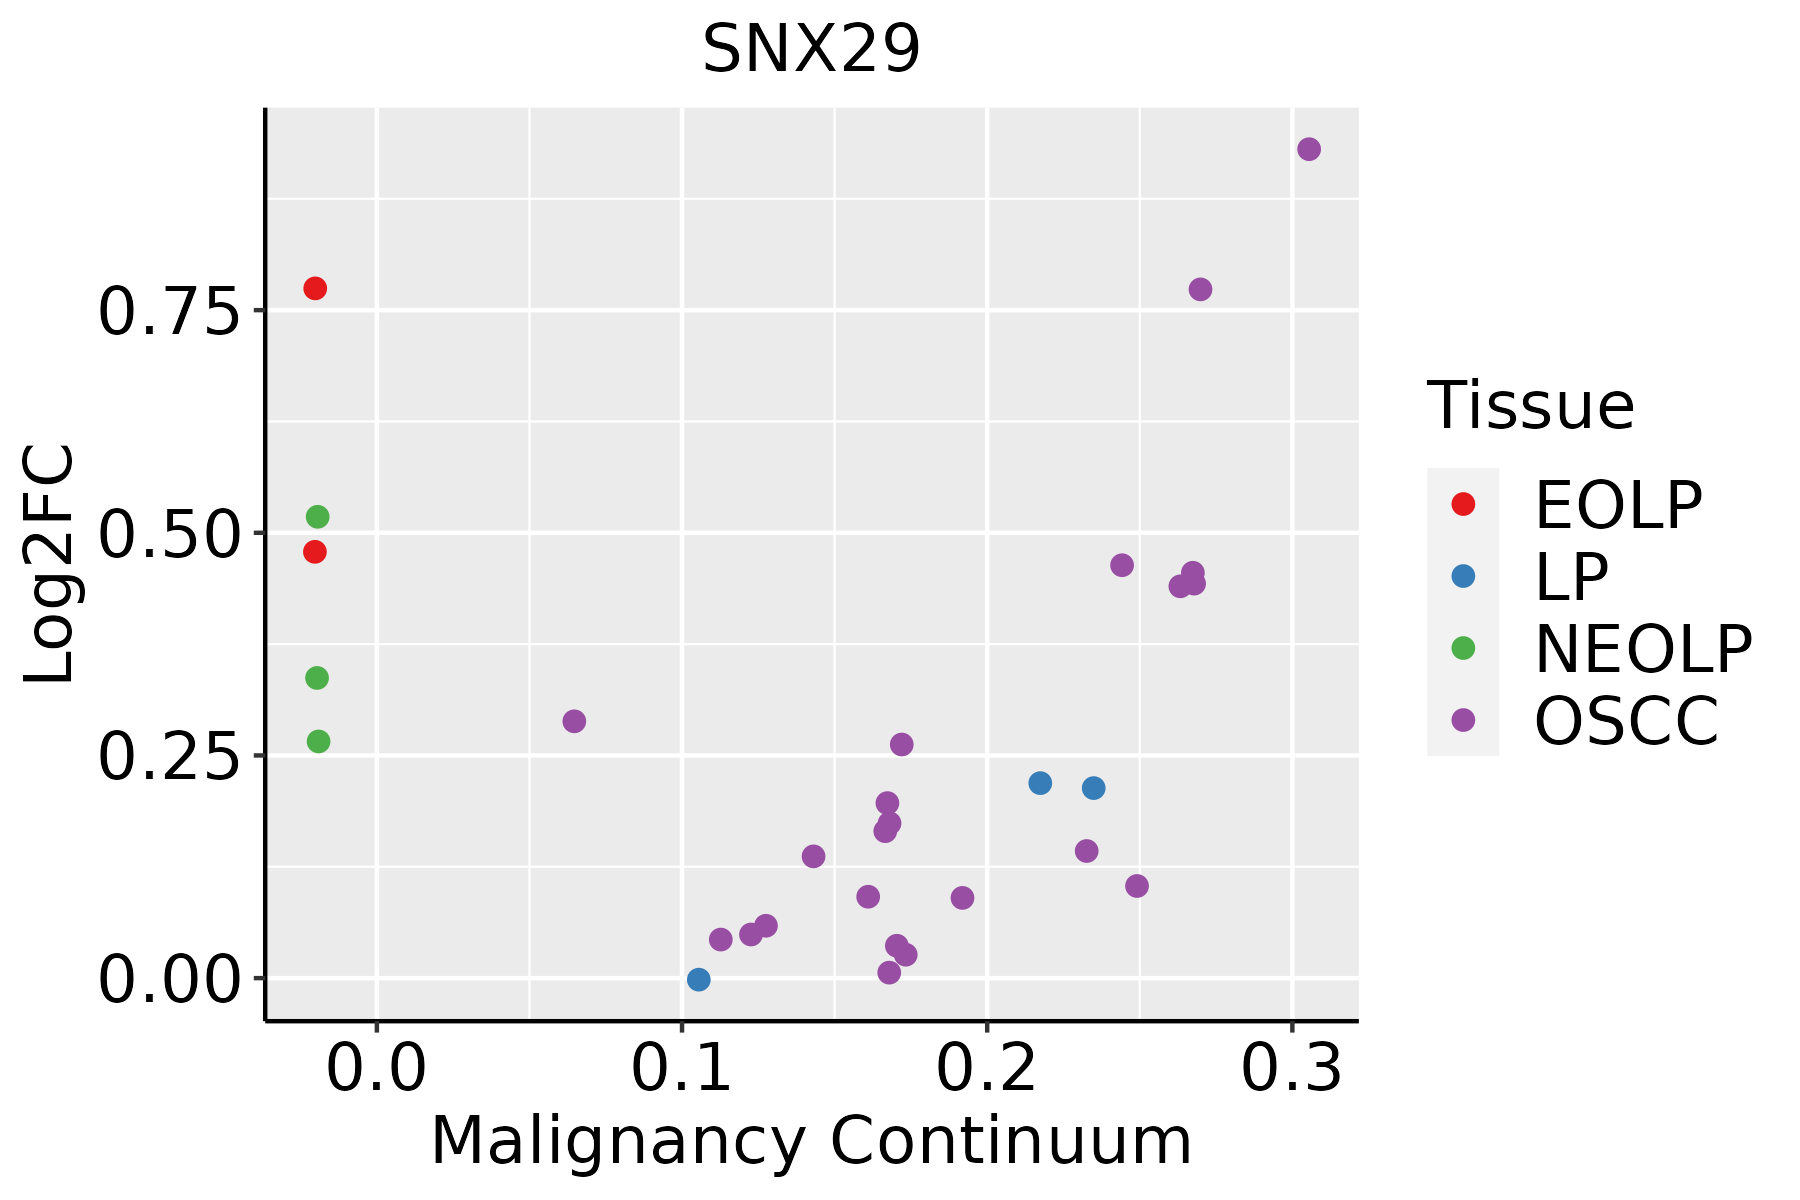 | EOLP: Erosive Oral lichen planus |
| LP: leukoplakia | ||
| NEOLP: Non-erosive oral lichen planus | ||
| OSCC: Oral squamous cell carcinoma | ||
| Thyroid | 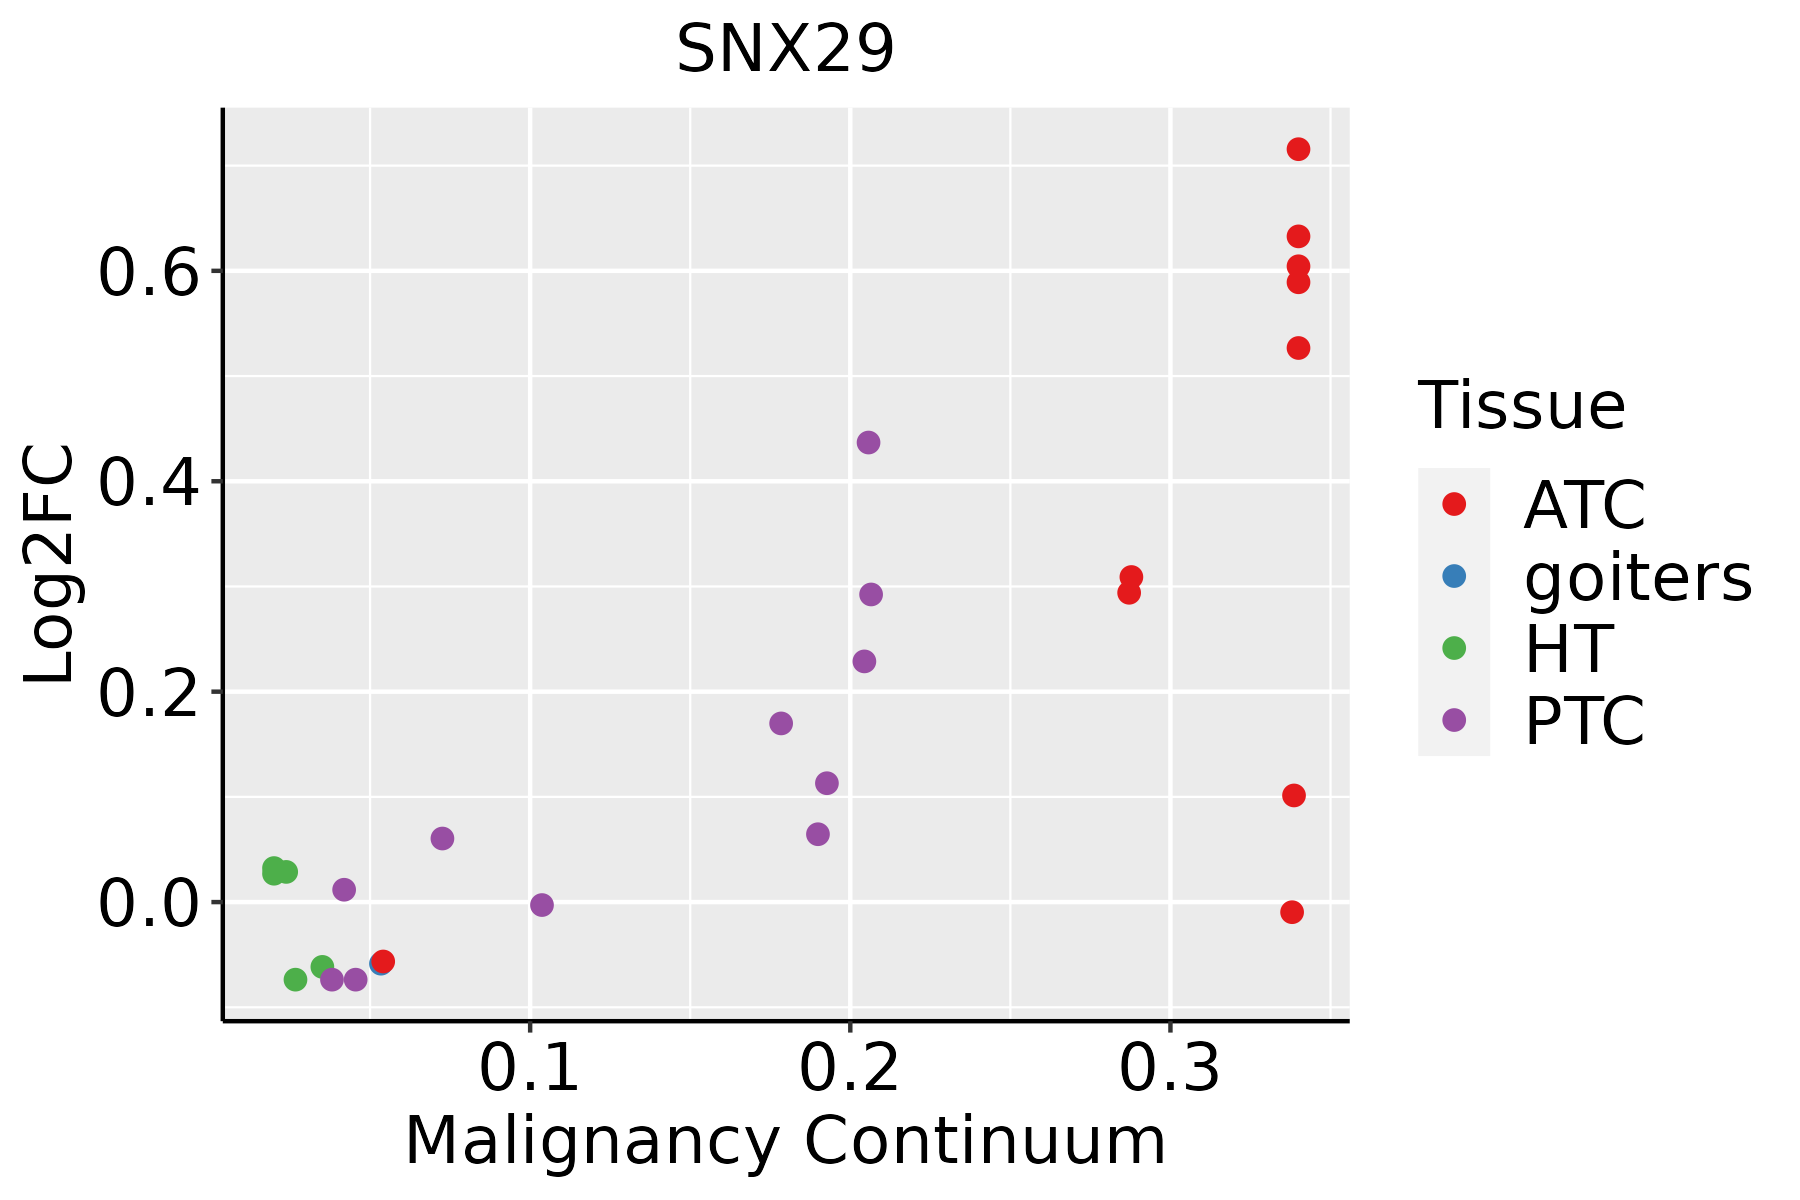 | ATC: Anaplastic thyroid cancer |
| HT: Hashimoto's thyroiditis | ||
| PTC: Papillary thyroid cancer |
| ∗log2FC in expression of this searched gene in stem-like cells from each diseased tissue sample relative to stem-like cells in normal samples in each tissue plotted against the malignancy continuum. Samples are colored based on if they are from different disease stage. |
Top |
Malignant transformation related pathway analysis |
| Find out the enriched GO biological processes and KEGG pathways involved in transition from healthy to precancer to cancer |
| Tissue | Disease Stage | Enriched GO biological Processes |
| Colorectum | AD |  |
| Colorectum | SER |  |
| Colorectum | MSS |  |
| Colorectum | MSI-H |  |
| Colorectum | FAP |  |
| ∗Top 15 enriched GO BP terms are showed in the bar plot of each disease state in each tissue. Each row represents a significant GO biological process which is colored according to the -log10(p.adjust). |
| Page: 1 2 3 4 5 6 7 8 9 |
| GO ID | Tissue | Disease Stage | Description | Gene Ratio | Bg Ratio | pvalue | p.adjust | Count |
| Page: 1 |
| Pathway ID | Tissue | Disease Stage | Description | Gene Ratio | Bg Ratio | pvalue | p.adjust | qvalue | Count |
| Page: 1 |
Top |
Cell-cell communication analysis |
| Identification of potential cell-cell interactions between two cell types and their ligand-receptor pairs for different disease states |
| Ligand | Receptor | LRpair | Pathway | Tissue | Disease Stage |
| Page: 1 |
Top |
Single-cell gene regulatory network inference analysis |
| Find out the significant the regulons (TFs) and the target genes of each regulon across cell types for different disease states |
| TF | Cell Type | Tissue | Disease Stage | Target Gene | RSS | Regulon Activity |
| ∗The dot plots of a searched regulon are shown for all cell subpopulations in each disease state of each tissue based on the regulon specific score inferred using pySCENIC and by calculating the average expression. |
| Page: 1 |
Top |
Somatic mutation of malignant transformation related genes |
| Annotation of somatic variants for genes involved in malignant transformation |
| Hugo Symbol | Variant Class | Variant Classification | dbSNP RS | HGVSc | HGVSp | HGVSp Short | SWISSPROT | BIOTYPE | SIFT | PolyPhen | Tumor Sample Barcode | Tissue | Histology | Sex | Age | Stage | Therapy Types | Drugs | Outcome |
| SNX29 | SNV | Missense_Mutation | c.1313N>A | p.Arg438Gln | p.R438Q | Q8TEQ0 | protein_coding | tolerated(0.92) | benign(0.001) | TCGA-A2-A0CQ-01 | Breast | breast invasive carcinoma | Female | <65 | I/II | Chemotherapy | adriamycin | SD | |
| SNX29 | SNV | Missense_Mutation | c.492G>T | p.Met164Ile | p.M164I | Q8TEQ0 | protein_coding | tolerated(0.09) | probably_damaging(0.914) | TCGA-A8-A07U-01 | Breast | breast invasive carcinoma | Female | >=65 | III/IV | Chemotherapy | 5-fluorouracil | SD | |
| SNX29 | SNV | Missense_Mutation | c.1357N>C | p.Ser453Arg | p.S453R | Q8TEQ0 | protein_coding | tolerated(0.06) | benign(0.052) | TCGA-A8-A08F-01 | Breast | breast invasive carcinoma | Female | <65 | III/IV | Chemotherapy | 5-fluorouracil | CR | |
| SNX29 | SNV | Missense_Mutation | rs755260559 | c.841N>A | p.Val281Met | p.V281M | Q8TEQ0 | protein_coding | tolerated_low_confidence(0.08) | benign(0.172) | TCGA-BH-A0HF-01 | Breast | breast invasive carcinoma | Female | >=65 | I/II | Hormone Therapy | arimidex | SD |
| SNX29 | SNV | Missense_Mutation | novel | c.1126C>G | p.Pro376Ala | p.P376A | Q8TEQ0 | protein_coding | deleterious_low_confidence(0.05) | benign(0.079) | TCGA-D8-A1X6-01 | Breast | breast invasive carcinoma | Female | >=65 | III/IV | Hormone Therapy | tamoxiphen | SD |
| SNX29 | insertion | Nonsense_Mutation | novel | c.1406_1407insACATAGATATAGCCTTATATTCACATAGCACC | p.Leu470HisfsTer9 | p.L470Hfs*9 | Q8TEQ0 | protein_coding | TCGA-A2-A04Y-01 | Breast | breast invasive carcinoma | Female | <65 | I/II | Chemotherapy | cytoxan | SD | ||
| SNX29 | insertion | Nonsense_Mutation | novel | c.2002_2003insTCCCTGCACCAGCCATCCTGGCAGTTCCGCTCCTCTAACCCACTT | p.Arg668delinsLeuProAlaProAlaIleLeuAlaValProLeuLeuTerProThrTrp | p.R668delinsLPAPAILAVPLL*PTW | Q8TEQ0 | protein_coding | TCGA-A2-A0EO-01 | Breast | breast invasive carcinoma | Female | <65 | I/II | Hormone Therapy | tamoxiphen | SD | ||
| SNX29 | insertion | Frame_Shift_Ins | novel | c.658_659insGGTTT | p.Glu220GlyfsTer46 | p.E220Gfs*46 | Q8TEQ0 | protein_coding | TCGA-BH-A0HL-01 | Breast | breast invasive carcinoma | Female | <65 | I/II | Chemotherapy | cyclophosphamide | SD | ||
| SNX29 | deletion | Frame_Shift_Del | novel | c.2393delG | p.Gly798ValfsTer46 | p.G798Vfs*46 | Q8TEQ0 | protein_coding | TCGA-EW-A2FV-01 | Breast | breast invasive carcinoma | Female | <65 | III/IV | Chemotherapy | docetaxel | SD | ||
| SNX29 | SNV | Missense_Mutation | novel | c.893G>A | p.Arg298His | p.R298H | Q8TEQ0 | protein_coding | deleterious_low_confidence(0.03) | possibly_damaging(0.787) | TCGA-2W-A8YY-01 | Cervix | cervical & endocervical cancer | Female | <65 | I/II | Chemotherapy | cisplatin | CR |
| Page: 1 2 3 4 5 6 7 8 9 10 11 |
Top |
Related drugs of malignant transformation related genes |
| Identification of chemicals and drugs interact with genes involved in malignant transfromation |
| (DGIdb 4.0) |
| Entrez ID | Symbol | Category | Interaction Types | Drug Claim Name | Drug Name | PMIDs |
| Page: 1 |

Copyright 2023-Present -The University of Texas Health Science Center at Houston |