
|
|||||
|
 | |
| |
| |
| |
| |
| |
|
Gene: SNX25 |
Gene summary for SNX25 |
| Gene information | Species | Human | Gene symbol | SNX25 | Gene ID | 83891 |
| Gene name | sorting nexin 25 | |
| Gene Alias | MSTP043 | |
| Cytomap | 4q35.1 | |
| Gene Type | protein-coding | GO ID | GO:0001932 | UniProtAcc | Q9H3E2 |
Top |
Malignant transformation analysis |
| Identification of the aberrant gene expression in precancerous and cancerous lesions by comparing the gene expression of stem-like cells in diseased tissues with normal stem cells |
| Entrez ID | Symbol | Replicates | Species | Organ | Tissue | Adj P-value | Log2FC | Malignancy |
| 83891 | SNX25 | TD9 | Human | Lung | IAC | 3.61e-05 | 5.11e-01 | 0.088 |
| 83891 | SNX25 | RNA-P17T-P17T-2 | Human | Lung | IAC | 1.25e-03 | 4.04e-02 | 0.3371 |
| 83891 | SNX25 | RNA-P17T-P17T-6 | Human | Lung | IAC | 1.19e-04 | 1.87e-01 | 0.3385 |
| 83891 | SNX25 | RNA-P17T-P17T-8 | Human | Lung | IAC | 4.86e-05 | 5.07e-02 | 0.3329 |
| 83891 | SNX25 | RNA-P25T1-P25T1-1 | Human | Lung | AIS | 1.22e-13 | 7.53e-01 | -0.2116 |
| 83891 | SNX25 | RNA-P25T1-P25T1-3 | Human | Lung | AIS | 5.86e-09 | 7.14e-01 | -0.2107 |
| 83891 | SNX25 | RNA-P25T1-P25T1-4 | Human | Lung | AIS | 2.24e-20 | 8.92e-01 | -0.2119 |
| 83891 | SNX25 | RNA-P6T1-P6T1-3 | Human | Lung | MIAC | 4.18e-02 | 7.88e-01 | -0.0296 |
| 83891 | SNX25 | RNA-P6T1-P6T1-4 | Human | Lung | MIAC | 2.23e-04 | 6.38e-01 | -0.0263 |
| 83891 | SNX25 | RNA-P6T2-P6T2-1 | Human | Lung | IAC | 1.04e-23 | 8.32e-01 | -0.0166 |
| 83891 | SNX25 | RNA-P6T2-P6T2-2 | Human | Lung | IAC | 9.65e-35 | 9.17e-01 | -0.0132 |
| 83891 | SNX25 | RNA-P6T2-P6T2-3 | Human | Lung | IAC | 2.59e-30 | 8.50e-01 | -0.013 |
| 83891 | SNX25 | RNA-P6T2-P6T2-4 | Human | Lung | IAC | 4.73e-32 | 8.96e-01 | -0.0121 |
| 83891 | SNX25 | RNA-P7T1-P7T1-1 | Human | Lung | AIS | 2.27e-07 | 6.44e-01 | -0.0961 |
| 83891 | SNX25 | RNA-P7T1-P7T1-2 | Human | Lung | AIS | 3.79e-09 | 6.62e-01 | -0.0876 |
| 83891 | SNX25 | RNA-P7T1-P7T1-3 | Human | Lung | AIS | 8.55e-03 | 5.50e-01 | -0.0822 |
| 83891 | SNX25 | RNA-P7T1-P7T1-4 | Human | Lung | AIS | 9.49e-05 | 5.64e-01 | -0.0809 |
| 83891 | SNX25 | male-WTA | Human | Thyroid | PTC | 1.22e-22 | 2.18e-01 | 0.1037 |
| 83891 | SNX25 | PTC01 | Human | Thyroid | PTC | 4.42e-15 | 2.95e-01 | 0.1899 |
| 83891 | SNX25 | PTC03 | Human | Thyroid | PTC | 1.05e-02 | 2.48e-01 | 0.1784 |
| Page: 1 2 |
| Tissue | Expression Dynamics | Abbreviation |
| Lung | 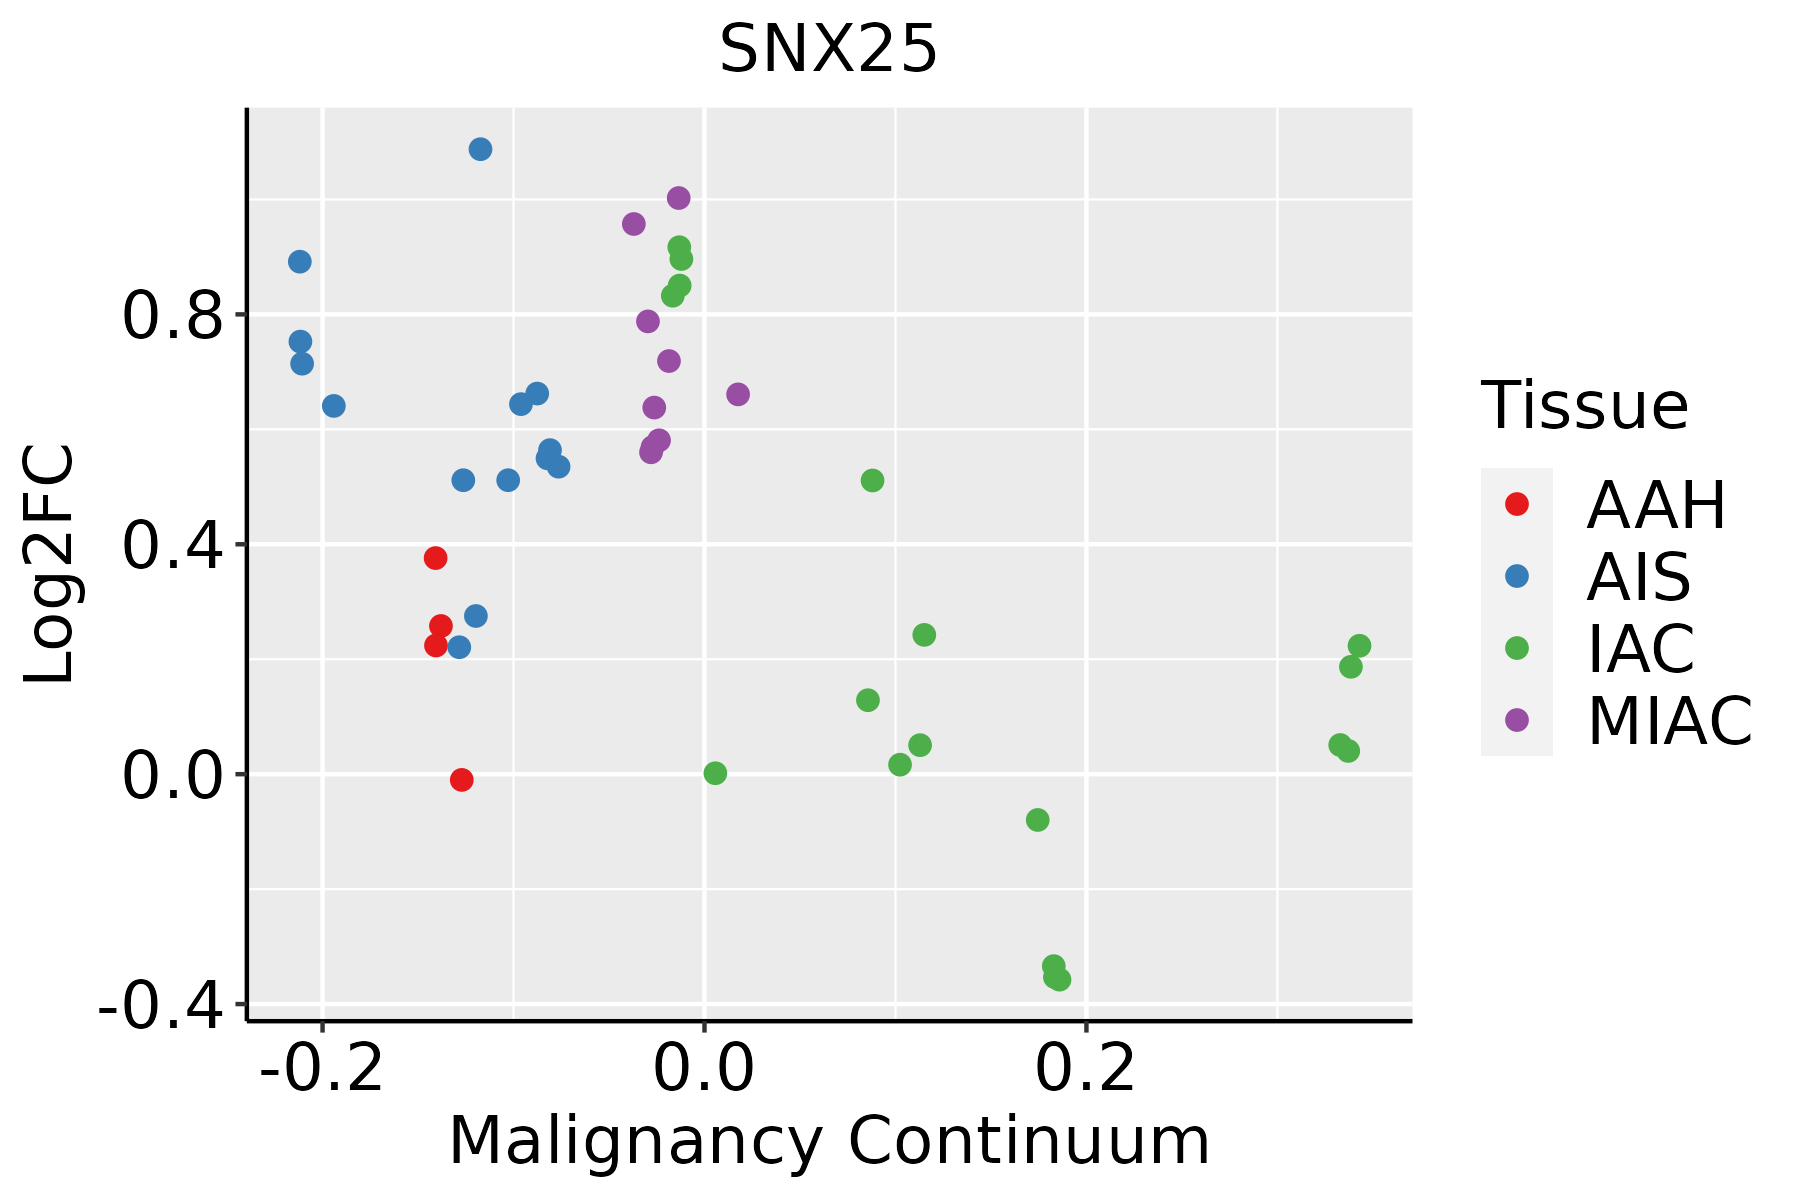 | AAH: Atypical adenomatous hyperplasia |
| AIS: Adenocarcinoma in situ | ||
| IAC: Invasive lung adenocarcinoma | ||
| MIA: Minimally invasive adenocarcinoma | ||
| Thyroid | 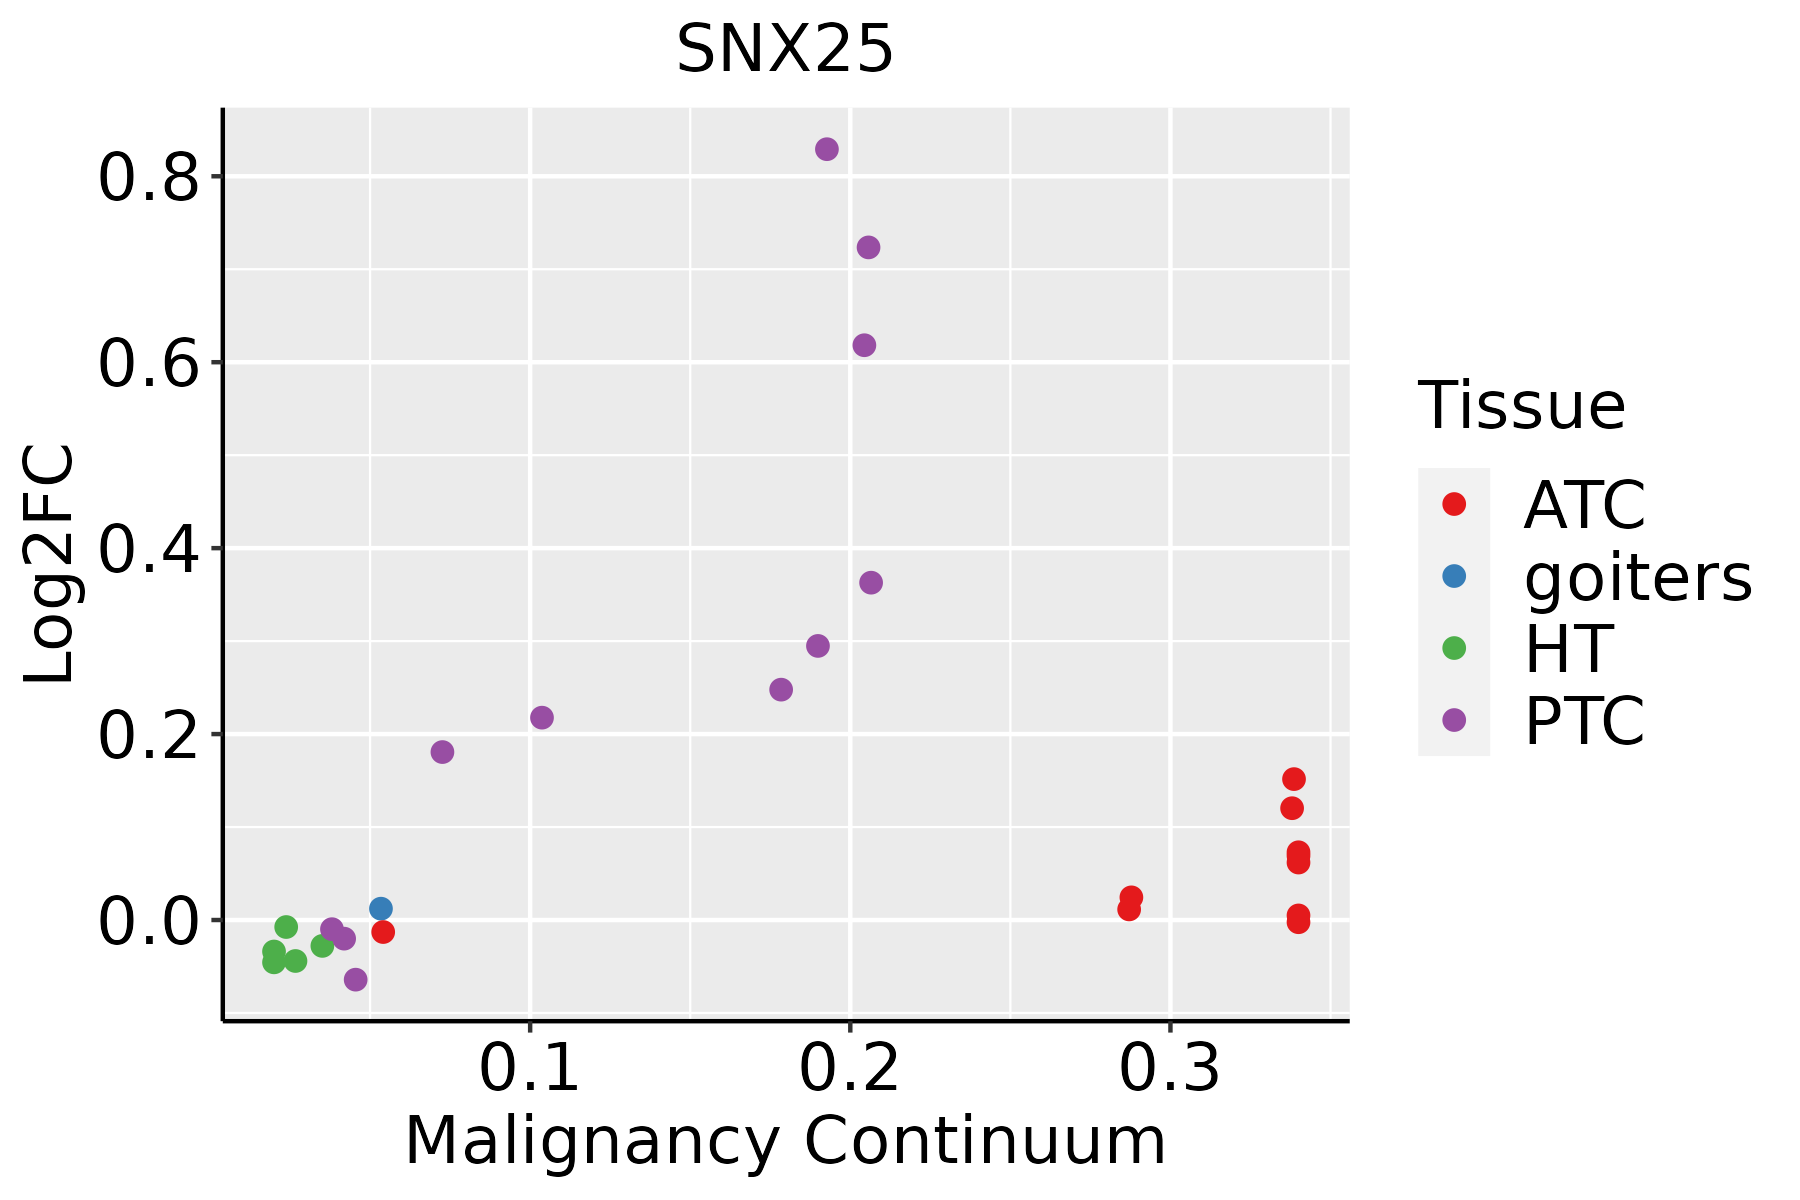 | ATC: Anaplastic thyroid cancer |
| HT: Hashimoto's thyroiditis | ||
| PTC: Papillary thyroid cancer |
| ∗log2FC in expression of this searched gene in stem-like cells from each diseased tissue sample relative to stem-like cells in normal samples in each tissue plotted against the malignancy continuum. Samples are colored based on if they are from different disease stage. |
Top |
Malignant transformation related pathway analysis |
| Find out the enriched GO biological processes and KEGG pathways involved in transition from healthy to precancer to cancer |
| Tissue | Disease Stage | Enriched GO biological Processes |
| Colorectum | AD |  |
| Colorectum | SER |  |
| Colorectum | MSS |  |
| Colorectum | MSI-H |  |
| Colorectum | FAP |  |
| ∗Top 15 enriched GO BP terms are showed in the bar plot of each disease state in each tissue. Each row represents a significant GO biological process which is colored according to the -log10(p.adjust). |
| Page: 1 2 3 4 5 6 7 8 9 |
| GO ID | Tissue | Disease Stage | Description | Gene Ratio | Bg Ratio | pvalue | p.adjust | Count |
| GO:00715594 | Lung | IAC | response to transforming growth factor beta | 60/2061 | 256/18723 | 9.50e-09 | 1.25e-06 | 60 |
| GO:00459368 | Lung | IAC | negative regulation of phosphate metabolic process | 87/2061 | 441/18723 | 4.00e-08 | 4.57e-06 | 87 |
| GO:00105638 | Lung | IAC | negative regulation of phosphorus metabolic process | 87/2061 | 442/18723 | 4.46e-08 | 4.99e-06 | 87 |
| GO:00715604 | Lung | IAC | cellular response to transforming growth factor beta stimulus | 57/2061 | 250/18723 | 6.17e-08 | 6.54e-06 | 57 |
| GO:00423268 | Lung | IAC | negative regulation of phosphorylation | 74/2061 | 385/18723 | 1.15e-06 | 6.18e-05 | 74 |
| GO:00071794 | Lung | IAC | transforming growth factor beta receptor signaling pathway | 45/2061 | 198/18723 | 1.60e-06 | 7.93e-05 | 45 |
| GO:00019338 | Lung | IAC | negative regulation of protein phosphorylation | 66/2061 | 342/18723 | 3.72e-06 | 1.55e-04 | 66 |
| GO:00431125 | Lung | IAC | receptor metabolic process | 36/2061 | 166/18723 | 4.93e-05 | 1.13e-03 | 36 |
| GO:00071785 | Lung | IAC | transmembrane receptor protein serine/threonine kinase signaling pathway | 60/2061 | 355/18723 | 4.82e-04 | 7.03e-03 | 60 |
| GO:19038444 | Lung | IAC | regulation of cellular response to transforming growth factor beta stimulus | 27/2061 | 131/18723 | 9.41e-04 | 1.14e-02 | 27 |
| GO:00170153 | Lung | IAC | regulation of transforming growth factor beta receptor signaling pathway | 26/2061 | 128/18723 | 1.45e-03 | 1.55e-02 | 26 |
| GO:0030512 | Lung | IAC | negative regulation of transforming growth factor beta receptor signaling pathway | 18/2061 | 81/18723 | 2.68e-03 | 2.46e-02 | 18 |
| GO:007155912 | Lung | AIS | response to transforming growth factor beta | 51/1849 | 256/18723 | 8.45e-07 | 6.08e-05 | 51 |
| GO:004593613 | Lung | AIS | negative regulation of phosphate metabolic process | 75/1849 | 441/18723 | 1.93e-06 | 1.12e-04 | 75 |
| GO:001056313 | Lung | AIS | negative regulation of phosphorus metabolic process | 75/1849 | 442/18723 | 2.11e-06 | 1.20e-04 | 75 |
| GO:007156012 | Lung | AIS | cellular response to transforming growth factor beta stimulus | 48/1849 | 250/18723 | 5.13e-06 | 2.47e-04 | 48 |
| GO:004232613 | Lung | AIS | negative regulation of phosphorylation | 65/1849 | 385/18723 | 1.17e-05 | 4.69e-04 | 65 |
| GO:000717912 | Lung | AIS | transforming growth factor beta receptor signaling pathway | 39/1849 | 198/18723 | 2.08e-05 | 7.12e-04 | 39 |
| GO:000193313 | Lung | AIS | negative regulation of protein phosphorylation | 57/1849 | 342/18723 | 5.71e-05 | 1.60e-03 | 57 |
| GO:004311212 | Lung | AIS | receptor metabolic process | 32/1849 | 166/18723 | 1.68e-04 | 3.53e-03 | 32 |
| Page: 1 2 3 4 |
| Pathway ID | Tissue | Disease Stage | Description | Gene Ratio | Bg Ratio | pvalue | p.adjust | qvalue | Count |
| Page: 1 |
Top |
Cell-cell communication analysis |
| Identification of potential cell-cell interactions between two cell types and their ligand-receptor pairs for different disease states |
| Ligand | Receptor | LRpair | Pathway | Tissue | Disease Stage |
| Page: 1 |
Top |
Single-cell gene regulatory network inference analysis |
| Find out the significant the regulons (TFs) and the target genes of each regulon across cell types for different disease states |
| TF | Cell Type | Tissue | Disease Stage | Target Gene | RSS | Regulon Activity |
| ∗The dot plots of a searched regulon are shown for all cell subpopulations in each disease state of each tissue based on the regulon specific score inferred using pySCENIC and by calculating the average expression. |
| Page: 1 |
Top |
Somatic mutation of malignant transformation related genes |
| Annotation of somatic variants for genes involved in malignant transformation |
| Hugo Symbol | Variant Class | Variant Classification | dbSNP RS | HGVSc | HGVSp | HGVSp Short | SWISSPROT | BIOTYPE | SIFT | PolyPhen | Tumor Sample Barcode | Tissue | Histology | Sex | Age | Stage | Therapy Types | Drugs | Outcome |
| SNX25 | SNV | Missense_Mutation | rs754322566 | c.2258N>T | p.Ala753Val | p.A753V | Q9H3E2 | protein_coding | deleterious(0.01) | probably_damaging(0.999) | TCGA-A2-A0CX-01 | Breast | breast invasive carcinoma | Female | <65 | I/II | Chemotherapy | adriamycin | SD |
| SNX25 | SNV | Missense_Mutation | c.157G>A | p.Val53Met | p.V53M | Q9H3E2 | protein_coding | deleterious(0.03) | benign(0.074) | TCGA-A2-A0YJ-01 | Breast | breast invasive carcinoma | Female | <65 | III/IV | Chemotherapy | cytoxan | PD | |
| SNX25 | SNV | Missense_Mutation | novel | c.2029N>G | p.Arg677Gly | p.R677G | Q9H3E2 | protein_coding | deleterious(0.01) | benign(0.045) | TCGA-A2-A1FW-01 | Breast | breast invasive carcinoma | Female | <65 | III/IV | Chemotherapy | cytoxan | SD |
| SNX25 | SNV | Missense_Mutation | c.2170N>A | p.Asp724Asn | p.D724N | Q9H3E2 | protein_coding | deleterious(0) | probably_damaging(0.999) | TCGA-AN-A0AK-01 | Breast | breast invasive carcinoma | Female | >=65 | I/II | Unknown | Unknown | SD | |
| SNX25 | SNV | Missense_Mutation | c.530N>T | p.Ala177Val | p.A177V | Q9H3E2 | protein_coding | deleterious(0) | possibly_damaging(0.449) | TCGA-AR-A1AP-01 | Breast | breast invasive carcinoma | Female | >=65 | I/II | Hormone Therapy | anastrozole | SD | |
| SNX25 | SNV | Missense_Mutation | c.574G>A | p.Asp192Asn | p.D192N | Q9H3E2 | protein_coding | deleterious(0.01) | benign(0.11) | TCGA-BH-A0BV-01 | Breast | breast invasive carcinoma | Female | >=65 | I/II | Chemotherapy | doxorubicin | SD | |
| SNX25 | SNV | Missense_Mutation | c.2043N>T | p.Leu681Phe | p.L681F | Q9H3E2 | protein_coding | deleterious(0.01) | possibly_damaging(0.647) | TCGA-E9-A1NA-01 | Breast | breast invasive carcinoma | Female | <65 | I/II | Chemotherapy | cyclophosphamide | SD | |
| SNX25 | insertion | Frame_Shift_Ins | novel | c.2256_2257insTATATATATAGAATCTGTCTAATGACTAACGAAATGGGGTTGT | p.Ala753TyrfsTer39 | p.A753Yfs*39 | Q9H3E2 | protein_coding | TCGA-A2-A0CX-01 | Breast | breast invasive carcinoma | Female | <65 | I/II | Chemotherapy | adriamycin | SD | ||
| SNX25 | SNV | Missense_Mutation | rs779242791 | c.629C>T | p.Ala210Val | p.A210V | Q9H3E2 | protein_coding | deleterious(0.03) | probably_damaging(0.994) | TCGA-2W-A8YY-01 | Cervix | cervical & endocervical cancer | Female | <65 | I/II | Chemotherapy | cisplatin | CR |
| SNX25 | SNV | Missense_Mutation | c.1216N>C | p.Glu406Gln | p.E406Q | Q9H3E2 | protein_coding | tolerated(0.15) | benign(0.003) | TCGA-IR-A3LH-01 | Cervix | cervical & endocervical cancer | Female | <65 | I/II | Chemotherapy | cisplatin | CR |
| Page: 1 2 3 4 5 6 7 8 9 10 11 12 13 14 |
Top |
Related drugs of malignant transformation related genes |
| Identification of chemicals and drugs interact with genes involved in malignant transfromation |
| (DGIdb 4.0) |
| Entrez ID | Symbol | Category | Interaction Types | Drug Claim Name | Drug Name | PMIDs |
| Page: 1 |

Copyright 2023-Present -The University of Texas Health Science Center at Houston |