
|
|||||
|
 | |
| |
| |
| |
| |
| |
|
Gene: SNX21 |
Gene summary for SNX21 |
| Gene information | Species | Human | Gene symbol | SNX21 | Gene ID | 90203 |
| Gene name | sorting nexin family member 21 | |
| Gene Alias | C20orf161 | |
| Cytomap | 20q13.12 | |
| Gene Type | protein-coding | GO ID | GO:0006810 | UniProtAcc | Q05DJ0 |
Top |
Malignant transformation analysis |
| Identification of the aberrant gene expression in precancerous and cancerous lesions by comparing the gene expression of stem-like cells in diseased tissues with normal stem cells |
| Entrez ID | Symbol | Replicates | Species | Organ | Tissue | Adj P-value | Log2FC | Malignancy |
| 90203 | SNX21 | LZE24T | Human | Esophagus | ESCC | 8.65e-05 | 1.83e-01 | 0.0596 |
| 90203 | SNX21 | P1T-E | Human | Esophagus | ESCC | 7.73e-06 | 3.59e-01 | 0.0875 |
| 90203 | SNX21 | P2T-E | Human | Esophagus | ESCC | 1.16e-02 | 9.48e-02 | 0.1177 |
| 90203 | SNX21 | P4T-E | Human | Esophagus | ESCC | 1.59e-05 | 1.87e-01 | 0.1323 |
| 90203 | SNX21 | P5T-E | Human | Esophagus | ESCC | 3.60e-04 | 1.43e-01 | 0.1327 |
| 90203 | SNX21 | P8T-E | Human | Esophagus | ESCC | 6.06e-07 | 1.15e-01 | 0.0889 |
| 90203 | SNX21 | P9T-E | Human | Esophagus | ESCC | 6.39e-08 | 2.18e-01 | 0.1131 |
| 90203 | SNX21 | P10T-E | Human | Esophagus | ESCC | 1.90e-13 | 1.80e-01 | 0.116 |
| 90203 | SNX21 | P11T-E | Human | Esophagus | ESCC | 4.02e-04 | 2.85e-01 | 0.1426 |
| 90203 | SNX21 | P12T-E | Human | Esophagus | ESCC | 2.69e-09 | 2.29e-01 | 0.1122 |
| 90203 | SNX21 | P16T-E | Human | Esophagus | ESCC | 6.10e-14 | 2.68e-01 | 0.1153 |
| 90203 | SNX21 | P17T-E | Human | Esophagus | ESCC | 5.68e-05 | 2.62e-01 | 0.1278 |
| 90203 | SNX21 | P20T-E | Human | Esophagus | ESCC | 6.43e-10 | 2.56e-01 | 0.1124 |
| 90203 | SNX21 | P21T-E | Human | Esophagus | ESCC | 4.40e-31 | 6.19e-01 | 0.1617 |
| 90203 | SNX21 | P22T-E | Human | Esophagus | ESCC | 6.33e-12 | 2.07e-01 | 0.1236 |
| 90203 | SNX21 | P23T-E | Human | Esophagus | ESCC | 1.52e-08 | 2.61e-01 | 0.108 |
| 90203 | SNX21 | P24T-E | Human | Esophagus | ESCC | 6.34e-10 | 1.94e-01 | 0.1287 |
| 90203 | SNX21 | P26T-E | Human | Esophagus | ESCC | 1.95e-16 | 2.91e-01 | 0.1276 |
| 90203 | SNX21 | P27T-E | Human | Esophagus | ESCC | 1.53e-05 | 1.19e-01 | 0.1055 |
| 90203 | SNX21 | P28T-E | Human | Esophagus | ESCC | 3.66e-05 | 1.48e-01 | 0.1149 |
| Page: 1 2 3 4 |
| Tissue | Expression Dynamics | Abbreviation |
| Esophagus | 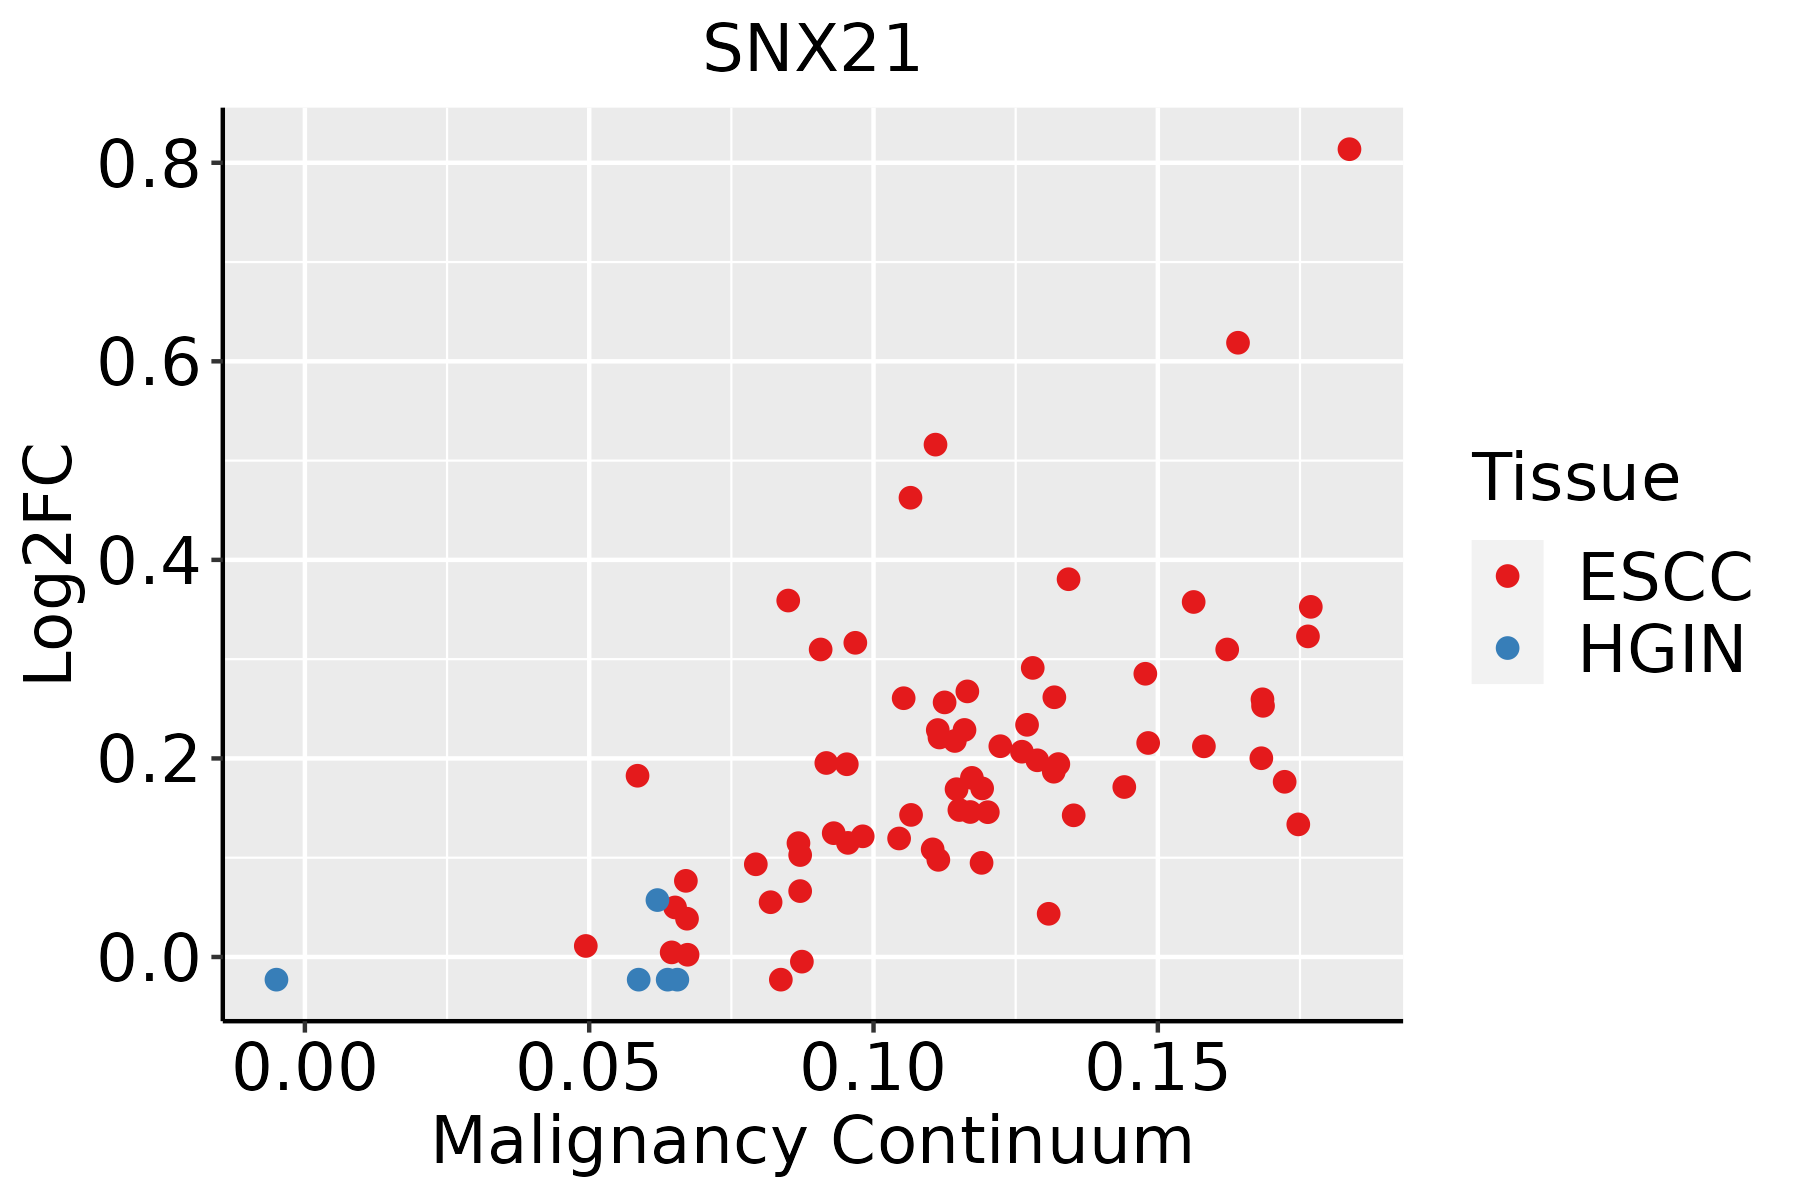 | ESCC: Esophageal squamous cell carcinoma |
| HGIN: High-grade intraepithelial neoplasias | ||
| LGIN: Low-grade intraepithelial neoplasias | ||
| Thyroid | 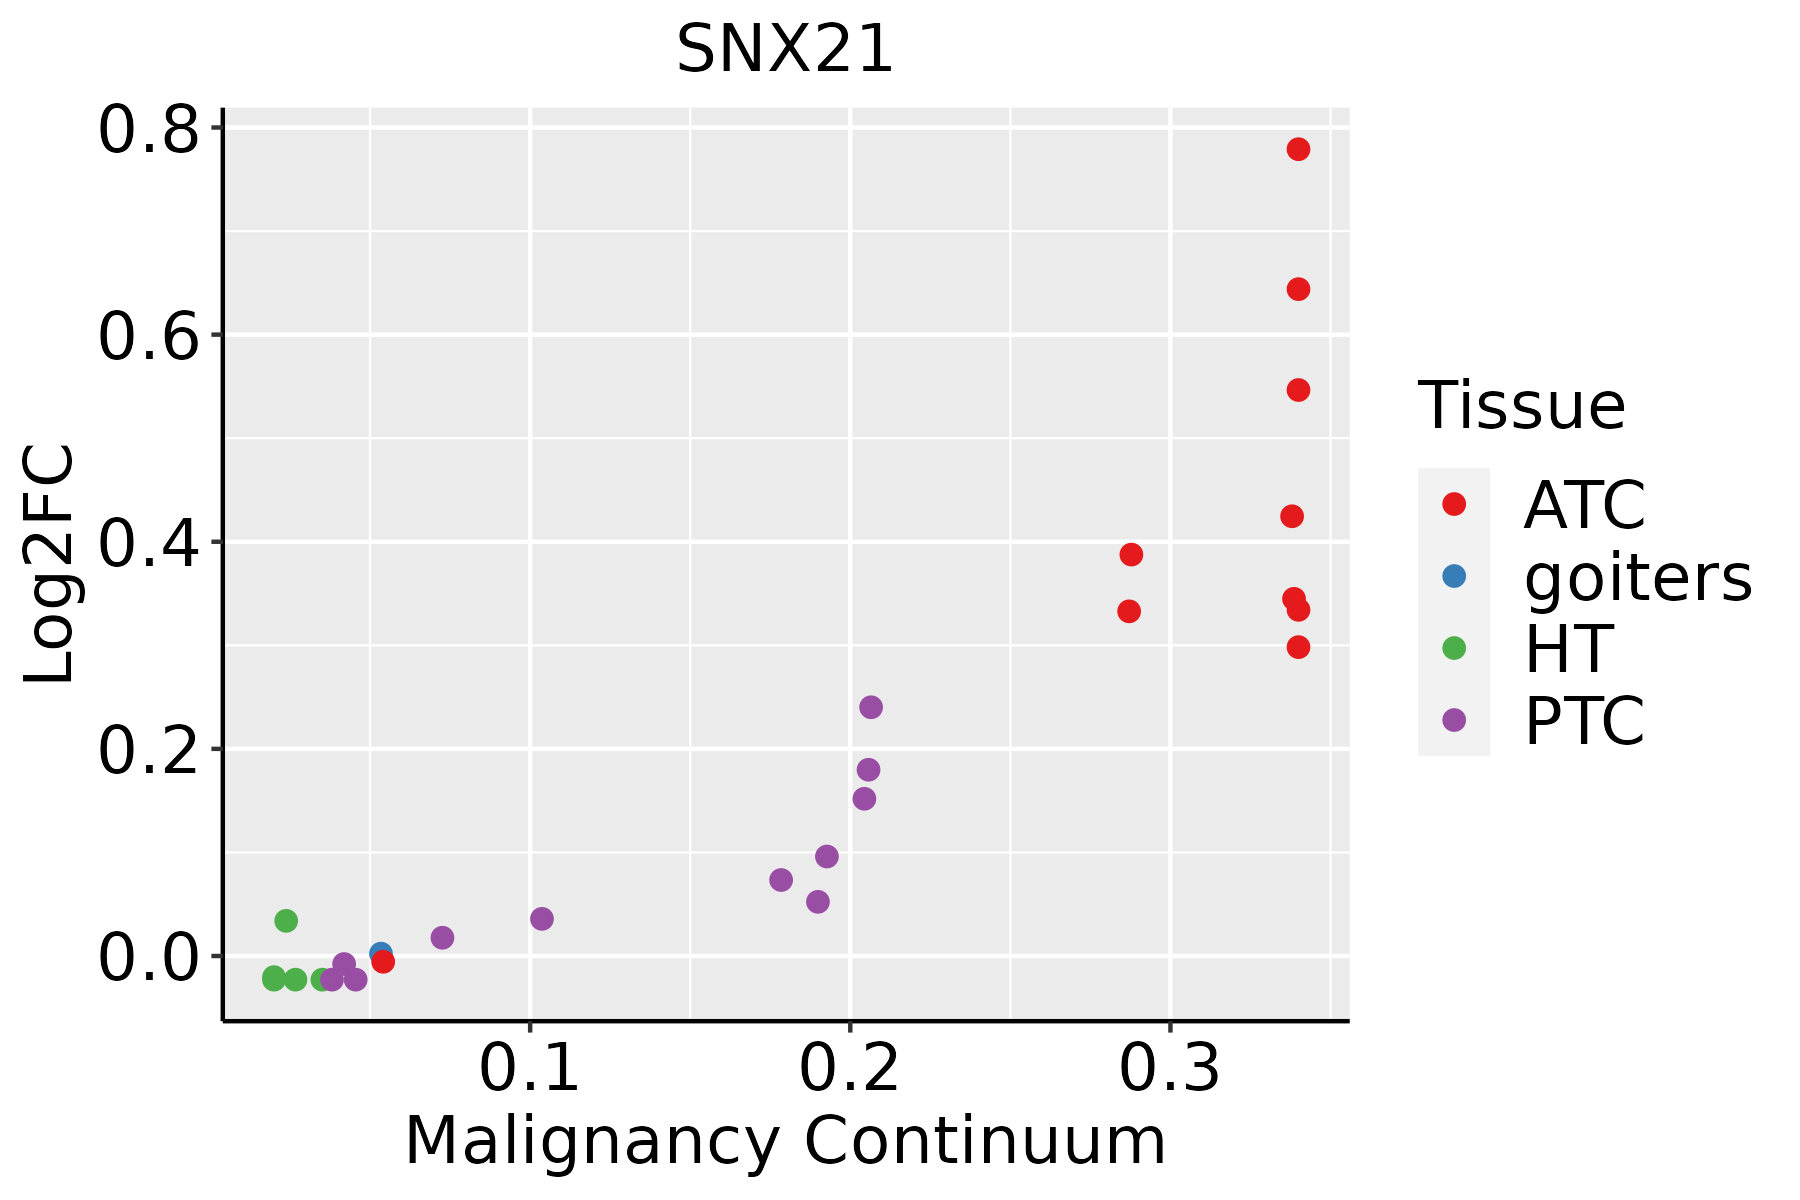 | ATC: Anaplastic thyroid cancer |
| HT: Hashimoto's thyroiditis | ||
| PTC: Papillary thyroid cancer |
| ∗log2FC in expression of this searched gene in stem-like cells from each diseased tissue sample relative to stem-like cells in normal samples in each tissue plotted against the malignancy continuum. Samples are colored based on if they are from different disease stage. |
Top |
Malignant transformation related pathway analysis |
| Find out the enriched GO biological processes and KEGG pathways involved in transition from healthy to precancer to cancer |
| Tissue | Disease Stage | Enriched GO biological Processes |
| Colorectum | AD |  |
| Colorectum | SER |  |
| Colorectum | MSS |  |
| Colorectum | MSI-H |  |
| Colorectum | FAP |  |
| ∗Top 15 enriched GO BP terms are showed in the bar plot of each disease state in each tissue. Each row represents a significant GO biological process which is colored according to the -log10(p.adjust). |
| Page: 1 2 3 4 5 6 7 8 9 |
| GO ID | Tissue | Disease Stage | Description | Gene Ratio | Bg Ratio | pvalue | p.adjust | Count |
| Page: 1 |
| Pathway ID | Tissue | Disease Stage | Description | Gene Ratio | Bg Ratio | pvalue | p.adjust | qvalue | Count |
| Page: 1 |
Top |
Cell-cell communication analysis |
| Identification of potential cell-cell interactions between two cell types and their ligand-receptor pairs for different disease states |
| Ligand | Receptor | LRpair | Pathway | Tissue | Disease Stage |
| Page: 1 |
Top |
Single-cell gene regulatory network inference analysis |
| Find out the significant the regulons (TFs) and the target genes of each regulon across cell types for different disease states |
| TF | Cell Type | Tissue | Disease Stage | Target Gene | RSS | Regulon Activity |
| ∗The dot plots of a searched regulon are shown for all cell subpopulations in each disease state of each tissue based on the regulon specific score inferred using pySCENIC and by calculating the average expression. |
| Page: 1 |
Top |
Somatic mutation of malignant transformation related genes |
| Annotation of somatic variants for genes involved in malignant transformation |
| Hugo Symbol | Variant Class | Variant Classification | dbSNP RS | HGVSc | HGVSp | HGVSp Short | SWISSPROT | BIOTYPE | SIFT | PolyPhen | Tumor Sample Barcode | Tissue | Histology | Sex | Age | Stage | Therapy Types | Drugs | Outcome |
| SNX21 | SNV | Missense_Mutation | novel | c.775N>C | p.Ala259Pro | p.A259P | Q969T3 | protein_coding | deleterious(0) | probably_damaging(0.996) | TCGA-AN-A0AS-01 | Breast | breast invasive carcinoma | Female | >=65 | III/IV | Unknown | Unknown | SD |
| SNX21 | insertion | Frame_Shift_Ins | novel | c.394_395insAGGCATTAAATGTACAGGGCTTGGGATCCGAATGGAAA | p.Leu132GlnfsTer17 | p.L132Qfs*17 | Q969T3 | protein_coding | TCGA-A2-A0CX-01 | Breast | breast invasive carcinoma | Female | <65 | I/II | Chemotherapy | adriamycin | SD | ||
| SNX21 | insertion | In_Frame_Ins | novel | c.776_777insCCAAGAGAT | p.Ala259_Leu260insGlnGluIle | p.A259_L260insQEI | Q969T3 | protein_coding | TCGA-AN-A0AS-01 | Breast | breast invasive carcinoma | Female | >=65 | III/IV | Unknown | Unknown | SD | ||
| SNX21 | SNV | Missense_Mutation | novel | c.883N>A | p.Glu295Lys | p.E295K | Q969T3 | protein_coding | deleterious(0.01) | possibly_damaging(0.824) | TCGA-EK-A2RM-01 | Cervix | cervical & endocervical cancer | Female | <65 | I/II | Unknown | Unknown | SD |
| SNX21 | SNV | Missense_Mutation | novel | c.310N>A | p.Gly104Arg | p.G104R | Q969T3 | protein_coding | tolerated(0.14) | possibly_damaging(0.648) | TCGA-VS-A94X-01 | Cervix | cervical & endocervical cancer | Female | <65 | I/II | Chemotherapy | cisplatin | PD |
| SNX21 | SNV | Missense_Mutation | rs551089787 | c.733N>T | p.Arg245Trp | p.R245W | Q969T3 | protein_coding | deleterious(0) | benign(0.432) | TCGA-A6-5661-01 | Colorectum | colon adenocarcinoma | Female | >=65 | I/II | Unknown | Unknown | SD |
| SNX21 | SNV | Missense_Mutation | rs540824262 | c.1004N>A | p.Arg335His | p.R335H | Q969T3 | protein_coding | tolerated(0.07) | benign(0) | TCGA-AA-3492-01 | Colorectum | colon adenocarcinoma | Female | >=65 | I/II | Unknown | Unknown | SD |
| SNX21 | SNV | Missense_Mutation | rs757547645 | c.415N>G | p.Asn139Asp | p.N139D | Q969T3 | protein_coding | deleterious(0.01) | possibly_damaging(0.446) | TCGA-AA-3715-01 | Colorectum | colon adenocarcinoma | Male | >=65 | I/II | Unknown | Unknown | PD |
| SNX21 | SNV | Missense_Mutation | rs781201010 | c.463N>A | p.Val155Met | p.V155M | Q969T3 | protein_coding | deleterious(0.01) | possibly_damaging(0.781) | TCGA-AA-3949-01 | Colorectum | colon adenocarcinoma | Female | >=65 | III/IV | Unknown | Unknown | SD |
| SNX21 | SNV | Missense_Mutation | rs201926135 | c.539N>A | p.Arg180Gln | p.R180Q | Q969T3 | protein_coding | tolerated(0.45) | possibly_damaging(0.488) | TCGA-CA-6717-01 | Colorectum | colon adenocarcinoma | Male | <65 | I/II | Chemotherapy | oxaliplatin | CR |
| Page: 1 2 3 4 |
Top |
Related drugs of malignant transformation related genes |
| Identification of chemicals and drugs interact with genes involved in malignant transfromation |
| (DGIdb 4.0) |
| Entrez ID | Symbol | Category | Interaction Types | Drug Claim Name | Drug Name | PMIDs |
| Page: 1 |

Copyright 2023-Present -The University of Texas Health Science Center at Houston |