
|
|||||
|
 | |
| |
| |
| |
| |
| |
|
Gene: SNX18 |
Gene summary for SNX18 |
| Gene information | Species | Human | Gene symbol | SNX18 | Gene ID | 112574 |
| Gene name | sorting nexin 18 | |
| Gene Alias | SH3PX2 | |
| Cytomap | 5q11.2 | |
| Gene Type | protein-coding | GO ID | GO:0000278 | UniProtAcc | Q96RF0 |
Top |
Malignant transformation analysis |
| Identification of the aberrant gene expression in precancerous and cancerous lesions by comparing the gene expression of stem-like cells in diseased tissues with normal stem cells |
| Entrez ID | Symbol | Replicates | Species | Organ | Tissue | Adj P-value | Log2FC | Malignancy |
| 112574 | SNX18 | LZE24T | Human | Esophagus | ESCC | 2.48e-12 | 3.84e-01 | 0.0596 |
| 112574 | SNX18 | P1T-E | Human | Esophagus | ESCC | 2.40e-06 | 6.28e-01 | 0.0875 |
| 112574 | SNX18 | P2T-E | Human | Esophagus | ESCC | 9.36e-19 | 3.36e-01 | 0.1177 |
| 112574 | SNX18 | P4T-E | Human | Esophagus | ESCC | 5.17e-04 | 1.59e-01 | 0.1323 |
| 112574 | SNX18 | P5T-E | Human | Esophagus | ESCC | 1.36e-22 | 4.22e-01 | 0.1327 |
| 112574 | SNX18 | P8T-E | Human | Esophagus | ESCC | 2.04e-04 | 6.57e-02 | 0.0889 |
| 112574 | SNX18 | P10T-E | Human | Esophagus | ESCC | 1.10e-11 | 2.27e-01 | 0.116 |
| 112574 | SNX18 | P11T-E | Human | Esophagus | ESCC | 3.28e-11 | 2.93e-01 | 0.1426 |
| 112574 | SNX18 | P12T-E | Human | Esophagus | ESCC | 3.11e-11 | 2.67e-01 | 0.1122 |
| 112574 | SNX18 | P15T-E | Human | Esophagus | ESCC | 6.51e-24 | 3.47e-01 | 0.1149 |
| 112574 | SNX18 | P16T-E | Human | Esophagus | ESCC | 2.70e-08 | 7.14e-02 | 0.1153 |
| 112574 | SNX18 | P17T-E | Human | Esophagus | ESCC | 8.96e-04 | 1.07e-01 | 0.1278 |
| 112574 | SNX18 | P19T-E | Human | Esophagus | ESCC | 1.06e-02 | 1.34e-01 | 0.1662 |
| 112574 | SNX18 | P20T-E | Human | Esophagus | ESCC | 1.59e-07 | 1.55e-01 | 0.1124 |
| 112574 | SNX18 | P21T-E | Human | Esophagus | ESCC | 3.71e-06 | 1.69e-01 | 0.1617 |
| 112574 | SNX18 | P22T-E | Human | Esophagus | ESCC | 4.69e-15 | 2.53e-01 | 0.1236 |
| 112574 | SNX18 | P23T-E | Human | Esophagus | ESCC | 1.38e-10 | 5.21e-01 | 0.108 |
| 112574 | SNX18 | P24T-E | Human | Esophagus | ESCC | 2.01e-11 | 8.95e-02 | 0.1287 |
| 112574 | SNX18 | P26T-E | Human | Esophagus | ESCC | 4.91e-33 | 6.17e-01 | 0.1276 |
| 112574 | SNX18 | P27T-E | Human | Esophagus | ESCC | 7.67e-11 | 1.72e-01 | 0.1055 |
| Page: 1 2 3 4 |
| Tissue | Expression Dynamics | Abbreviation |
| Esophagus |  | ESCC: Esophageal squamous cell carcinoma |
| HGIN: High-grade intraepithelial neoplasias | ||
| LGIN: Low-grade intraepithelial neoplasias | ||
| Liver |  | HCC: Hepatocellular carcinoma |
| NAFLD: Non-alcoholic fatty liver disease | ||
| Thyroid | 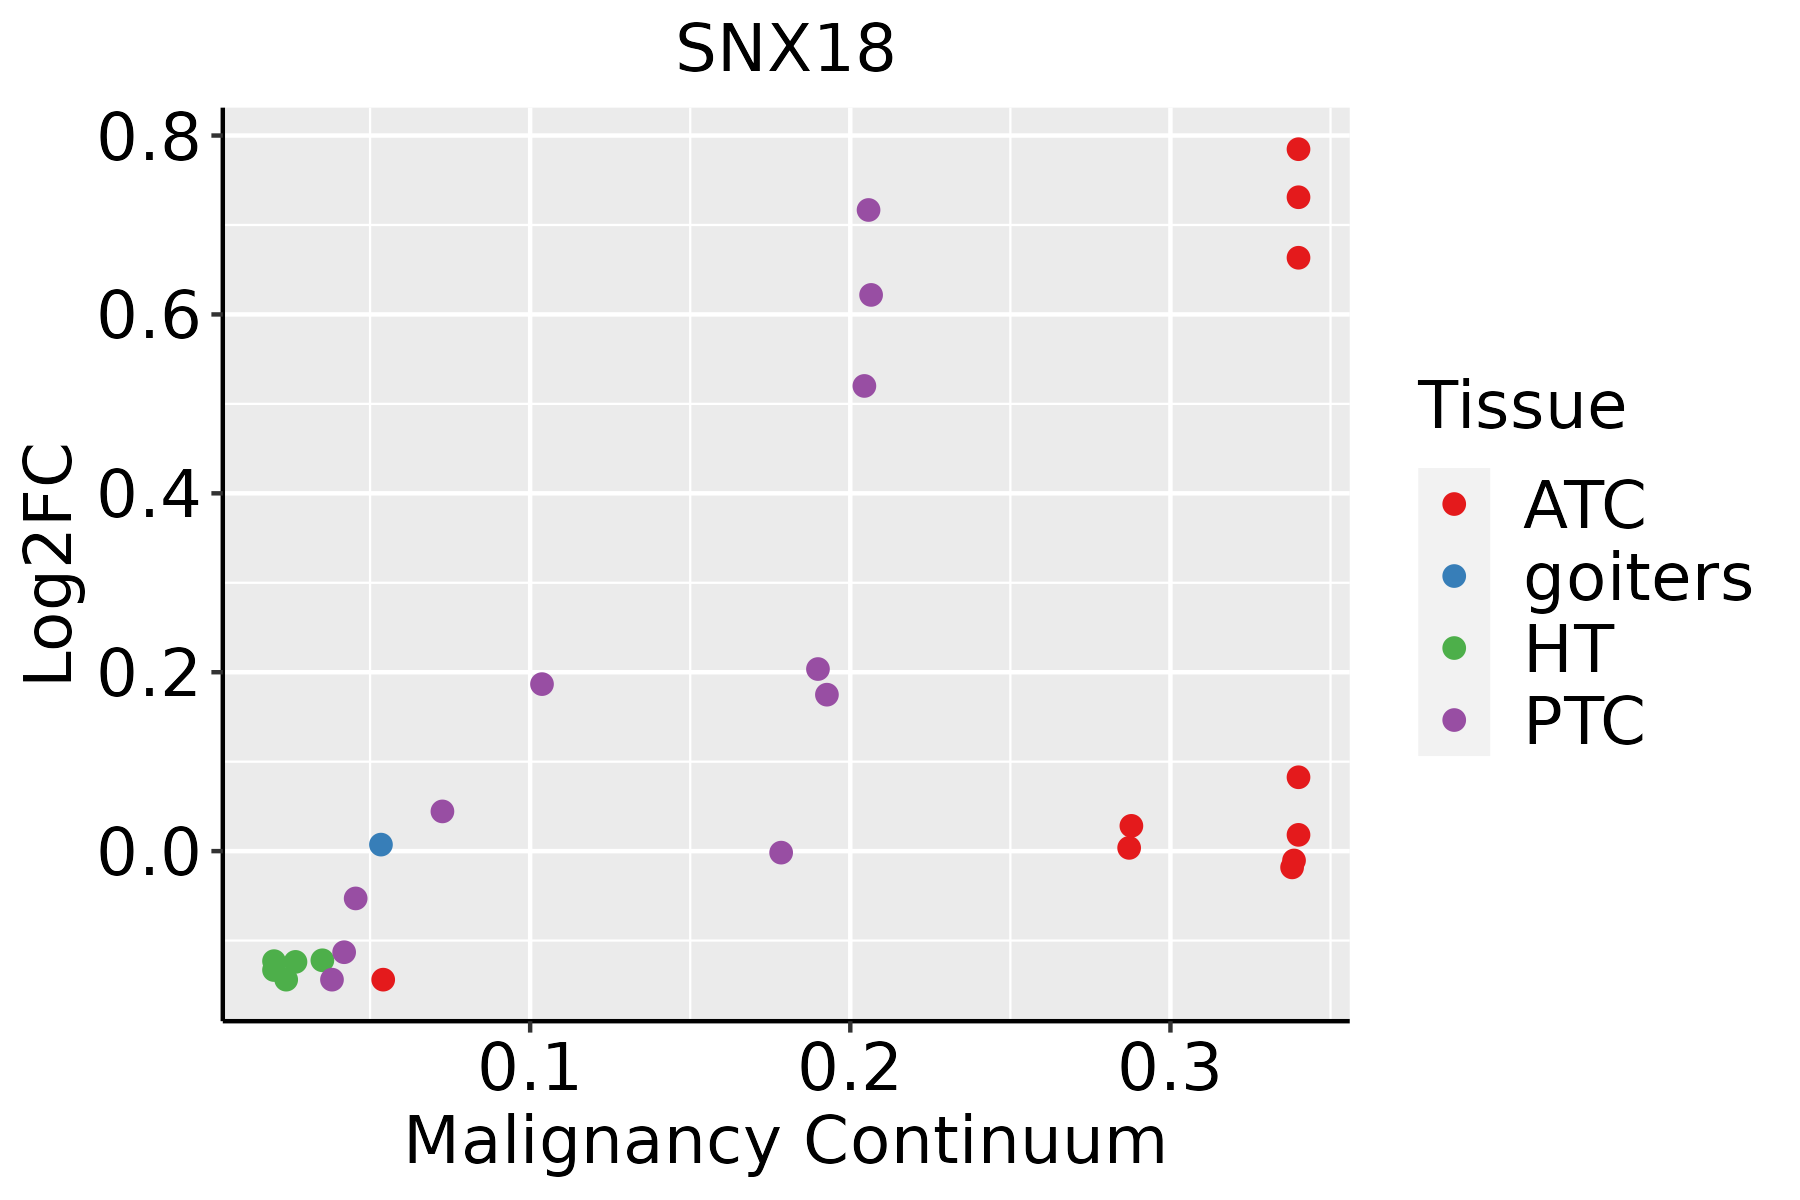 | ATC: Anaplastic thyroid cancer |
| HT: Hashimoto's thyroiditis | ||
| PTC: Papillary thyroid cancer |
| ∗log2FC in expression of this searched gene in stem-like cells from each diseased tissue sample relative to stem-like cells in normal samples in each tissue plotted against the malignancy continuum. Samples are colored based on if they are from different disease stage. |
Top |
Malignant transformation related pathway analysis |
| Find out the enriched GO biological processes and KEGG pathways involved in transition from healthy to precancer to cancer |
| Tissue | Disease Stage | Enriched GO biological Processes |
| Colorectum | AD |  |
| Colorectum | SER |  |
| Colorectum | MSS |  |
| Colorectum | MSI-H |  |
| Colorectum | FAP |  |
| ∗Top 15 enriched GO BP terms are showed in the bar plot of each disease state in each tissue. Each row represents a significant GO biological process which is colored according to the -log10(p.adjust). |
| Page: 1 2 3 4 5 6 7 8 9 |
| GO ID | Tissue | Disease Stage | Description | Gene Ratio | Bg Ratio | pvalue | p.adjust | Count |
| GO:001619715 | Esophagus | ESCC | endosomal transport | 168/8552 | 230/18723 | 2.28e-17 | 1.93e-15 | 168 |
| GO:000028115 | Esophagus | ESCC | mitotic cytokinesis | 58/8552 | 71/18723 | 4.34e-10 | 1.15e-08 | 58 |
| GO:003250614 | Esophagus | ESCC | cytokinetic process | 35/8552 | 39/18723 | 9.38e-09 | 1.90e-07 | 35 |
| GO:000091016 | Esophagus | ESCC | cytokinesis | 115/8552 | 173/18723 | 2.48e-08 | 4.68e-07 | 115 |
| GO:006164015 | Esophagus | ESCC | cytoskeleton-dependent cytokinesis | 72/8552 | 100/18723 | 8.10e-08 | 1.39e-06 | 72 |
| GO:004308715 | Esophagus | ESCC | regulation of GTPase activity | 183/8552 | 348/18723 | 5.34e-03 | 2.00e-02 | 183 |
| GO:001619721 | Liver | HCC | endosomal transport | 154/7958 | 230/18723 | 4.74e-14 | 2.95e-12 | 154 |
| GO:003250611 | Liver | HCC | cytokinetic process | 32/7958 | 39/18723 | 4.73e-07 | 7.69e-06 | 32 |
| GO:000028111 | Liver | HCC | mitotic cytokinesis | 51/7958 | 71/18723 | 5.20e-07 | 8.38e-06 | 51 |
| GO:000091011 | Liver | HCC | cytokinesis | 100/7958 | 173/18723 | 3.38e-05 | 3.39e-04 | 100 |
| GO:006164011 | Liver | HCC | cytoskeleton-dependent cytokinesis | 60/7958 | 100/18723 | 3.09e-04 | 2.20e-03 | 60 |
| GO:001619718 | Thyroid | PTC | endosomal transport | 128/5968 | 230/18723 | 6.26e-14 | 3.52e-12 | 128 |
| GO:00002818 | Thyroid | PTC | mitotic cytokinesis | 43/5968 | 71/18723 | 5.93e-07 | 9.47e-06 | 43 |
| GO:000091019 | Thyroid | PTC | cytokinesis | 82/5968 | 173/18723 | 1.37e-05 | 1.47e-04 | 82 |
| GO:004308718 | Thyroid | PTC | regulation of GTPase activity | 148/5968 | 348/18723 | 1.63e-05 | 1.71e-04 | 148 |
| GO:00325068 | Thyroid | PTC | cytokinetic process | 25/5968 | 39/18723 | 3.50e-05 | 3.30e-04 | 25 |
| GO:00616408 | Thyroid | PTC | cytoskeleton-dependent cytokinesis | 50/5968 | 100/18723 | 1.20e-04 | 9.59e-04 | 50 |
| GO:004354714 | Thyroid | PTC | positive regulation of GTPase activity | 103/5968 | 255/18723 | 2.38e-03 | 1.25e-02 | 103 |
| GO:001619719 | Thyroid | ATC | endosomal transport | 128/6293 | 230/18723 | 4.44e-12 | 1.75e-10 | 128 |
| GO:000028117 | Thyroid | ATC | mitotic cytokinesis | 50/6293 | 71/18723 | 2.46e-10 | 7.10e-09 | 50 |
| Page: 1 2 |
| Pathway ID | Tissue | Disease Stage | Description | Gene Ratio | Bg Ratio | pvalue | p.adjust | qvalue | Count |
| hsa05132211 | Esophagus | ESCC | Salmonella infection | 191/4205 | 249/8465 | 6.51e-19 | 5.45e-17 | 2.79e-17 | 191 |
| hsa05132310 | Esophagus | ESCC | Salmonella infection | 191/4205 | 249/8465 | 6.51e-19 | 5.45e-17 | 2.79e-17 | 191 |
| hsa0513242 | Liver | HCC | Salmonella infection | 178/4020 | 249/8465 | 5.90e-15 | 1.98e-13 | 1.10e-13 | 178 |
| hsa0513252 | Liver | HCC | Salmonella infection | 178/4020 | 249/8465 | 5.90e-15 | 1.98e-13 | 1.10e-13 | 178 |
| Page: 1 |
Top |
Cell-cell communication analysis |
| Identification of potential cell-cell interactions between two cell types and their ligand-receptor pairs for different disease states |
| Ligand | Receptor | LRpair | Pathway | Tissue | Disease Stage |
| Page: 1 |
Top |
Single-cell gene regulatory network inference analysis |
| Find out the significant the regulons (TFs) and the target genes of each regulon across cell types for different disease states |
| TF | Cell Type | Tissue | Disease Stage | Target Gene | RSS | Regulon Activity |
| ∗The dot plots of a searched regulon are shown for all cell subpopulations in each disease state of each tissue based on the regulon specific score inferred using pySCENIC and by calculating the average expression. |
| Page: 1 |
Top |
Somatic mutation of malignant transformation related genes |
| Annotation of somatic variants for genes involved in malignant transformation |
| Hugo Symbol | Variant Class | Variant Classification | dbSNP RS | HGVSc | HGVSp | HGVSp Short | SWISSPROT | BIOTYPE | SIFT | PolyPhen | Tumor Sample Barcode | Tissue | Histology | Sex | Age | Stage | Therapy Types | Drugs | Outcome |
| SNX18 | insertion | In_Frame_Ins | novel | c.1808_1809insGACCCTTAG | p.Leu603_Glu604insThrLeuSer | p.L603_E604insTLS | Q96RF0 | protein_coding | TCGA-B6-A0IE-01 | Breast | breast invasive carcinoma | Female | <65 | III/IV | Unknown | Unknown | PD | ||
| SNX18 | insertion | Frame_Shift_Ins | novel | c.1845_1846insA | p.Val617GlyfsTer17 | p.V617Gfs*17 | Q96RF0 | protein_coding | TCGA-EW-A1OX-01 | Breast | breast invasive carcinoma | Female | <65 | I/II | Chemotherapy | taxotere | SD | ||
| SNX18 | SNV | Missense_Mutation | c.665C>T | p.Ser222Leu | p.S222L | Q96RF0 | protein_coding | tolerated(0.22) | probably_damaging(0.988) | TCGA-2W-A8YY-01 | Cervix | cervical & endocervical cancer | Female | <65 | I/II | Chemotherapy | cisplatin | CR | |
| SNX18 | SNV | Missense_Mutation | rs758240285 | c.1288G>A | p.Gly430Ser | p.G430S | Q96RF0 | protein_coding | tolerated(0.4) | possibly_damaging(0.883) | TCGA-2W-A8YY-01 | Cervix | cervical & endocervical cancer | Female | <65 | I/II | Chemotherapy | cisplatin | CR |
| SNX18 | SNV | Missense_Mutation | c.1833G>T | p.Glu611Asp | p.E611D | Q96RF0 | protein_coding | tolerated_low_confidence(0.54) | benign(0.021) | TCGA-JX-A5QV-01 | Cervix | cervical & endocervical cancer | Female | <65 | I/II | Unknown | Unknown | SD | |
| SNX18 | SNV | Missense_Mutation | c.529N>A | p.Pro177Thr | p.P177T | Q96RF0 | protein_coding | tolerated(0.16) | benign(0.075) | TCGA-A6-6780-01 | Colorectum | colon adenocarcinoma | Male | >=65 | I/II | Unknown | Unknown | SD | |
| SNX18 | SNV | Missense_Mutation | c.1721N>A | p.Ser574Tyr | p.S574Y | Q96RF0 | protein_coding | deleterious(0.01) | benign(0.341) | TCGA-AA-3510-01 | Colorectum | colon adenocarcinoma | Male | >=65 | I/II | Unknown | Unknown | SD | |
| SNX18 | SNV | Missense_Mutation | novel | c.1511G>A | p.Gly504Asp | p.G504D | Q96RF0 | protein_coding | deleterious(0) | probably_damaging(0.964) | TCGA-AA-3864-01 | Colorectum | colon adenocarcinoma | Male | >=65 | I/II | Unknown | Unknown | SD |
| SNX18 | SNV | Missense_Mutation | novel | c.1751N>C | p.Phe584Ser | p.F584S | Q96RF0 | protein_coding | deleterious(0) | probably_damaging(0.979) | TCGA-AA-3949-01 | Colorectum | colon adenocarcinoma | Female | >=65 | III/IV | Unknown | Unknown | SD |
| SNX18 | SNV | Missense_Mutation | novel | c.1480N>A | p.Ala494Thr | p.A494T | Q96RF0 | protein_coding | tolerated(0.62) | benign(0.418) | TCGA-AA-3984-01 | Colorectum | colon adenocarcinoma | Female | <65 | I/II | Unknown | Unknown | SD |
| Page: 1 2 3 4 5 6 7 |
Top |
Related drugs of malignant transformation related genes |
| Identification of chemicals and drugs interact with genes involved in malignant transfromation |
| (DGIdb 4.0) |
| Entrez ID | Symbol | Category | Interaction Types | Drug Claim Name | Drug Name | PMIDs |
| Page: 1 |

Copyright 2023-Present -The University of Texas Health Science Center at Houston |