Schematic overview of the cellular and molecular mechanisms involved in the cancer progression, including the proposed cellular and molecular mechanisms in cancer cells trajectory. AT1: alveolar type 1 cells; AT2: alveolar type 2 cells; AAH: atypical adenomatous hyperplasia; AIS: adenocarcinoma in situ; MIA: minimally invasive adenocarcinoma; IA: invasive adenocarcinoma; EMT: epithelial-mesenchymal transition

Home

Download

Statistics

Help

Contact

Center for Computational Systems Medicine
leaf

Gene summary

leaf

Malignant transformation analysis

leaf

Malignant transformation related pathway analysis

leaf

Cell-cell communication analysis

leaf

Single-cell gene regulatory network inference analysis

leaf

Somatic mutation of malignant transformation related genes

leaf

Related drugs of malignant transformation related genes

Gene: SNX14

Gene summary for SNX14

check button Gene summary.

Gene informationSpeciesHuman
Gene symbol

SNX14

Gene ID

57231

Gene namesorting nexin 14
Gene AliasRGS-PX2
Cytomap6q14.3
Gene Typeprotein-coding
GO ID

GO:0006810

UniProtAcc

Q9Y5W7


Top

Malignant transformation analysis

check button Identification of the aberrant gene expression in precancerous and cancerous lesions by comparing the gene expression of stem-like cells in diseased tissues with normal stem cells
check button Malignant transformation involving gene list.
Entrez IDSymbolReplicatesSpeciesOrganTissueAdj P-valueLog2FCMalignancy
57231SNX14LZE4THumanEsophagusESCC1.29e-061.31e-010.0811
57231SNX14LZE5THumanEsophagusESCC2.10e-022.17e-010.0514
57231SNX14LZE24THumanEsophagusESCC6.10e-092.19e-010.0596
57231SNX14P1T-EHumanEsophagusESCC2.88e-072.04e-010.0875
57231SNX14P2T-EHumanEsophagusESCC1.43e-121.21e-010.1177
57231SNX14P4T-EHumanEsophagusESCC1.17e-101.56e-010.1323
57231SNX14P5T-EHumanEsophagusESCC1.67e-053.51e-020.1327
57231SNX14P8T-EHumanEsophagusESCC7.99e-272.70e-010.0889
57231SNX14P9T-EHumanEsophagusESCC3.63e-046.41e-020.1131
57231SNX14P10T-EHumanEsophagusESCC2.96e-111.77e-010.116
57231SNX14P11T-EHumanEsophagusESCC5.88e-125.71e-010.1426
57231SNX14P12T-EHumanEsophagusESCC9.37e-091.09e-010.1122
57231SNX14P16T-EHumanEsophagusESCC7.24e-058.73e-020.1153
57231SNX14P17T-EHumanEsophagusESCC6.87e-063.37e-010.1278
57231SNX14P19T-EHumanEsophagusESCC7.64e-031.91e-010.1662
57231SNX14P20T-EHumanEsophagusESCC5.47e-102.05e-010.1124
57231SNX14P21T-EHumanEsophagusESCC9.53e-225.11e-010.1617
57231SNX14P22T-EHumanEsophagusESCC8.70e-071.50e-020.1236
57231SNX14P23T-EHumanEsophagusESCC1.61e-121.51e-010.108
57231SNX14P24T-EHumanEsophagusESCC3.46e-101.81e-010.1287
Page: 1 2 3 4 5 6 

check button Transcriptomic changes along malignancy continuum.
TissueExpression DynamicsAbbreviation
EsophagusThe image shows the transcriptomic changes along malignancy continuum.log2FC in expression of this searched gene in stem-like cells from each diseased tissue sample relative to stem-like cells in normal samples in each tissue plotted against the malignancy continuum. Samples are colored based on if they are from different disease stage.
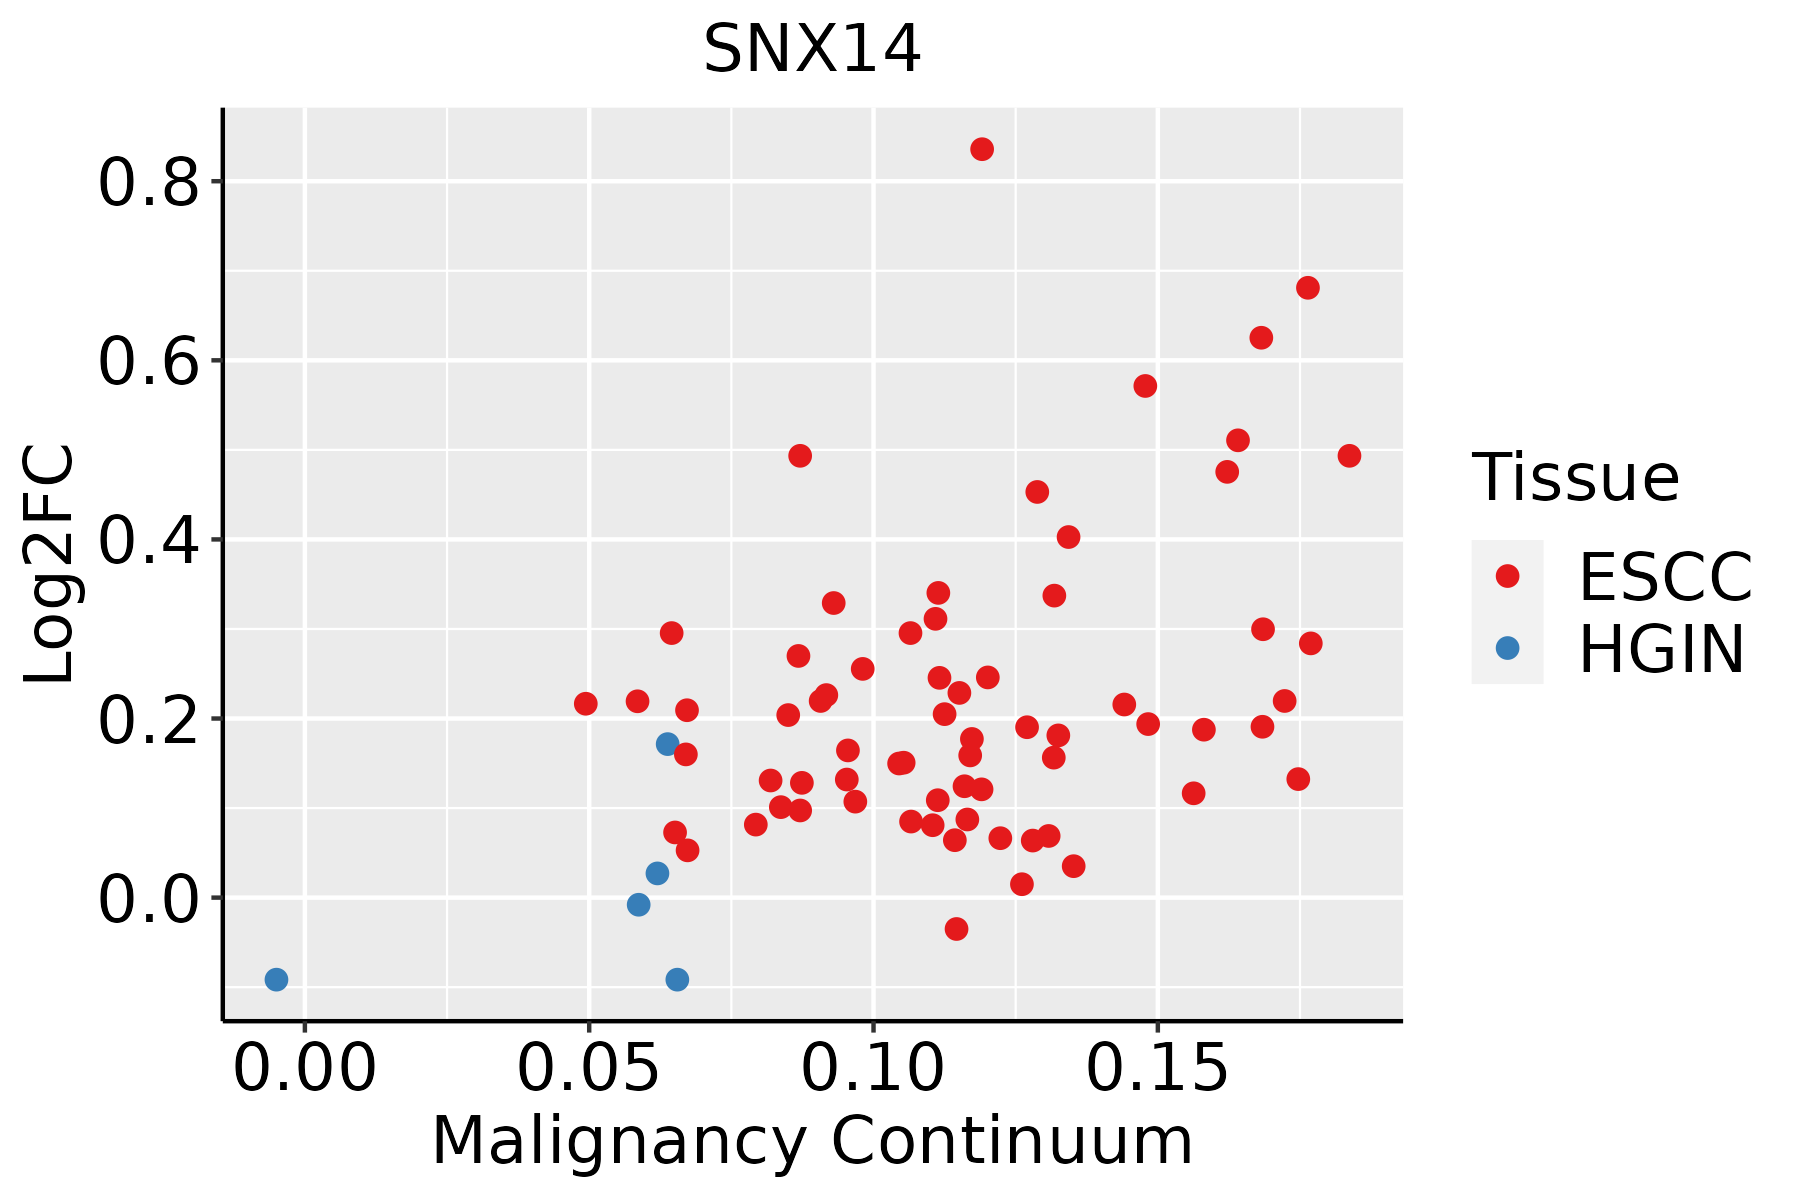
ESCC: Esophageal squamous cell carcinoma
HGIN: High-grade intraepithelial neoplasias
LGIN: Low-grade intraepithelial neoplasias
LiverThe image shows the transcriptomic changes along malignancy continuum.log2FC in expression of this searched gene in stem-like cells from each diseased tissue sample relative to stem-like cells in normal samples in each tissue plotted against the malignancy continuum. Samples are colored based on if they are from different disease stage.
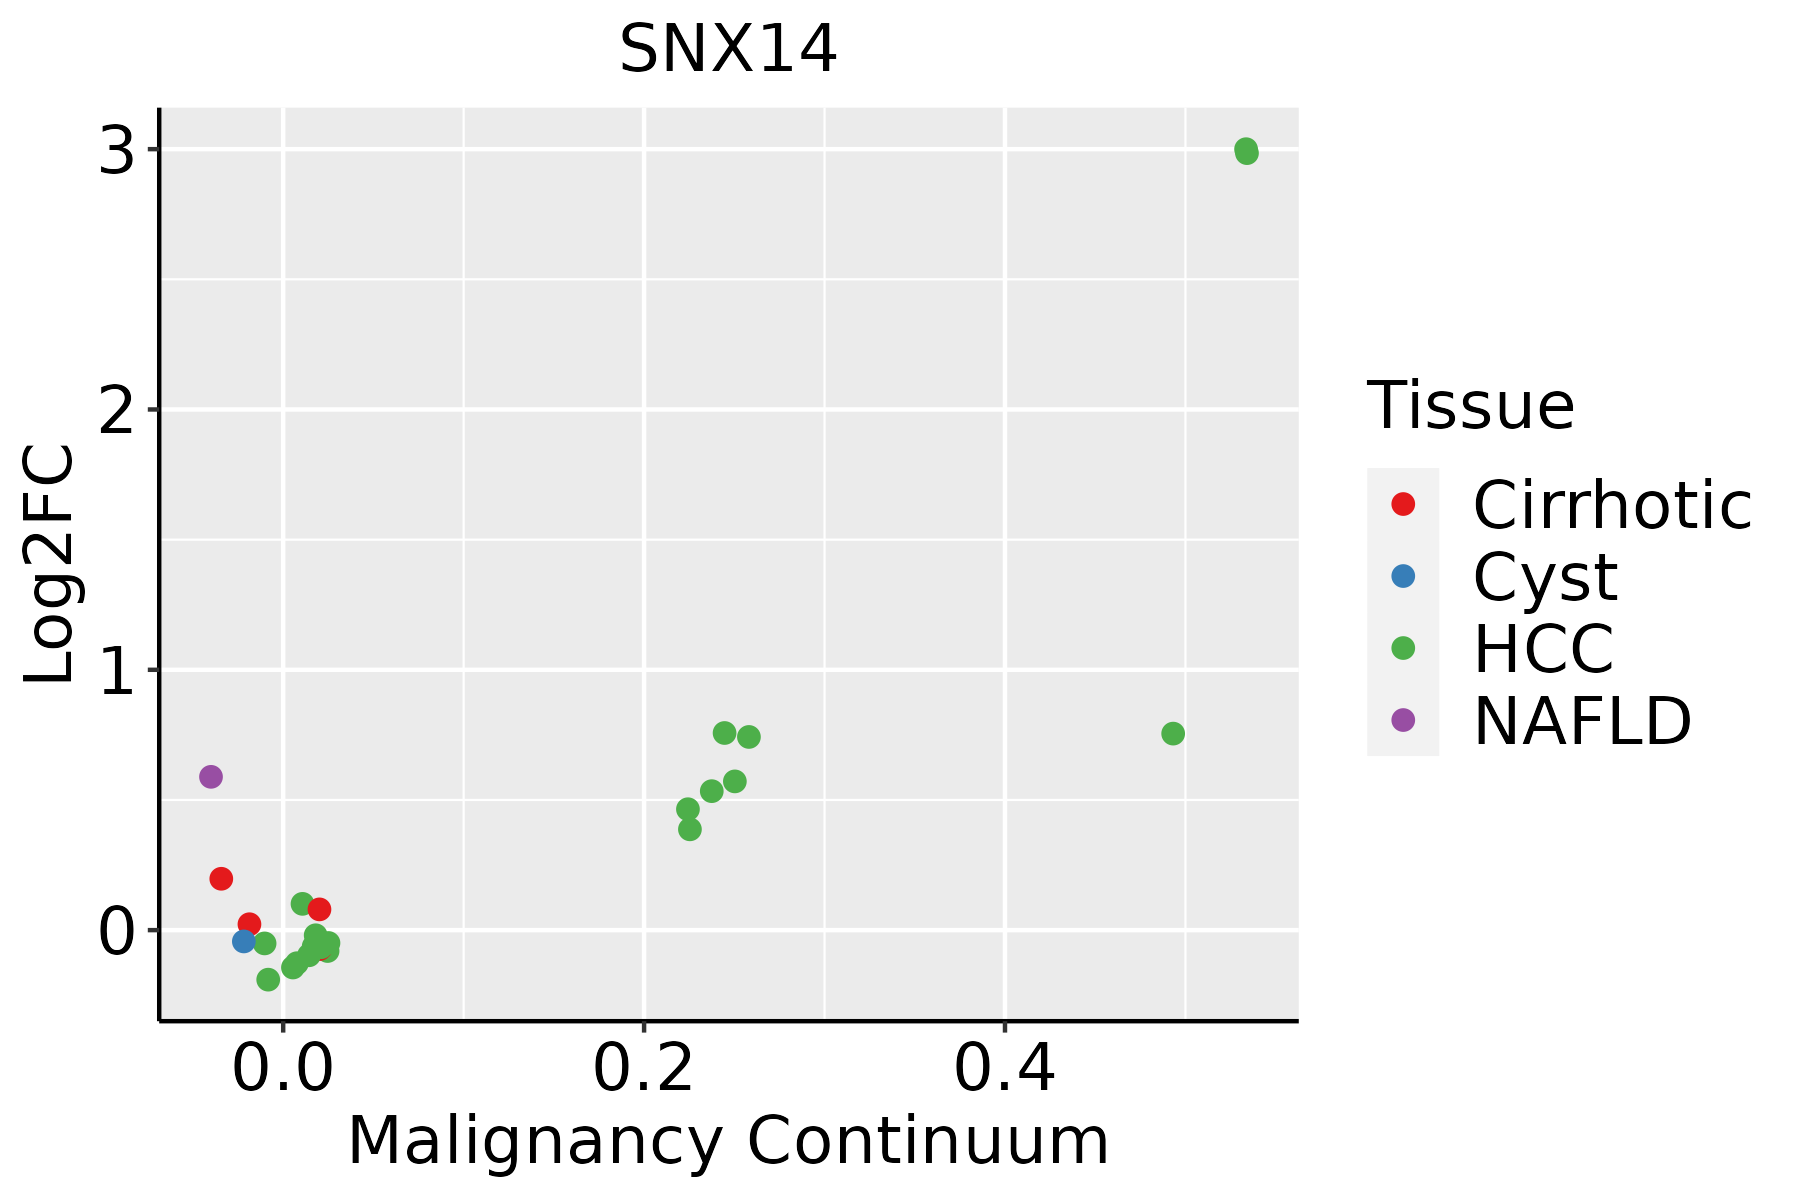
HCC: Hepatocellular carcinoma
NAFLD: Non-alcoholic fatty liver disease
LungThe image shows the transcriptomic changes along malignancy continuum.log2FC in expression of this searched gene in stem-like cells from each diseased tissue sample relative to stem-like cells in normal samples in each tissue plotted against the malignancy continuum. Samples are colored based on if they are from different disease stage.
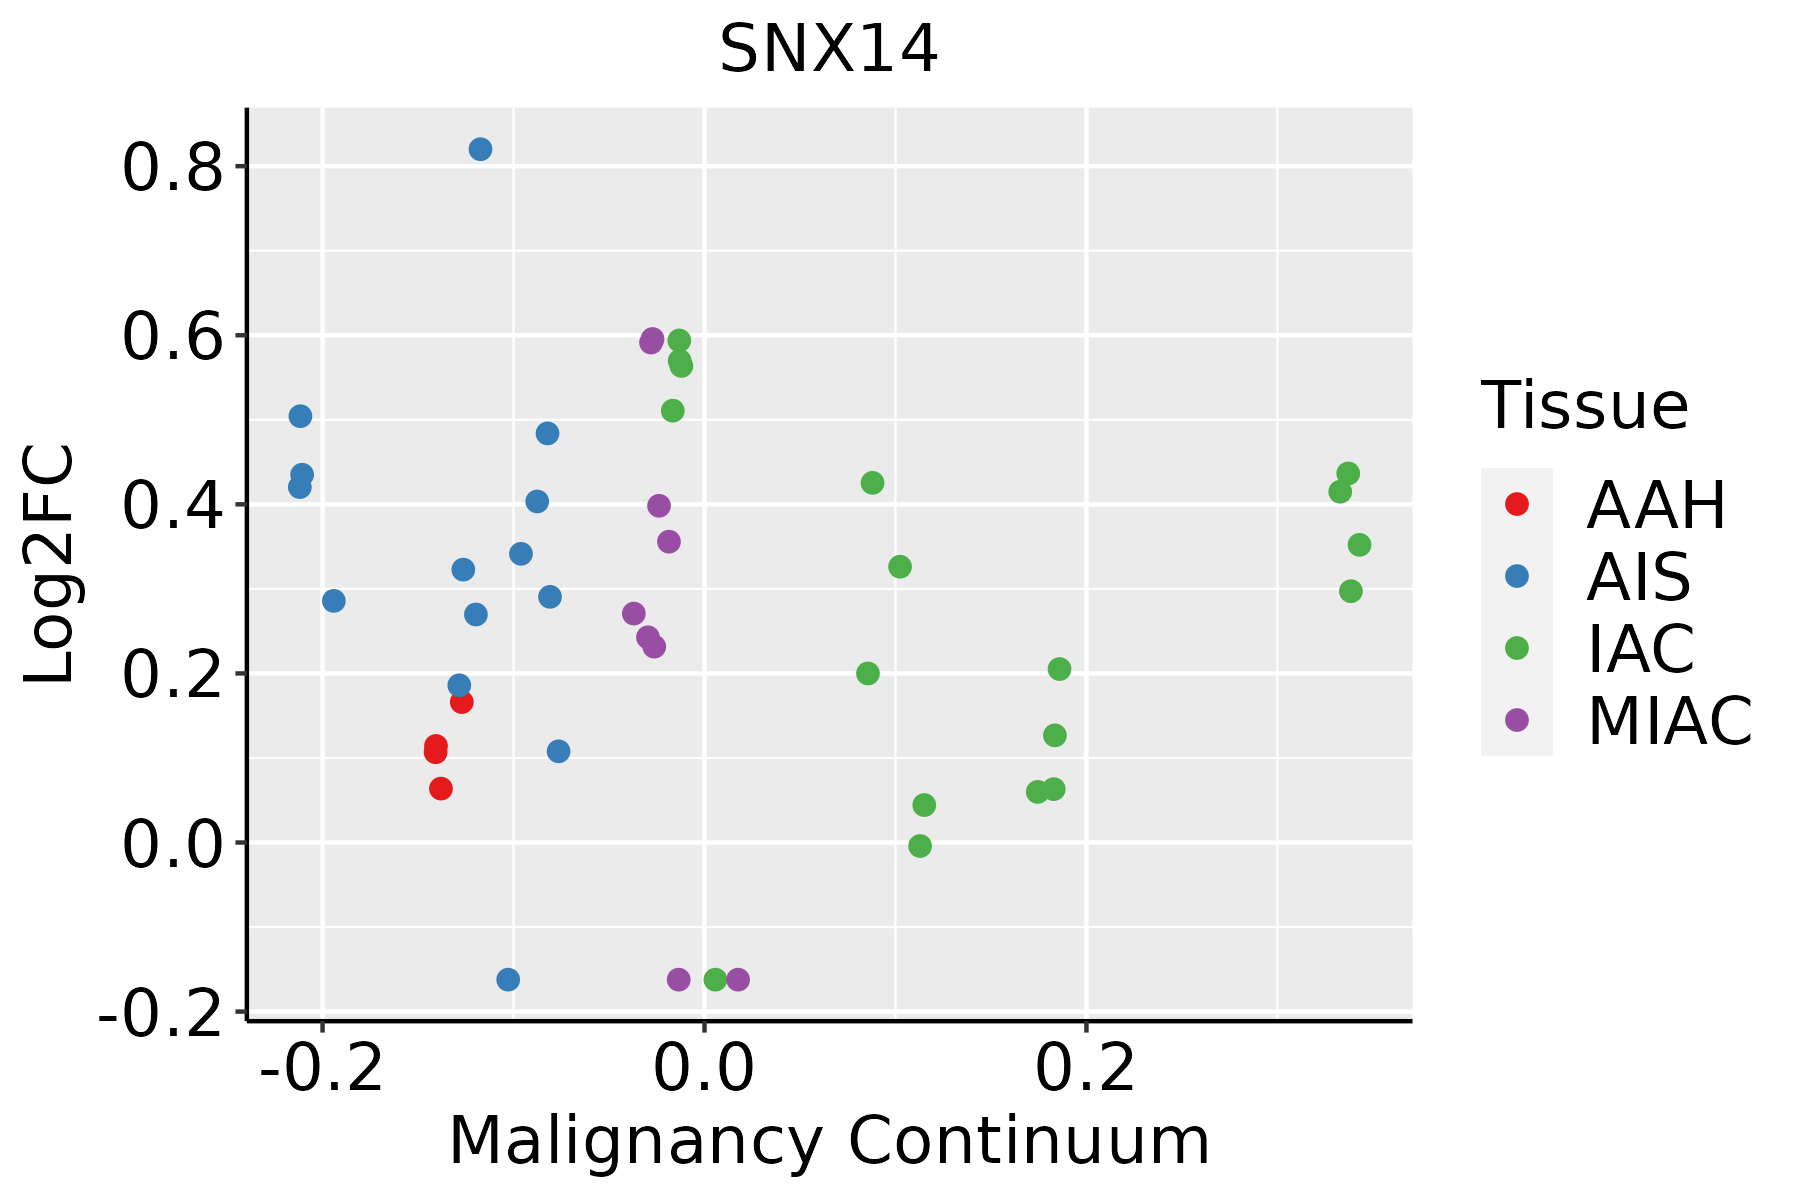
AAH: Atypical adenomatous hyperplasia
AIS: Adenocarcinoma in situ
IAC: Invasive lung adenocarcinoma
MIA: Minimally invasive adenocarcinoma
Oral CavityThe image shows the transcriptomic changes along malignancy continuum.log2FC in expression of this searched gene in stem-like cells from each diseased tissue sample relative to stem-like cells in normal samples in each tissue plotted against the malignancy continuum. Samples are colored based on if they are from different disease stage.EOLP: Erosive Oral lichen planus
LP: leukoplakia
NEOLP: Non-erosive oral lichen planus
OSCC: Oral squamous cell carcinoma
SkinThe image shows the transcriptomic changes along malignancy continuum.log2FC in expression of this searched gene in stem-like cells from each diseased tissue sample relative to stem-like cells in normal samples in each tissue plotted against the malignancy continuum. Samples are colored based on if they are from different disease stage.
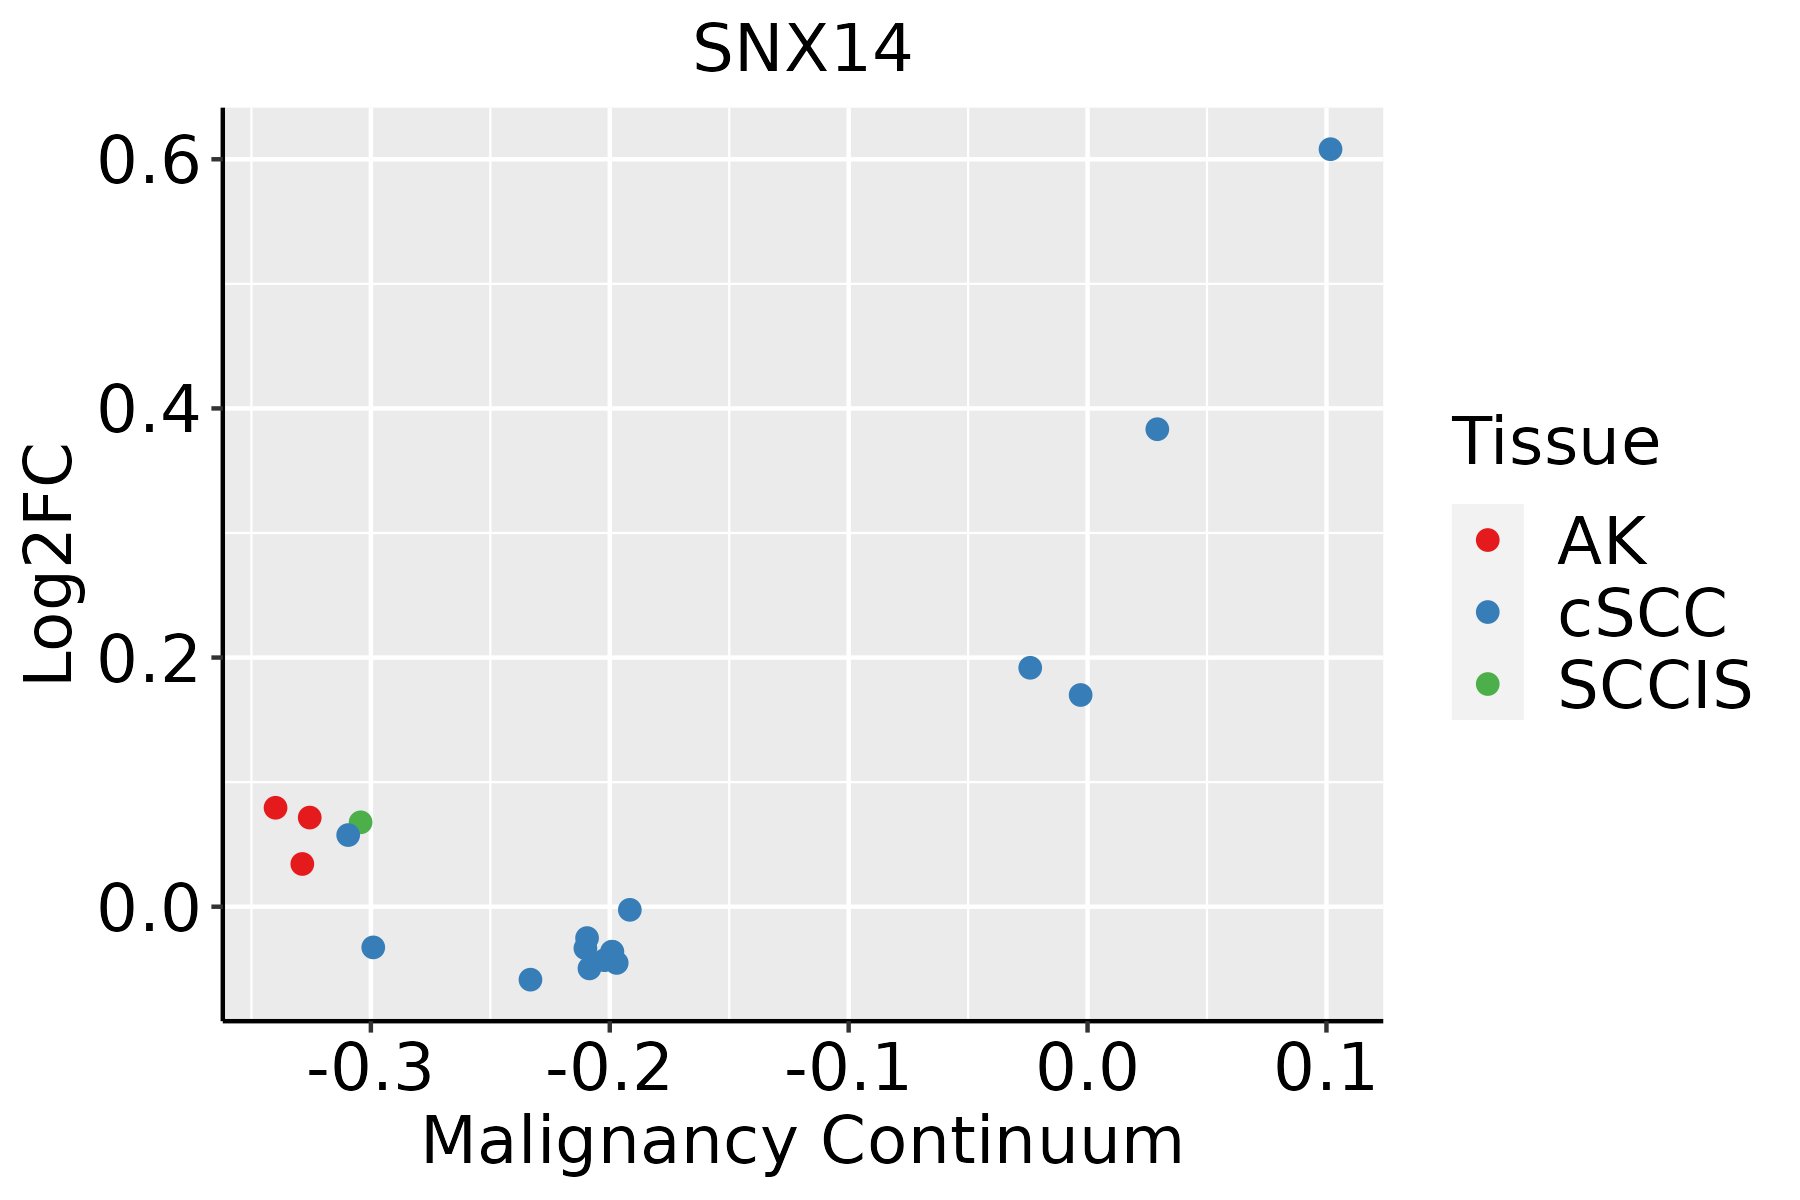
AK: Actinic keratosis
cSCC: Cutaneous squamous cell carcinoma
SCCIS:squamous cell carcinoma in situ
ThyroidThe image shows the transcriptomic changes along malignancy continuum.log2FC in expression of this searched gene in stem-like cells from each diseased tissue sample relative to stem-like cells in normal samples in each tissue plotted against the malignancy continuum. Samples are colored based on if they are from different disease stage.
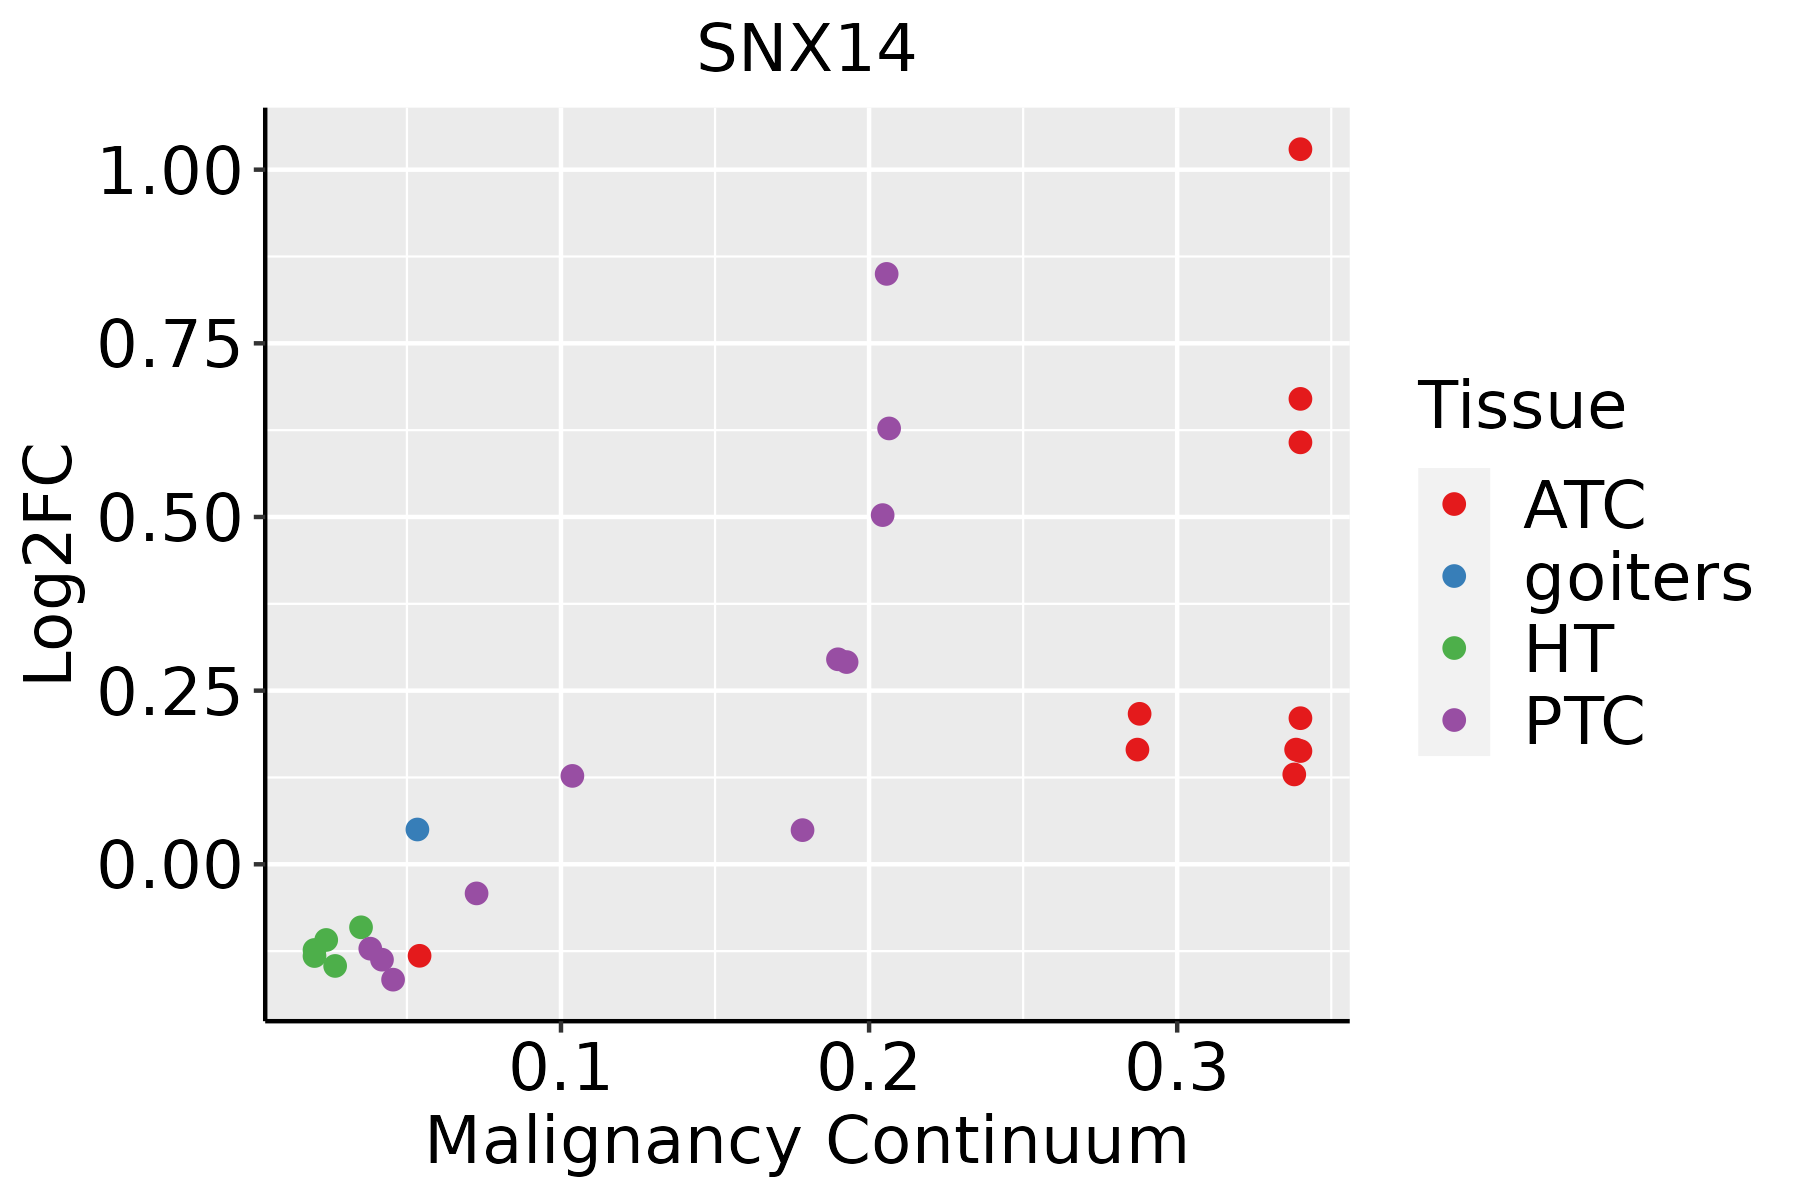
ATC: Anaplastic thyroid cancer
HT: Hashimoto's thyroiditis
PTC: Papillary thyroid cancer
∗log2FC in expression of this searched gene in stem-like cells from each diseased tissue sample relative to stem-like cells in normal samples in each tissue plotted against the malignancy continuum. Samples are colored based on if they are from different disease stage.

Top

Malignant transformation related pathway analysis

check buttonFind out the enriched GO biological processes and KEGG pathways involved in transition from healthy to precancer to cancer
check button Figure of enriched GO biological processes.
TissueDisease StageEnriched GO biological Processes
ColorectumADGO analysis - Figure of enriched GO biological processes: Top 15 enriched GO BP terms are showed in the bar plot of each disease state in each tissue. Each row represents a significant GO biological process which is colored according to the -log10(p.adjust).
ColorectumSERGO analysis - Figure of enriched GO biological processes: Top 15 enriched GO BP terms are showed in the bar plot of each disease state in each tissue. Each row represents a significant GO biological process which is colored according to the -log10(p.adjust).
ColorectumMSSGO analysis - Figure of enriched GO biological processes: Top 15 enriched GO BP terms are showed in the bar plot of each disease state in each tissue. Each row represents a significant GO biological process which is colored according to the -log10(p.adjust).
ColorectumMSI-HGO analysis - Figure of enriched GO biological processes: Top 15 enriched GO BP terms are showed in the bar plot of each disease state in each tissue. Each row represents a significant GO biological process which is colored according to the -log10(p.adjust).
ColorectumFAPGO analysis - Figure of enriched GO biological processes: Top 15 enriched GO BP terms are showed in the bar plot of each disease state in each tissue. Each row represents a significant GO biological process which is colored according to the -log10(p.adjust).
∗Top 15 enriched GO BP terms are showed in the bar plot of each disease state in each tissue. Each row represents a significant GO biological process which is colored according to the -log10(p.adjust).
Page: 1 2 3 4 5 6 7 8 9 

check button Enriched GO biological processes.
GO IDTissueDisease StageDescriptionGene RatioBg Ratiopvaluep.adjustCount
GO:001623617EsophagusESCCmacroautophagy216/8552291/187231.94e-234.57e-21216
GO:0022411111EsophagusESCCcellular component disassembly305/8552443/187231.94e-234.57e-21305
GO:003298416EsophagusESCCprotein-containing complex disassembly151/8552224/187233.45e-111.15e-09151
GO:00973523EsophagusESCCautophagosome maturation31/855240/187234.04e-053.26e-0431
GO:00162365LiverNAFLDmacroautophagy45/1882291/187232.31e-032.19e-0245
GO:001623621LiverHCCmacroautophagy204/7958291/187238.66e-221.41e-19204
GO:002241112LiverHCCcellular component disassembly282/7958443/187231.02e-191.38e-17282
GO:003298411LiverHCCprotein-containing complex disassembly138/7958224/187235.59e-091.46e-07138
GO:00973521LiverHCCautophagosome maturation30/795840/187233.04e-053.12e-0430
GO:00162366LungIACmacroautophagy51/2061291/187235.30e-047.49e-0351
GO:00224118LungIACcellular component disassembly68/2061443/187232.89e-032.60e-0268
GO:001623612LungAISmacroautophagy46/1849291/187239.21e-041.23e-0246
GO:002241119Oral cavityOSCCcellular component disassembly283/7305443/187239.57e-273.37e-24283
GO:001623610Oral cavityOSCCmacroautophagy192/7305291/187237.01e-211.14e-18192
GO:003298410Oral cavityOSCCprotein-containing complex disassembly136/7305224/187233.42e-111.13e-09136
GO:00973522Oral cavityOSCCautophagosome maturation28/730540/187237.00e-055.60e-0428
GO:001623615Oral cavityLPmacroautophagy135/4623291/187234.71e-166.70e-14135
GO:0022411110Oral cavityLPcellular component disassembly173/4623443/187239.97e-127.44e-10173
GO:003298414Oral cavityLPprotein-containing complex disassembly83/4623224/187232.38e-053.86e-0483
GO:009735211Oral cavityLPautophagosome maturation21/462340/187231.42e-041.64e-0321
Page: 1 2 

check button Enriched KEGG pathways.
Pathway IDTissueDisease StageDescriptionGene RatioBg Ratiopvaluep.adjustqvalueCount
Page: 1 

Top

Cell-cell communication analysis

check buttonIdentification of potential cell-cell interactions between two cell types and their ligand-receptor pairs for different disease states
LigandReceptorLRpairPathwayTissueDisease Stage
Page: 1 

Top

Single-cell gene regulatory network inference analysis

check buttonFind out the significant the regulons (TFs) and the target genes of each regulon across cell types for different disease states
TFCell TypeTissueDisease StageTarget GeneRSSRegulon Activity
∗The dot plots of a searched regulon are shown for all cell subpopulations in each disease state of each tissue based on the regulon specific score inferred using pySCENIC and by calculating the average expression.
Page: 1 

Top

Somatic mutation of malignant transformation related genes

check buttonAnnotation of somatic variants for genes involved in malignant transformation
Hugo SymbolVariant ClassVariant ClassificationdbSNP RSHGVScHGVSpHGVSp ShortSWISSPROTBIOTYPESIFTPolyPhenTumor Sample BarcodeTissueHistologySexAgeStageTherapy TypesDrugsOutcome
SNX14SNVMissense_Mutationc.2777N>Gp.Gln926Argp.Q926RQ9Y5W7protein_codingtolerated(0.19)benign(0.075)TCGA-A8-A09Z-01Breastbreast invasive carcinomaFemale>=65I/IIUnknownUnknownSD
SNX14SNVMissense_Mutationc.1732C>Ap.Pro578Thrp.P578TQ9Y5W7protein_codingtolerated(0.65)benign(0.003)TCGA-AC-A23H-01Breastbreast invasive carcinomaFemale>=65I/IIUnknownUnknownPD
SNX14SNVMissense_Mutationc.1234G>Cp.Asp412Hisp.D412HQ9Y5W7protein_codingdeleterious(0.01)probably_damaging(0.99)TCGA-AC-A23H-01Breastbreast invasive carcinomaFemale>=65I/IIUnknownUnknownPD
SNX14SNVMissense_Mutationrs750787317c.713G>Tp.Arg238Ilep.R238IQ9Y5W7protein_codingdeleterious(0)possibly_damaging(0.828)TCGA-AN-A046-01Breastbreast invasive carcinomaFemale>=65I/IIUnknownUnknownSD
SNX14SNVMissense_Mutationnovelc.2588N>Ap.Arg863Hisp.R863HQ9Y5W7protein_codingdeleterious(0)probably_damaging(1)TCGA-S3-A6ZH-01Breastbreast invasive carcinomaFemale<65III/IVChemotherapyadriamycinCR
SNX14insertionNonsense_Mutationnovelc.278_279insGTGp.Glu93_Leu94insTerp.E93_L94ins*Q9Y5W7protein_codingTCGA-AO-A0J9-01Breastbreast invasive carcinomaFemale<65III/IVChemotherapycyclophosphamidePD
SNX14insertionFrame_Shift_Insnovelc.277_278insCCCTp.Glu93AlafsTer9p.E93Afs*9Q9Y5W7protein_codingTCGA-AO-A0J9-01Breastbreast invasive carcinomaFemale<65III/IVChemotherapycyclophosphamidePD
SNX14insertionIn_Frame_Insnovelc.304_305insTTTTCATCTTTATGAp.Ala102delinsValPheIlePheMetThrp.A102delinsVFIFMTQ9Y5W7protein_codingTCGA-AR-A0U0-01Breastbreast invasive carcinomaFemale>=65I/IIUnknownUnknownSD
SNX14SNVMissense_Mutationnovelc.239T>Ap.Phe80Tyrp.F80YQ9Y5W7protein_codingtolerated(0.28)benign(0.001)TCGA-2W-A8YY-01Cervixcervical & endocervical cancerFemale<65I/IIChemotherapycisplatinCR
SNX14SNVMissense_Mutationnovelc.404N>Tp.Ala135Valp.A135VQ9Y5W7protein_codingdeleterious(0.05)possibly_damaging(0.846)TCGA-DS-A1OB-01Cervixcervical & endocervical cancerFemale<65I/IIChemotherapycarboplatinPD
Page: 1 2 3 4 5 6 7 8 9 

Top

Related drugs of malignant transformation related genes

check buttonIdentification of chemicals and drugs interact with genes involved in malignant transfromation
(DGIdb 4.0)
Entrez IDSymbolCategoryInteraction TypesDrug Claim NameDrug NamePMIDs
Page: 1