
|
|||||
|
 | |
| |
| |
| |
| |
| |
|
Gene: SNX12 |
Gene summary for SNX12 |
| Gene information | Species | Human | Gene symbol | SNX12 | Gene ID | 29934 |
| Gene name | sorting nexin 12 | |
| Gene Alias | SNX12 | |
| Cytomap | Xq13.1 | |
| Gene Type | protein-coding | GO ID | GO:0006508 | UniProtAcc | Q3SYF1 |
Top |
Malignant transformation analysis |
| Identification of the aberrant gene expression in precancerous and cancerous lesions by comparing the gene expression of stem-like cells in diseased tissues with normal stem cells |
| Entrez ID | Symbol | Replicates | Species | Organ | Tissue | Adj P-value | Log2FC | Malignancy |
| 29934 | SNX12 | HTA11_3410_2000001011 | Human | Colorectum | AD | 3.68e-02 | 1.52e-01 | 0.0155 |
| 29934 | SNX12 | HTA11_2487_2000001011 | Human | Colorectum | SER | 6.16e-09 | 3.78e-01 | -0.1808 |
| 29934 | SNX12 | HTA11_1938_2000001011 | Human | Colorectum | AD | 6.79e-09 | 4.43e-01 | -0.0811 |
| 29934 | SNX12 | HTA11_78_2000001011 | Human | Colorectum | AD | 7.12e-07 | 3.19e-01 | -0.1088 |
| 29934 | SNX12 | HTA11_347_2000001011 | Human | Colorectum | AD | 1.21e-16 | 4.61e-01 | -0.1954 |
| 29934 | SNX12 | HTA11_411_2000001011 | Human | Colorectum | SER | 2.62e-04 | 5.23e-01 | -0.2602 |
| 29934 | SNX12 | HTA11_83_2000001011 | Human | Colorectum | SER | 1.42e-04 | 3.72e-01 | -0.1526 |
| 29934 | SNX12 | HTA11_696_2000001011 | Human | Colorectum | AD | 8.55e-20 | 3.88e-01 | -0.1464 |
| 29934 | SNX12 | HTA11_866_2000001011 | Human | Colorectum | AD | 2.33e-03 | 1.78e-01 | -0.1001 |
| 29934 | SNX12 | HTA11_1391_2000001011 | Human | Colorectum | AD | 8.45e-13 | 5.07e-01 | -0.059 |
| 29934 | SNX12 | HTA11_2992_2000001011 | Human | Colorectum | SER | 3.64e-04 | 3.97e-01 | -0.1706 |
| 29934 | SNX12 | HTA11_5212_2000001011 | Human | Colorectum | AD | 1.84e-03 | 3.55e-01 | -0.2061 |
| 29934 | SNX12 | HTA11_866_3004761011 | Human | Colorectum | AD | 1.74e-05 | 2.78e-01 | 0.096 |
| 29934 | SNX12 | HTA11_7696_3000711011 | Human | Colorectum | AD | 1.18e-06 | 2.45e-01 | 0.0674 |
| 29934 | SNX12 | HTA11_7469_2000001011 | Human | Colorectum | AD | 5.64e-04 | 6.25e-01 | -0.0124 |
| 29934 | SNX12 | HTA11_99999970781_79442 | Human | Colorectum | MSS | 2.45e-08 | 2.41e-01 | 0.294 |
| 29934 | SNX12 | HTA11_99999965104_69814 | Human | Colorectum | MSS | 6.37e-08 | 4.00e-01 | 0.281 |
| 29934 | SNX12 | HTA11_99999971662_82457 | Human | Colorectum | MSS | 1.12e-17 | 4.80e-01 | 0.3859 |
| 29934 | SNX12 | HTA11_99999974143_84620 | Human | Colorectum | MSS | 1.11e-08 | 3.21e-01 | 0.3005 |
| 29934 | SNX12 | LZE4T | Human | Esophagus | ESCC | 4.37e-12 | 3.05e-01 | 0.0811 |
| Page: 1 2 3 4 5 6 |
| Tissue | Expression Dynamics | Abbreviation |
| Colorectum (GSE201348) |  | FAP: Familial adenomatous polyposis |
| CRC: Colorectal cancer | ||
| Colorectum (HTA11) |  | AD: Adenomas |
| SER: Sessile serrated lesions | ||
| MSI-H: Microsatellite-high colorectal cancer | ||
| MSS: Microsatellite stable colorectal cancer | ||
| Esophagus |  | ESCC: Esophageal squamous cell carcinoma |
| HGIN: High-grade intraepithelial neoplasias | ||
| LGIN: Low-grade intraepithelial neoplasias | ||
| Liver |  | HCC: Hepatocellular carcinoma |
| NAFLD: Non-alcoholic fatty liver disease | ||
| Oral Cavity | 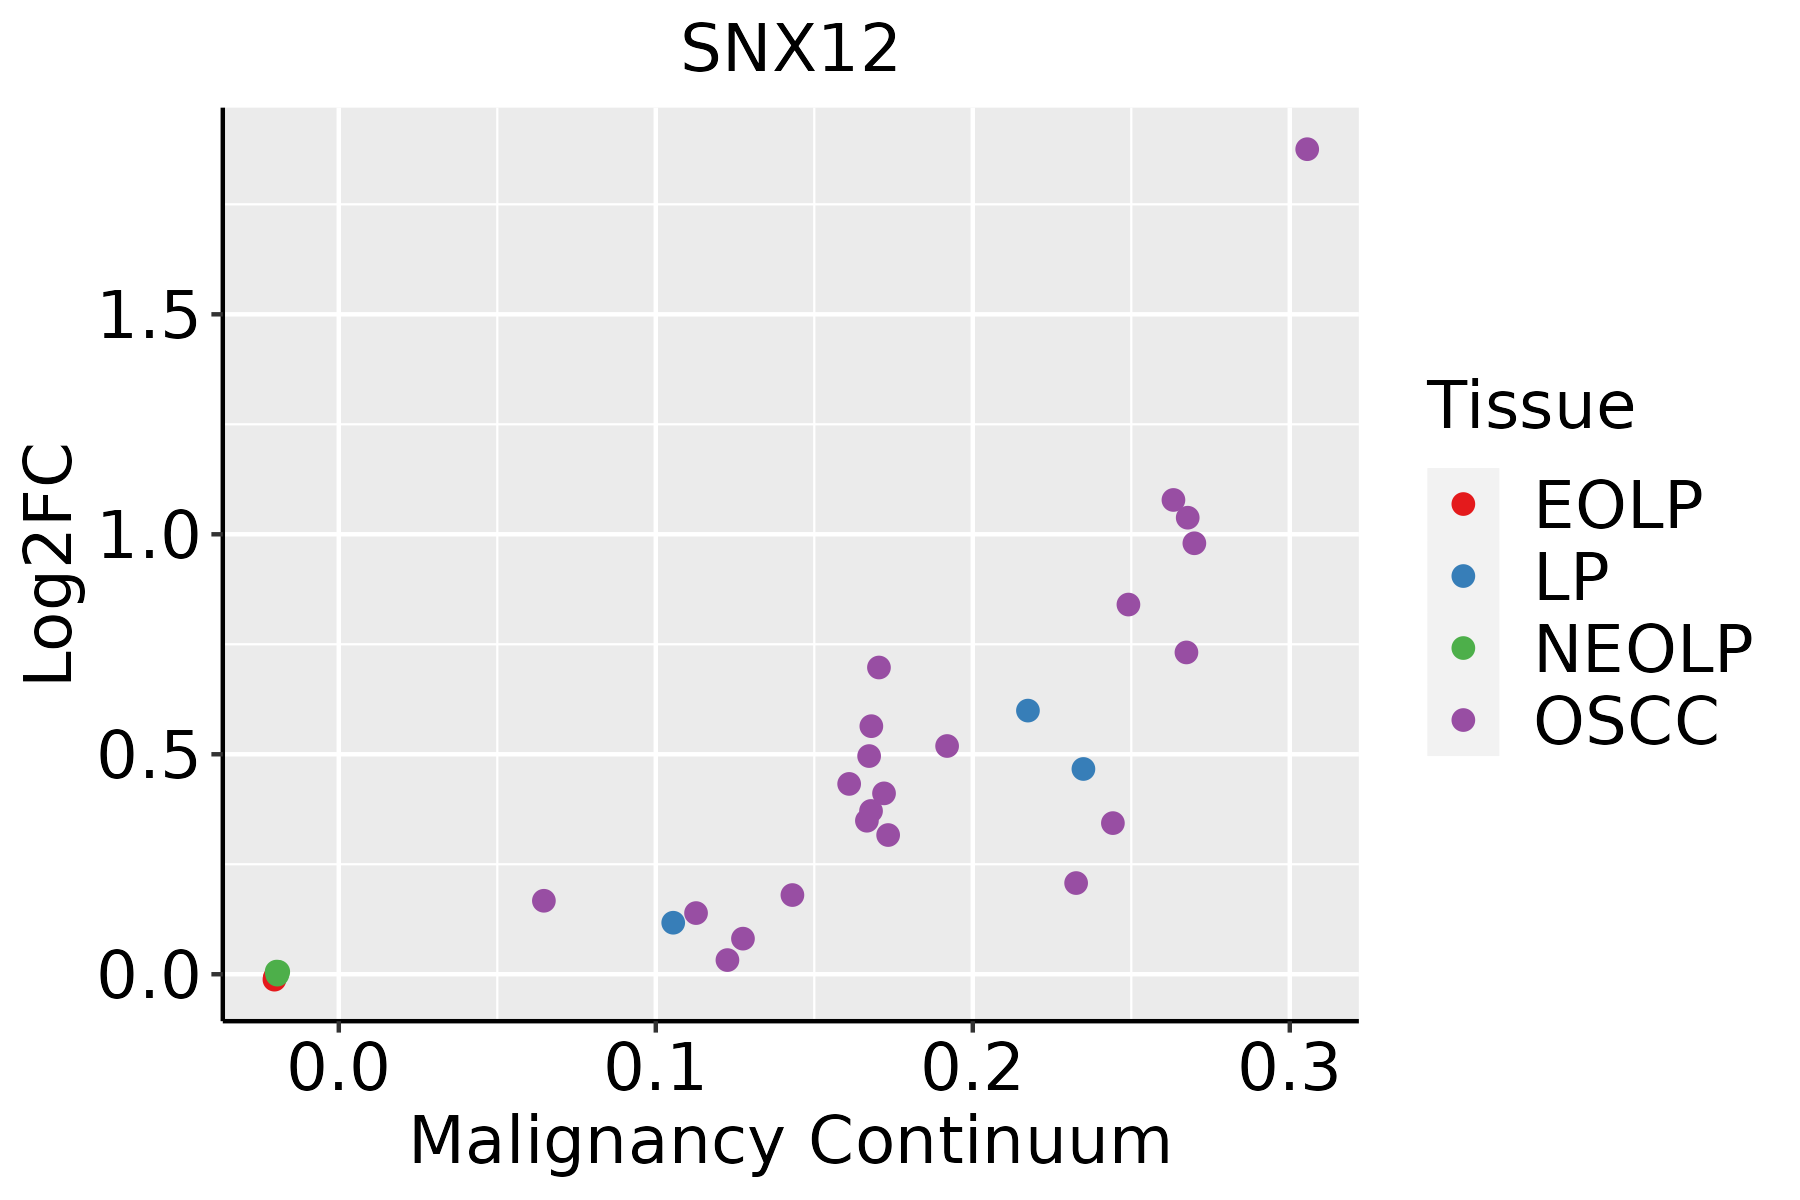 | EOLP: Erosive Oral lichen planus |
| LP: leukoplakia | ||
| NEOLP: Non-erosive oral lichen planus | ||
| OSCC: Oral squamous cell carcinoma | ||
| Skin | 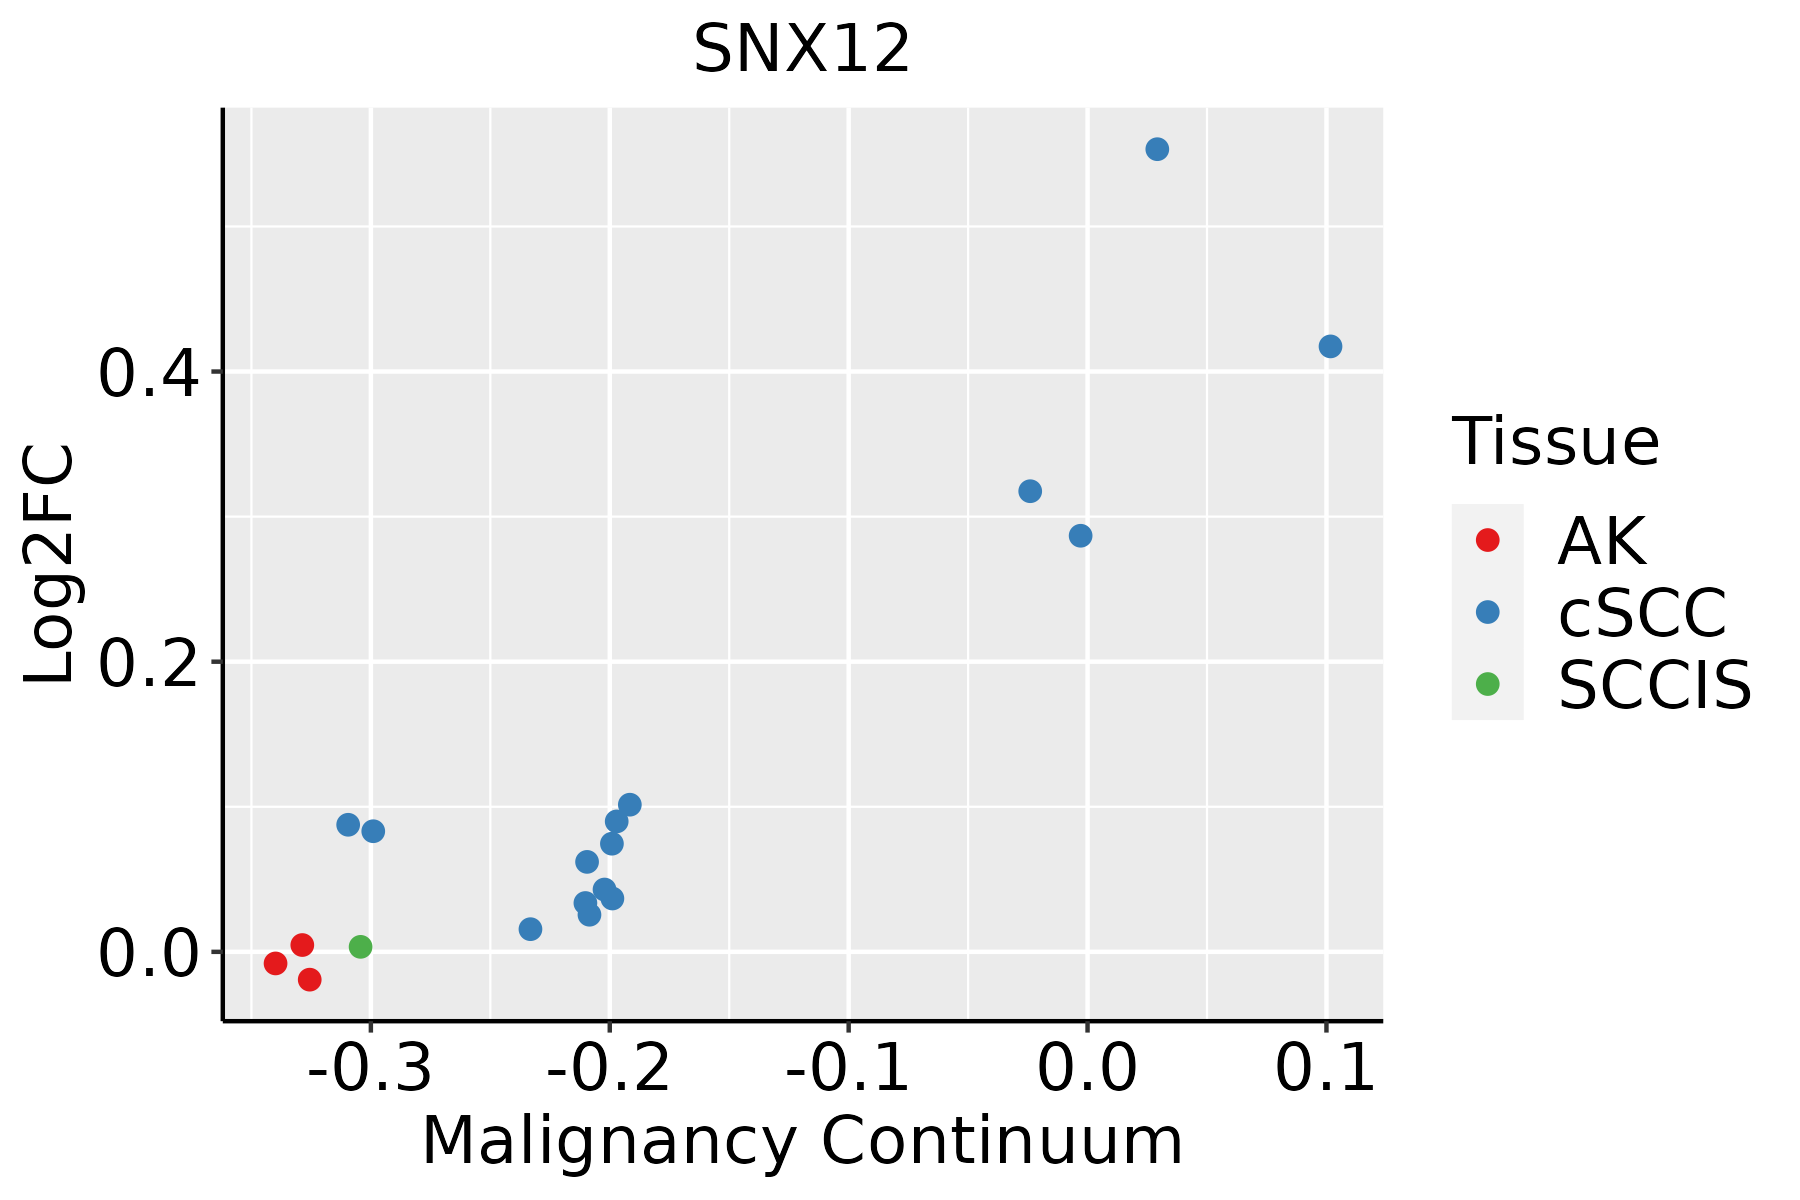 | AK: Actinic keratosis |
| cSCC: Cutaneous squamous cell carcinoma | ||
| SCCIS:squamous cell carcinoma in situ |
| ∗log2FC in expression of this searched gene in stem-like cells from each diseased tissue sample relative to stem-like cells in normal samples in each tissue plotted against the malignancy continuum. Samples are colored based on if they are from different disease stage. |
Top |
Malignant transformation related pathway analysis |
| Find out the enriched GO biological processes and KEGG pathways involved in transition from healthy to precancer to cancer |
| Tissue | Disease Stage | Enriched GO biological Processes |
| Colorectum | AD |  |
| Colorectum | SER |  |
| Colorectum | MSS |  |
| Colorectum | MSI-H |  |
| Colorectum | FAP |  |
| ∗Top 15 enriched GO BP terms are showed in the bar plot of each disease state in each tissue. Each row represents a significant GO biological process which is colored according to the -log10(p.adjust). |
| Page: 1 2 3 4 5 6 7 8 9 |
| GO ID | Tissue | Disease Stage | Description | Gene Ratio | Bg Ratio | pvalue | p.adjust | Count |
| GO:0042176 | Colorectum | AD | regulation of protein catabolic process | 160/3918 | 391/18723 | 1.06e-19 | 7.34e-17 | 160 |
| GO:0009895 | Colorectum | AD | negative regulation of catabolic process | 124/3918 | 320/18723 | 1.66e-13 | 3.35e-11 | 124 |
| GO:0048193 | Colorectum | AD | Golgi vesicle transport | 109/3918 | 296/18723 | 1.80e-10 | 1.68e-08 | 109 |
| GO:0016197 | Colorectum | AD | endosomal transport | 90/3918 | 230/18723 | 1.88e-10 | 1.73e-08 | 90 |
| GO:0042177 | Colorectum | AD | negative regulation of protein catabolic process | 55/3918 | 121/18723 | 1.19e-09 | 8.85e-08 | 55 |
| GO:0016482 | Colorectum | AD | cytosolic transport | 68/3918 | 168/18723 | 6.00e-09 | 3.72e-07 | 68 |
| GO:0098876 | Colorectum | AD | vesicle-mediated transport to the plasma membrane | 57/3918 | 136/18723 | 2.30e-08 | 1.27e-06 | 57 |
| GO:0032386 | Colorectum | AD | regulation of intracellular transport | 109/3918 | 337/18723 | 5.33e-07 | 1.95e-05 | 109 |
| GO:0042147 | Colorectum | AD | retrograde transport, endosome to Golgi | 37/3918 | 91/18723 | 1.46e-05 | 3.14e-04 | 37 |
| GO:0045861 | Colorectum | AD | negative regulation of proteolysis | 106/3918 | 351/18723 | 2.33e-05 | 4.57e-04 | 106 |
| GO:0030100 | Colorectum | AD | regulation of endocytosis | 67/3918 | 211/18723 | 1.42e-04 | 2.01e-03 | 67 |
| GO:0032456 | Colorectum | AD | endocytic recycling | 28/3918 | 73/18723 | 4.87e-04 | 5.30e-03 | 28 |
| GO:0098927 | Colorectum | AD | vesicle-mediated transport between endosomal compartments | 19/3918 | 43/18723 | 5.03e-04 | 5.43e-03 | 19 |
| GO:0051604 | Colorectum | AD | protein maturation | 85/3918 | 294/18723 | 6.73e-04 | 6.91e-03 | 85 |
| GO:0045022 | Colorectum | AD | early endosome to late endosome transport | 17/3918 | 40/18723 | 1.66e-03 | 1.38e-02 | 17 |
| GO:1903649 | Colorectum | AD | regulation of cytoplasmic transport | 13/3918 | 28/18723 | 2.22e-03 | 1.75e-02 | 13 |
| GO:0016485 | Colorectum | AD | protein processing | 63/3918 | 225/18723 | 6.77e-03 | 4.19e-02 | 63 |
| GO:00421761 | Colorectum | SER | regulation of protein catabolic process | 126/2897 | 391/18723 | 5.33e-17 | 2.52e-14 | 126 |
| GO:00323861 | Colorectum | SER | regulation of intracellular transport | 89/2897 | 337/18723 | 1.34e-07 | 7.96e-06 | 89 |
| GO:00098951 | Colorectum | SER | negative regulation of catabolic process | 84/2897 | 320/18723 | 3.93e-07 | 2.06e-05 | 84 |
| Page: 1 2 3 4 5 6 7 8 9 |
| Pathway ID | Tissue | Disease Stage | Description | Gene Ratio | Bg Ratio | pvalue | p.adjust | qvalue | Count |
| hsa04144 | Colorectum | AD | Endocytosis | 111/2092 | 251/8465 | 5.95e-12 | 1.42e-10 | 9.08e-11 | 111 |
| hsa041441 | Colorectum | AD | Endocytosis | 111/2092 | 251/8465 | 5.95e-12 | 1.42e-10 | 9.08e-11 | 111 |
| hsa041442 | Colorectum | SER | Endocytosis | 81/1580 | 251/8465 | 1.14e-07 | 2.36e-06 | 1.71e-06 | 81 |
| hsa041443 | Colorectum | SER | Endocytosis | 81/1580 | 251/8465 | 1.14e-07 | 2.36e-06 | 1.71e-06 | 81 |
| hsa041444 | Colorectum | MSS | Endocytosis | 102/1875 | 251/8465 | 1.85e-11 | 4.43e-10 | 2.71e-10 | 102 |
| hsa041445 | Colorectum | MSS | Endocytosis | 102/1875 | 251/8465 | 1.85e-11 | 4.43e-10 | 2.71e-10 | 102 |
| hsa04144210 | Esophagus | ESCC | Endocytosis | 186/4205 | 251/8465 | 9.74e-16 | 4.66e-14 | 2.39e-14 | 186 |
| hsa0414437 | Esophagus | ESCC | Endocytosis | 186/4205 | 251/8465 | 9.74e-16 | 4.66e-14 | 2.39e-14 | 186 |
| hsa0414422 | Liver | HCC | Endocytosis | 178/4020 | 251/8465 | 2.03e-14 | 5.22e-13 | 2.91e-13 | 178 |
| hsa0414432 | Liver | HCC | Endocytosis | 178/4020 | 251/8465 | 2.03e-14 | 5.22e-13 | 2.91e-13 | 178 |
| hsa0414427 | Oral cavity | OSCC | Endocytosis | 174/3704 | 251/8465 | 9.42e-17 | 4.51e-15 | 2.29e-15 | 174 |
| hsa04144112 | Oral cavity | OSCC | Endocytosis | 174/3704 | 251/8465 | 9.42e-17 | 4.51e-15 | 2.29e-15 | 174 |
| hsa0414428 | Oral cavity | LP | Endocytosis | 121/2418 | 251/8465 | 1.89e-11 | 3.70e-10 | 2.38e-10 | 121 |
| hsa0414436 | Oral cavity | LP | Endocytosis | 121/2418 | 251/8465 | 1.89e-11 | 3.70e-10 | 2.38e-10 | 121 |
| Page: 1 |
Top |
Cell-cell communication analysis |
| Identification of potential cell-cell interactions between two cell types and their ligand-receptor pairs for different disease states |
| Ligand | Receptor | LRpair | Pathway | Tissue | Disease Stage |
| Page: 1 |
Top |
Single-cell gene regulatory network inference analysis |
| Find out the significant the regulons (TFs) and the target genes of each regulon across cell types for different disease states |
| TF | Cell Type | Tissue | Disease Stage | Target Gene | RSS | Regulon Activity |
| ∗The dot plots of a searched regulon are shown for all cell subpopulations in each disease state of each tissue based on the regulon specific score inferred using pySCENIC and by calculating the average expression. |
| Page: 1 |
Top |
Somatic mutation of malignant transformation related genes |
| Annotation of somatic variants for genes involved in malignant transformation |
| Hugo Symbol | Variant Class | Variant Classification | dbSNP RS | HGVSc | HGVSp | HGVSp Short | SWISSPROT | BIOTYPE | SIFT | PolyPhen | Tumor Sample Barcode | Tissue | Histology | Sex | Age | Stage | Therapy Types | Drugs | Outcome |
| SNX12 | SNV | Missense_Mutation | novel | c.26N>A | p.Thr9Asn | p.T9N | Q9UMY4 | protein_coding | deleterious(0) | possibly_damaging(0.732) | TCGA-E2-A15A-06 | Breast | breast invasive carcinoma | Female | <65 | III/IV | Chemotherapy | cyclophosphamide | SD |
| SNX12 | SNV | Missense_Mutation | novel | c.482N>A | p.Arg161His | p.R161H | Q9UMY4 | protein_coding | deleterious(0.01) | probably_damaging(0.937) | TCGA-2W-A8YY-01 | Cervix | cervical & endocervical cancer | Female | <65 | I/II | Chemotherapy | cisplatin | CR |
| SNX12 | SNV | Missense_Mutation | novel | c.61N>A | p.Asp21Asn | p.D21N | Q9UMY4 | protein_coding | deleterious(0) | probably_damaging(0.949) | TCGA-2W-A8YY-01 | Cervix | cervical & endocervical cancer | Female | <65 | I/II | Chemotherapy | cisplatin | CR |
| SNX12 | SNV | Missense_Mutation | novel | c.202G>A | p.Val68Ile | p.V68I | Q9UMY4 | protein_coding | deleterious(0.03) | possibly_damaging(0.662) | TCGA-AA-3950-01 | Colorectum | colon adenocarcinoma | Female | >=65 | I/II | Unknown | Unknown | SD |
| SNX12 | SNV | Missense_Mutation | c.299G>A | p.Arg100Gln | p.R100Q | Q9UMY4 | protein_coding | deleterious(0.03) | possibly_damaging(0.695) | TCGA-CM-6168-01 | Colorectum | colon adenocarcinoma | Female | >=65 | I/II | Unknown | Unknown | SD | |
| SNX12 | SNV | Missense_Mutation | novel | c.167N>T | p.Thr56Ile | p.T56I | Q9UMY4 | protein_coding | deleterious(0) | probably_damaging(0.993) | TCGA-AJ-A3EK-01 | Endometrium | uterine corpus endometrioid carcinoma | Female | <65 | I/II | Chemotherapy | carboplatin | CR |
| SNX12 | SNV | Missense_Mutation | c.133N>A | p.Ala45Thr | p.A45T | Q9UMY4 | protein_coding | tolerated(0.25) | benign(0) | TCGA-AP-A056-01 | Endometrium | uterine corpus endometrioid carcinoma | Female | <65 | I/II | Unknown | Unknown | SD | |
| SNX12 | SNV | Missense_Mutation | c.466N>A | p.Val156Ile | p.V156I | Q9UMY4 | protein_coding | tolerated(0.22) | benign(0) | TCGA-B5-A0K2-01 | Endometrium | uterine corpus endometrioid carcinoma | Female | <65 | III/IV | Hormone Therapy | megace | SD | |
| SNX12 | SNV | Missense_Mutation | rs748671122 | c.349G>A | p.Glu117Lys | p.E117K | Q9UMY4 | protein_coding | deleterious(0.01) | probably_damaging(0.999) | TCGA-BS-A0UV-01 | Endometrium | uterine corpus endometrioid carcinoma | Female | <65 | III/IV | Unknown | Unknown | SD |
| SNX12 | SNV | Missense_Mutation | c.261N>T | p.Lys87Asn | p.K87N | Q9UMY4 | protein_coding | deleterious(0.02) | possibly_damaging(0.686) | TCGA-D1-A103-01 | Endometrium | uterine corpus endometrioid carcinoma | Female | >=65 | I/II | Unknown | Unknown | SD |
| Page: 1 2 |
Top |
Related drugs of malignant transformation related genes |
| Identification of chemicals and drugs interact with genes involved in malignant transfromation |
| (DGIdb 4.0) |
| Entrez ID | Symbol | Category | Interaction Types | Drug Claim Name | Drug Name | PMIDs |
| Page: 1 |

Copyright 2023-Present -The University of Texas Health Science Center at Houston |