
|
|||||
|
 | |
| |
| |
| |
| |
| |
|
Gene: SNX10 |
Gene summary for SNX10 |
| Gene information | Species | Human | Gene symbol | SNX10 | Gene ID | 29887 |
| Gene name | sorting nexin 10 | |
| Gene Alias | OPTB8 | |
| Cytomap | 7p15.2 | |
| Gene Type | protein-coding | GO ID | GO:0001501 | UniProtAcc | A0A024RA70 |
Top |
Malignant transformation analysis |
| Identification of the aberrant gene expression in precancerous and cancerous lesions by comparing the gene expression of stem-like cells in diseased tissues with normal stem cells |
| Entrez ID | Symbol | Replicates | Species | Organ | Tissue | Adj P-value | Log2FC | Malignancy |
| 29887 | SNX10 | LZE4T | Human | Esophagus | ESCC | 9.98e-09 | 2.78e-01 | 0.0811 |
| 29887 | SNX10 | LZE6T | Human | Esophagus | ESCC | 7.70e-05 | 3.53e-01 | 0.0845 |
| 29887 | SNX10 | P2T-E | Human | Esophagus | ESCC | 3.90e-42 | 6.87e-01 | 0.1177 |
| 29887 | SNX10 | P4T-E | Human | Esophagus | ESCC | 2.31e-16 | 4.30e-01 | 0.1323 |
| 29887 | SNX10 | P5T-E | Human | Esophagus | ESCC | 7.31e-14 | 2.83e-01 | 0.1327 |
| 29887 | SNX10 | P8T-E | Human | Esophagus | ESCC | 4.30e-10 | 2.16e-01 | 0.0889 |
| 29887 | SNX10 | P9T-E | Human | Esophagus | ESCC | 3.75e-04 | 2.00e-01 | 0.1131 |
| 29887 | SNX10 | P10T-E | Human | Esophagus | ESCC | 5.22e-08 | 2.01e-01 | 0.116 |
| 29887 | SNX10 | P11T-E | Human | Esophagus | ESCC | 1.60e-12 | 5.72e-01 | 0.1426 |
| 29887 | SNX10 | P16T-E | Human | Esophagus | ESCC | 3.87e-12 | 3.15e-01 | 0.1153 |
| 29887 | SNX10 | P17T-E | Human | Esophagus | ESCC | 2.28e-04 | 2.83e-01 | 0.1278 |
| 29887 | SNX10 | P19T-E | Human | Esophagus | ESCC | 3.42e-06 | 5.17e-01 | 0.1662 |
| 29887 | SNX10 | P20T-E | Human | Esophagus | ESCC | 5.36e-10 | 3.17e-01 | 0.1124 |
| 29887 | SNX10 | P21T-E | Human | Esophagus | ESCC | 1.09e-22 | 4.52e-01 | 0.1617 |
| 29887 | SNX10 | P22T-E | Human | Esophagus | ESCC | 1.59e-30 | 5.03e-01 | 0.1236 |
| 29887 | SNX10 | P24T-E | Human | Esophagus | ESCC | 1.13e-12 | 3.42e-01 | 0.1287 |
| 29887 | SNX10 | P26T-E | Human | Esophagus | ESCC | 2.13e-27 | 5.89e-01 | 0.1276 |
| 29887 | SNX10 | P27T-E | Human | Esophagus | ESCC | 5.66e-08 | 2.50e-01 | 0.1055 |
| 29887 | SNX10 | P28T-E | Human | Esophagus | ESCC | 7.98e-13 | 2.58e-01 | 0.1149 |
| 29887 | SNX10 | P32T-E | Human | Esophagus | ESCC | 6.56e-15 | 3.50e-01 | 0.1666 |
| Page: 1 2 3 4 |
| Tissue | Expression Dynamics | Abbreviation |
| Esophagus | 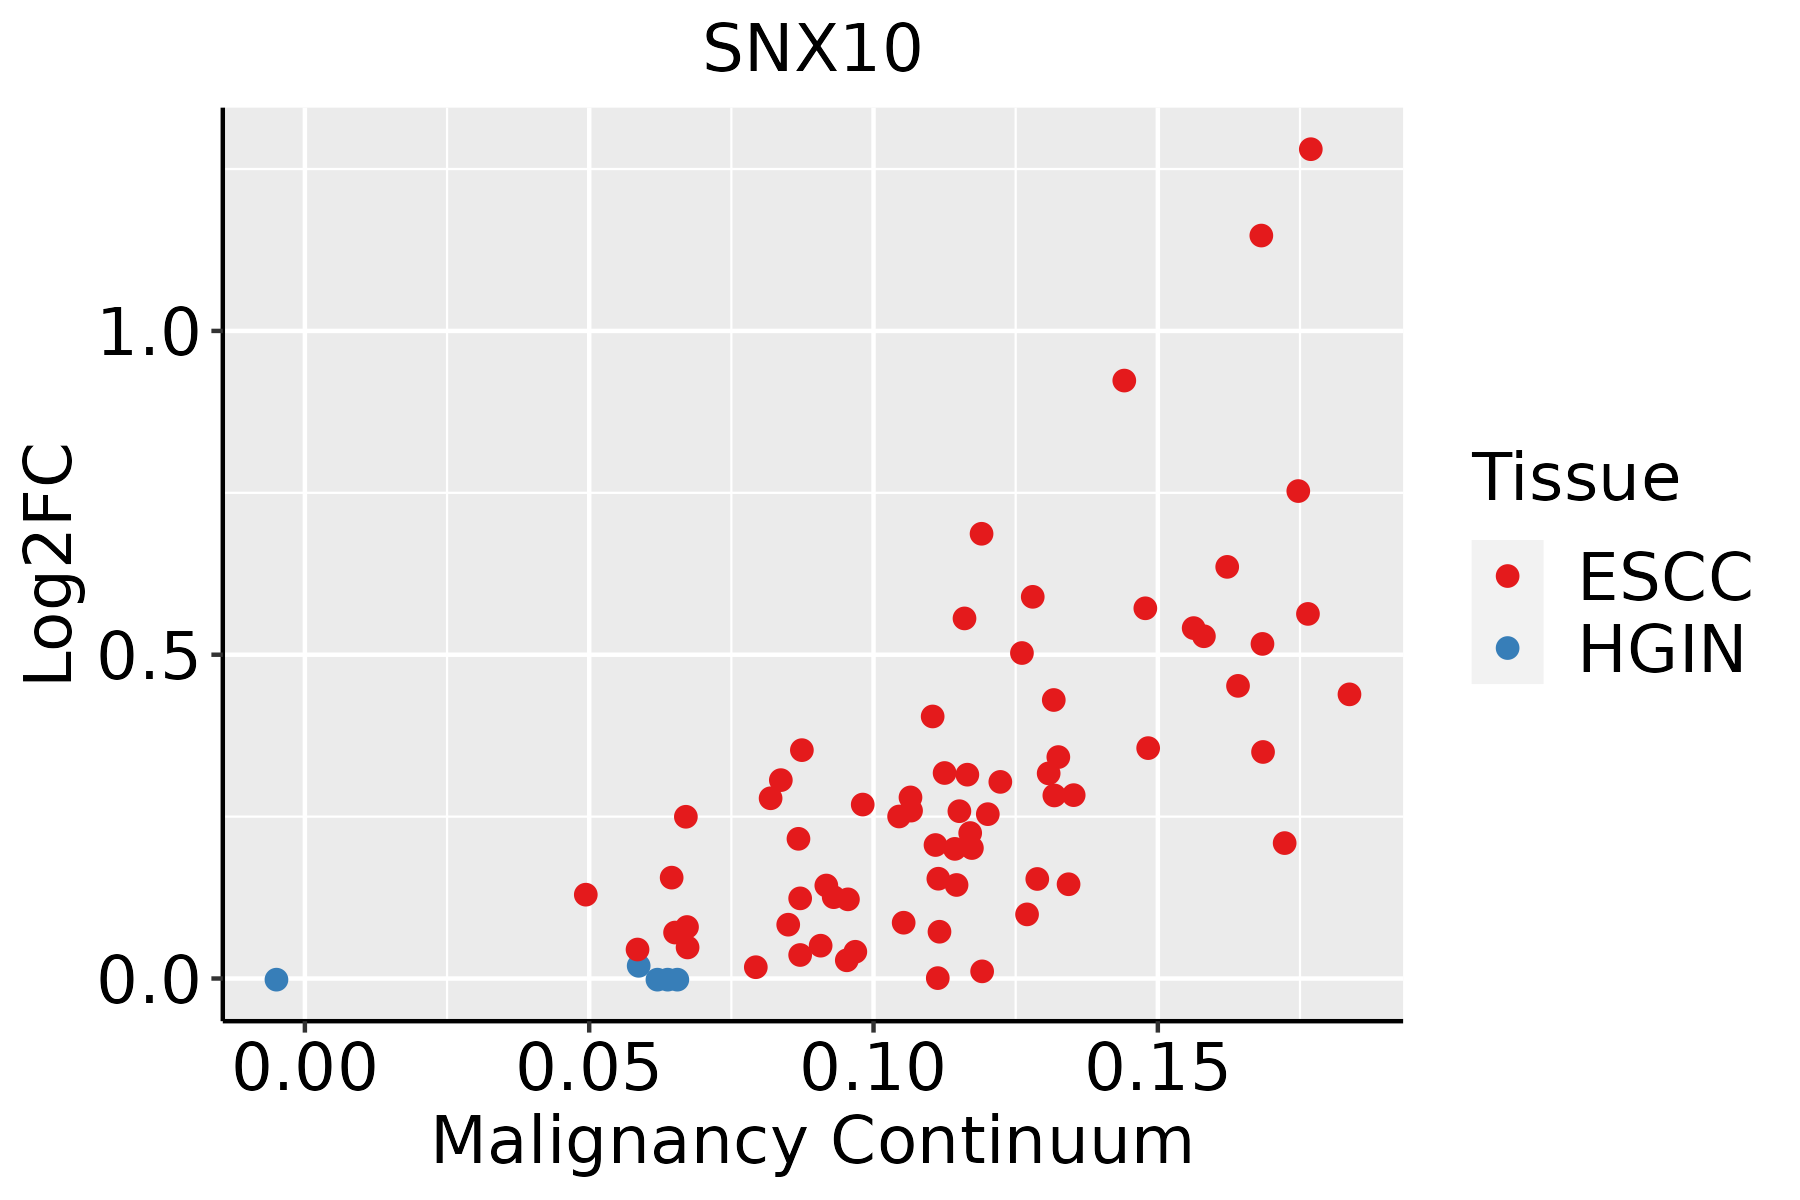 | ESCC: Esophageal squamous cell carcinoma |
| HGIN: High-grade intraepithelial neoplasias | ||
| LGIN: Low-grade intraepithelial neoplasias | ||
| Liver |  | HCC: Hepatocellular carcinoma |
| NAFLD: Non-alcoholic fatty liver disease | ||
| Oral Cavity | 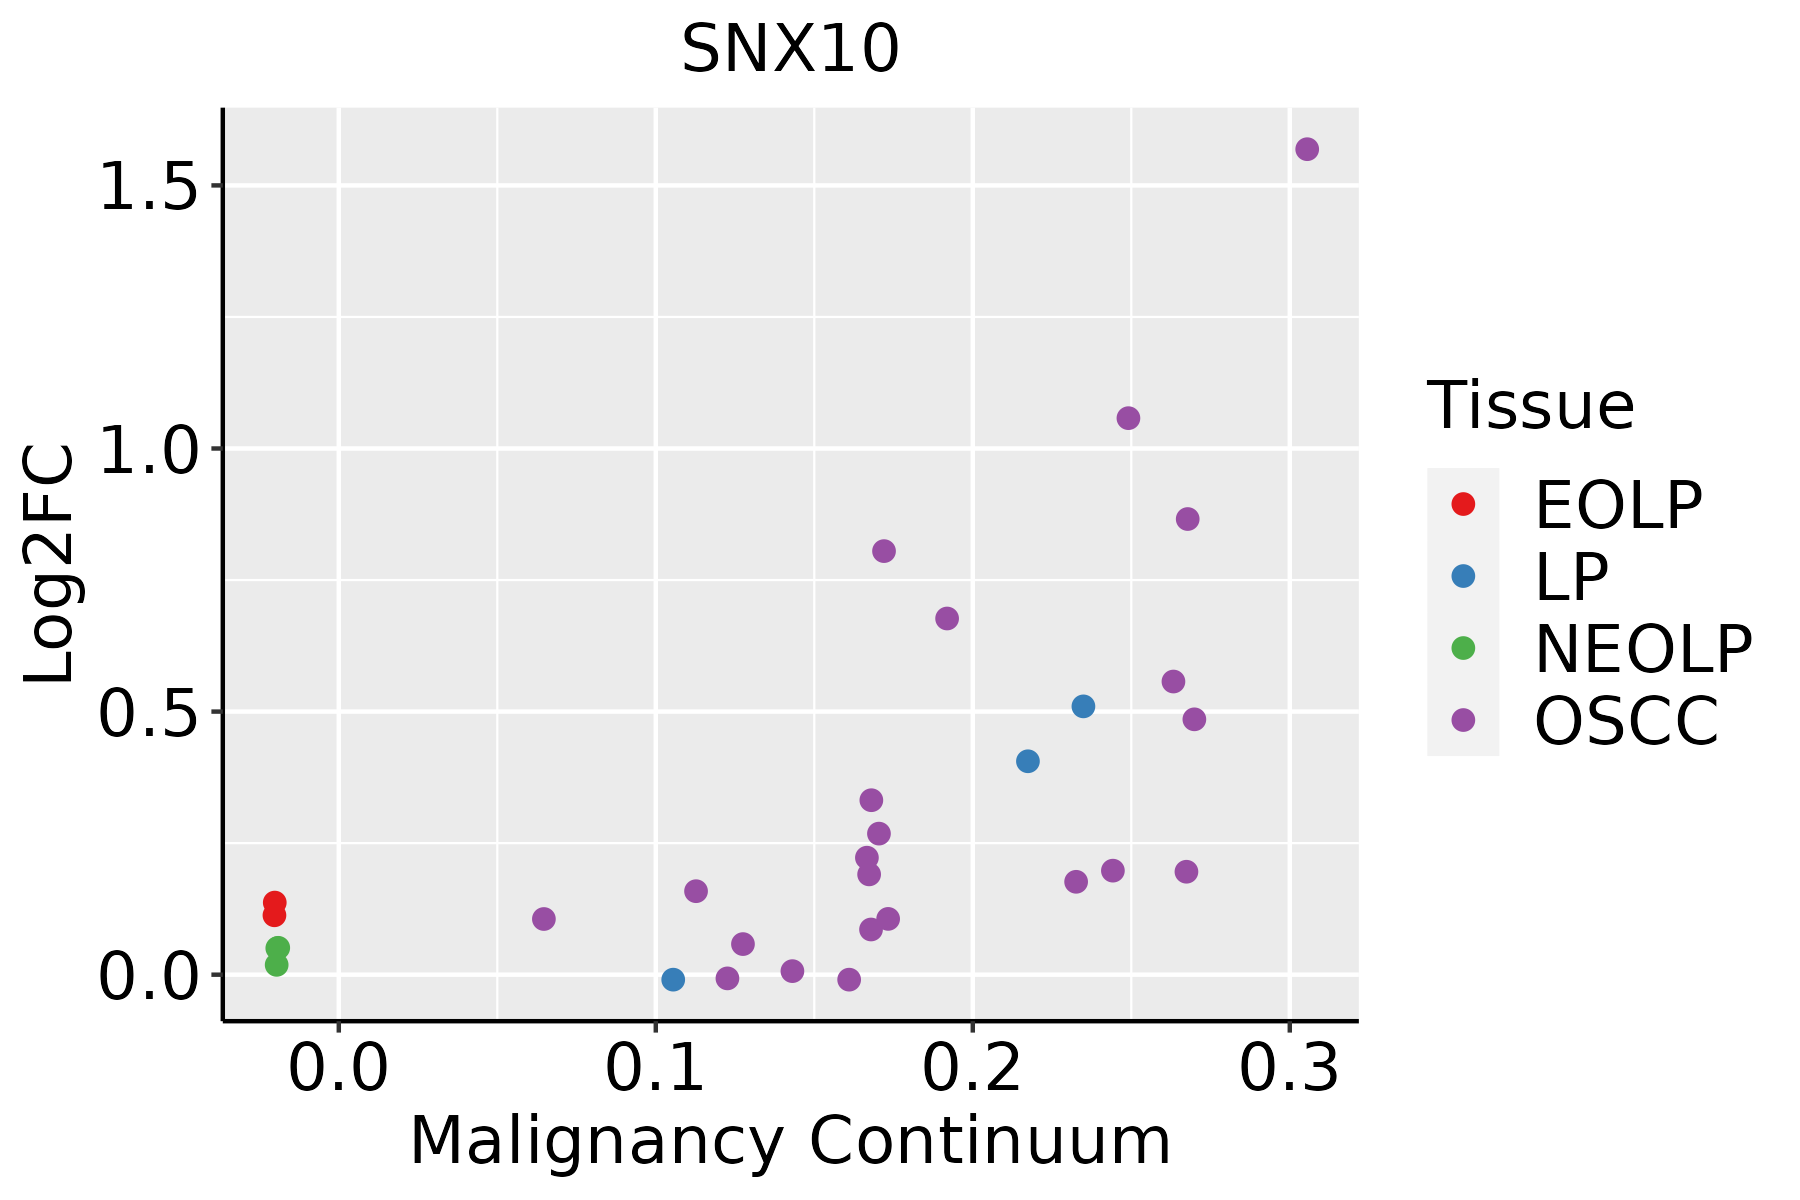 | EOLP: Erosive Oral lichen planus |
| LP: leukoplakia | ||
| NEOLP: Non-erosive oral lichen planus | ||
| OSCC: Oral squamous cell carcinoma |
| ∗log2FC in expression of this searched gene in stem-like cells from each diseased tissue sample relative to stem-like cells in normal samples in each tissue plotted against the malignancy continuum. Samples are colored based on if they are from different disease stage. |
Top |
Malignant transformation related pathway analysis |
| Find out the enriched GO biological processes and KEGG pathways involved in transition from healthy to precancer to cancer |
| Tissue | Disease Stage | Enriched GO biological Processes |
| Colorectum | AD |  |
| Colorectum | SER |  |
| Colorectum | MSS |  |
| Colorectum | MSI-H |  |
| Colorectum | FAP |  |
| ∗Top 15 enriched GO BP terms are showed in the bar plot of each disease state in each tissue. Each row represents a significant GO biological process which is colored according to the -log10(p.adjust). |
| Page: 1 2 3 4 5 6 7 8 9 |
| GO ID | Tissue | Disease Stage | Description | Gene Ratio | Bg Ratio | pvalue | p.adjust | Count |
| GO:001605014 | Esophagus | ESCC | vesicle organization | 211/8552 | 300/18723 | 2.85e-18 | 2.87e-16 | 211 |
| GO:0030099111 | Esophagus | ESCC | myeloid cell differentiation | 232/8552 | 381/18723 | 1.22e-09 | 2.90e-08 | 232 |
| GO:000703214 | Esophagus | ESCC | endosome organization | 61/8552 | 82/18723 | 1.13e-07 | 1.85e-06 | 61 |
| GO:00726985 | Esophagus | ESCC | protein localization to microtubule cytoskeleton | 43/8552 | 54/18723 | 3.28e-07 | 4.61e-06 | 43 |
| GO:00443804 | Esophagus | ESCC | protein localization to cytoskeleton | 45/8552 | 58/18723 | 6.89e-07 | 8.99e-06 | 45 |
| GO:000257317 | Esophagus | ESCC | myeloid leukocyte differentiation | 128/8552 | 208/18723 | 2.75e-06 | 3.15e-05 | 128 |
| GO:000150317 | Esophagus | ESCC | ossification | 232/8552 | 408/18723 | 3.00e-06 | 3.40e-05 | 232 |
| GO:19055086 | Esophagus | ESCC | protein localization to microtubule organizing center | 28/8552 | 35/18723 | 3.40e-05 | 2.78e-04 | 28 |
| GO:00715396 | Esophagus | ESCC | protein localization to centrosome | 26/8552 | 33/18723 | 1.06e-04 | 7.43e-04 | 26 |
| GO:00315299 | Esophagus | ESCC | ruffle organization | 39/8552 | 56/18723 | 2.44e-04 | 1.51e-03 | 39 |
| GO:00971789 | Esophagus | ESCC | ruffle assembly | 32/8552 | 44/18723 | 2.50e-04 | 1.54e-03 | 32 |
| GO:199082316 | Esophagus | ESCC | response to leukemia inhibitory factor | 60/8552 | 95/18723 | 4.41e-04 | 2.48e-03 | 60 |
| GO:199083015 | Esophagus | ESCC | cellular response to leukemia inhibitory factor | 59/8552 | 94/18723 | 6.19e-04 | 3.32e-03 | 59 |
| GO:00603485 | Esophagus | ESCC | bone development | 115/8552 | 205/18723 | 1.67e-03 | 7.72e-03 | 115 |
| GO:00303165 | Esophagus | ESCC | osteoclast differentiation | 54/8552 | 94/18723 | 1.43e-02 | 4.65e-02 | 54 |
| GO:00160505 | Liver | NAFLD | vesicle organization | 50/1882 | 300/18723 | 2.42e-04 | 4.06e-03 | 50 |
| GO:00715394 | Liver | NAFLD | protein localization to centrosome | 10/1882 | 33/18723 | 1.09e-03 | 1.27e-02 | 10 |
| GO:19055084 | Liver | NAFLD | protein localization to microtubule organizing center | 10/1882 | 35/18723 | 1.79e-03 | 1.85e-02 | 10 |
| GO:00300997 | Liver | NAFLD | myeloid cell differentiation | 55/1882 | 381/18723 | 3.86e-03 | 3.28e-02 | 55 |
| GO:00603481 | Liver | NAFLD | bone development | 33/1882 | 205/18723 | 4.45e-03 | 3.60e-02 | 33 |
| Page: 1 2 3 |
| Pathway ID | Tissue | Disease Stage | Description | Gene Ratio | Bg Ratio | pvalue | p.adjust | qvalue | Count |
| Page: 1 |
Top |
Cell-cell communication analysis |
| Identification of potential cell-cell interactions between two cell types and their ligand-receptor pairs for different disease states |
| Ligand | Receptor | LRpair | Pathway | Tissue | Disease Stage |
| Page: 1 |
Top |
Single-cell gene regulatory network inference analysis |
| Find out the significant the regulons (TFs) and the target genes of each regulon across cell types for different disease states |
| TF | Cell Type | Tissue | Disease Stage | Target Gene | RSS | Regulon Activity |
| ∗The dot plots of a searched regulon are shown for all cell subpopulations in each disease state of each tissue based on the regulon specific score inferred using pySCENIC and by calculating the average expression. |
| Page: 1 |
Top |
Somatic mutation of malignant transformation related genes |
| Annotation of somatic variants for genes involved in malignant transformation |
| Hugo Symbol | Variant Class | Variant Classification | dbSNP RS | HGVSc | HGVSp | HGVSp Short | SWISSPROT | BIOTYPE | SIFT | PolyPhen | Tumor Sample Barcode | Tissue | Histology | Sex | Age | Stage | Therapy Types | Drugs | Outcome |
| SNX10 | SNV | Missense_Mutation | c.298G>A | p.Asp100Asn | p.D100N | Q9Y5X0 | protein_coding | tolerated(0.23) | possibly_damaging(0.5) | TCGA-C8-A137-01 | Breast | breast invasive carcinoma | Female | <65 | I/II | Unknown | Unknown | PD | |
| SNX10 | SNV | Missense_Mutation | c.587C>G | p.Thr196Arg | p.T196R | Q9Y5X0 | protein_coding | tolerated_low_confidence(0.11) | benign(0.01) | TCGA-E2-A158-01 | Breast | breast invasive carcinoma | Female | <65 | I/II | Chemotherapy | arimidex | SD | |
| SNX10 | SNV | Missense_Mutation | c.557A>G | p.Asp186Gly | p.D186G | Q9Y5X0 | protein_coding | tolerated(0.08) | benign(0.001) | TCGA-E9-A1NE-01 | Breast | breast invasive carcinoma | Female | <65 | I/II | Chemotherapy | doxorubicin | CR | |
| SNX10 | SNV | Missense_Mutation | c.448N>T | p.Ala150Ser | p.A150S | Q9Y5X0 | protein_coding | tolerated(0.08) | probably_damaging(0.968) | TCGA-GM-A2DB-01 | Breast | breast invasive carcinoma | Female | <65 | I/II | Chemotherapy | taxol | CR | |
| SNX10 | insertion | Frame_Shift_Ins | novel | c.159_160insGATCTCAG | p.Tyr54AspfsTer10 | p.Y54Dfs*10 | Q9Y5X0 | protein_coding | TCGA-AO-A03R-01 | Breast | breast invasive carcinoma | Female | <65 | I/II | Chemotherapy | doxorubicin | SD | ||
| SNX10 | SNV | Missense_Mutation | novel | c.164N>A | p.Arg55Lys | p.R55K | Q9Y5X0 | protein_coding | tolerated(0.14) | benign(0.003) | TCGA-AZ-4315-01 | Colorectum | colon adenocarcinoma | Male | <65 | I/II | Unknown | Unknown | SD |
| SNX10 | insertion | Frame_Shift_Ins | novel | c.481_482insGCTCTGT | p.Glu161GlyfsTer10 | p.E161Gfs*10 | Q9Y5X0 | protein_coding | TCGA-AM-5820-01 | Colorectum | colon adenocarcinoma | Female | <65 | I/II | Unknown | Unknown | SD | ||
| SNX10 | SNV | Missense_Mutation | novel | c.7C>T | p.Pro3Ser | p.P3S | Q9Y5X0 | protein_coding | tolerated(0.19) | probably_damaging(0.968) | TCGA-A5-A0G1-01 | Endometrium | uterine corpus endometrioid carcinoma | Female | >=65 | I/II | Unknown | Unknown | SD |
| SNX10 | SNV | Missense_Mutation | novel | c.51T>A | p.Asp17Glu | p.D17E | Q9Y5X0 | protein_coding | deleterious(0.03) | probably_damaging(0.987) | TCGA-A5-A0G1-01 | Endometrium | uterine corpus endometrioid carcinoma | Female | >=65 | I/II | Unknown | Unknown | SD |
| SNX10 | SNV | Missense_Mutation | rs781164071 | c.395N>T | p.Ala132Val | p.A132V | Q9Y5X0 | protein_coding | deleterious(0.02) | probably_damaging(0.97) | TCGA-AP-A059-01 | Endometrium | uterine corpus endometrioid carcinoma | Female | >=65 | I/II | Unknown | Unknown | SD |
| Page: 1 2 3 |
Top |
Related drugs of malignant transformation related genes |
| Identification of chemicals and drugs interact with genes involved in malignant transfromation |
| (DGIdb 4.0) |
| Entrez ID | Symbol | Category | Interaction Types | Drug Claim Name | Drug Name | PMIDs |
| Page: 1 |

Copyright 2023-Present -The University of Texas Health Science Center at Houston |