
|
|||||
|
 | |
| |
| |
| |
| |
| |
|
Gene: SNX1 |
Gene summary for SNX1 |
| Gene information | Species | Human | Gene symbol | SNX1 | Gene ID | 6642 |
| Gene name | sorting nexin 1 | |
| Gene Alias | HsT17379 | |
| Cytomap | 15q22.31 | |
| Gene Type | protein-coding | GO ID | GO:0000902 | UniProtAcc | Q13596 |
Top |
Malignant transformation analysis |
| Identification of the aberrant gene expression in precancerous and cancerous lesions by comparing the gene expression of stem-like cells in diseased tissues with normal stem cells |
| Entrez ID | Symbol | Replicates | Species | Organ | Tissue | Adj P-value | Log2FC | Malignancy |
| 6642 | SNX1 | LZE2T | Human | Esophagus | ESCC | 4.47e-02 | 4.23e-01 | 0.082 |
| 6642 | SNX1 | LZE4T | Human | Esophagus | ESCC | 8.41e-14 | 4.15e-01 | 0.0811 |
| 6642 | SNX1 | LZE7T | Human | Esophagus | ESCC | 3.76e-09 | 6.14e-01 | 0.0667 |
| 6642 | SNX1 | LZE8T | Human | Esophagus | ESCC | 5.92e-09 | 2.21e-01 | 0.067 |
| 6642 | SNX1 | LZE20T | Human | Esophagus | ESCC | 3.91e-05 | 1.67e-01 | 0.0662 |
| 6642 | SNX1 | LZE24T | Human | Esophagus | ESCC | 4.38e-22 | 3.92e-01 | 0.0596 |
| 6642 | SNX1 | LZE21T | Human | Esophagus | ESCC | 1.90e-05 | 2.02e-01 | 0.0655 |
| 6642 | SNX1 | LZE6T | Human | Esophagus | ESCC | 9.07e-05 | 2.80e-01 | 0.0845 |
| 6642 | SNX1 | P1T-E | Human | Esophagus | ESCC | 1.25e-08 | 6.16e-01 | 0.0875 |
| 6642 | SNX1 | P2T-E | Human | Esophagus | ESCC | 5.33e-31 | 7.67e-01 | 0.1177 |
| 6642 | SNX1 | P4T-E | Human | Esophagus | ESCC | 2.54e-29 | 8.41e-01 | 0.1323 |
| 6642 | SNX1 | P5T-E | Human | Esophagus | ESCC | 5.68e-20 | 3.36e-01 | 0.1327 |
| 6642 | SNX1 | P8T-E | Human | Esophagus | ESCC | 3.60e-40 | 8.54e-01 | 0.0889 |
| 6642 | SNX1 | P9T-E | Human | Esophagus | ESCC | 7.52e-12 | 3.67e-01 | 0.1131 |
| 6642 | SNX1 | P10T-E | Human | Esophagus | ESCC | 6.44e-35 | 6.55e-01 | 0.116 |
| 6642 | SNX1 | P11T-E | Human | Esophagus | ESCC | 6.28e-10 | 6.03e-01 | 0.1426 |
| 6642 | SNX1 | P12T-E | Human | Esophagus | ESCC | 9.19e-40 | 8.10e-01 | 0.1122 |
| 6642 | SNX1 | P15T-E | Human | Esophagus | ESCC | 5.68e-52 | 1.11e+00 | 0.1149 |
| 6642 | SNX1 | P16T-E | Human | Esophagus | ESCC | 1.09e-74 | 2.24e+00 | 0.1153 |
| 6642 | SNX1 | P17T-E | Human | Esophagus | ESCC | 9.76e-07 | 4.25e-01 | 0.1278 |
| Page: 1 2 3 4 5 6 7 |
| Tissue | Expression Dynamics | Abbreviation |
| Esophagus | 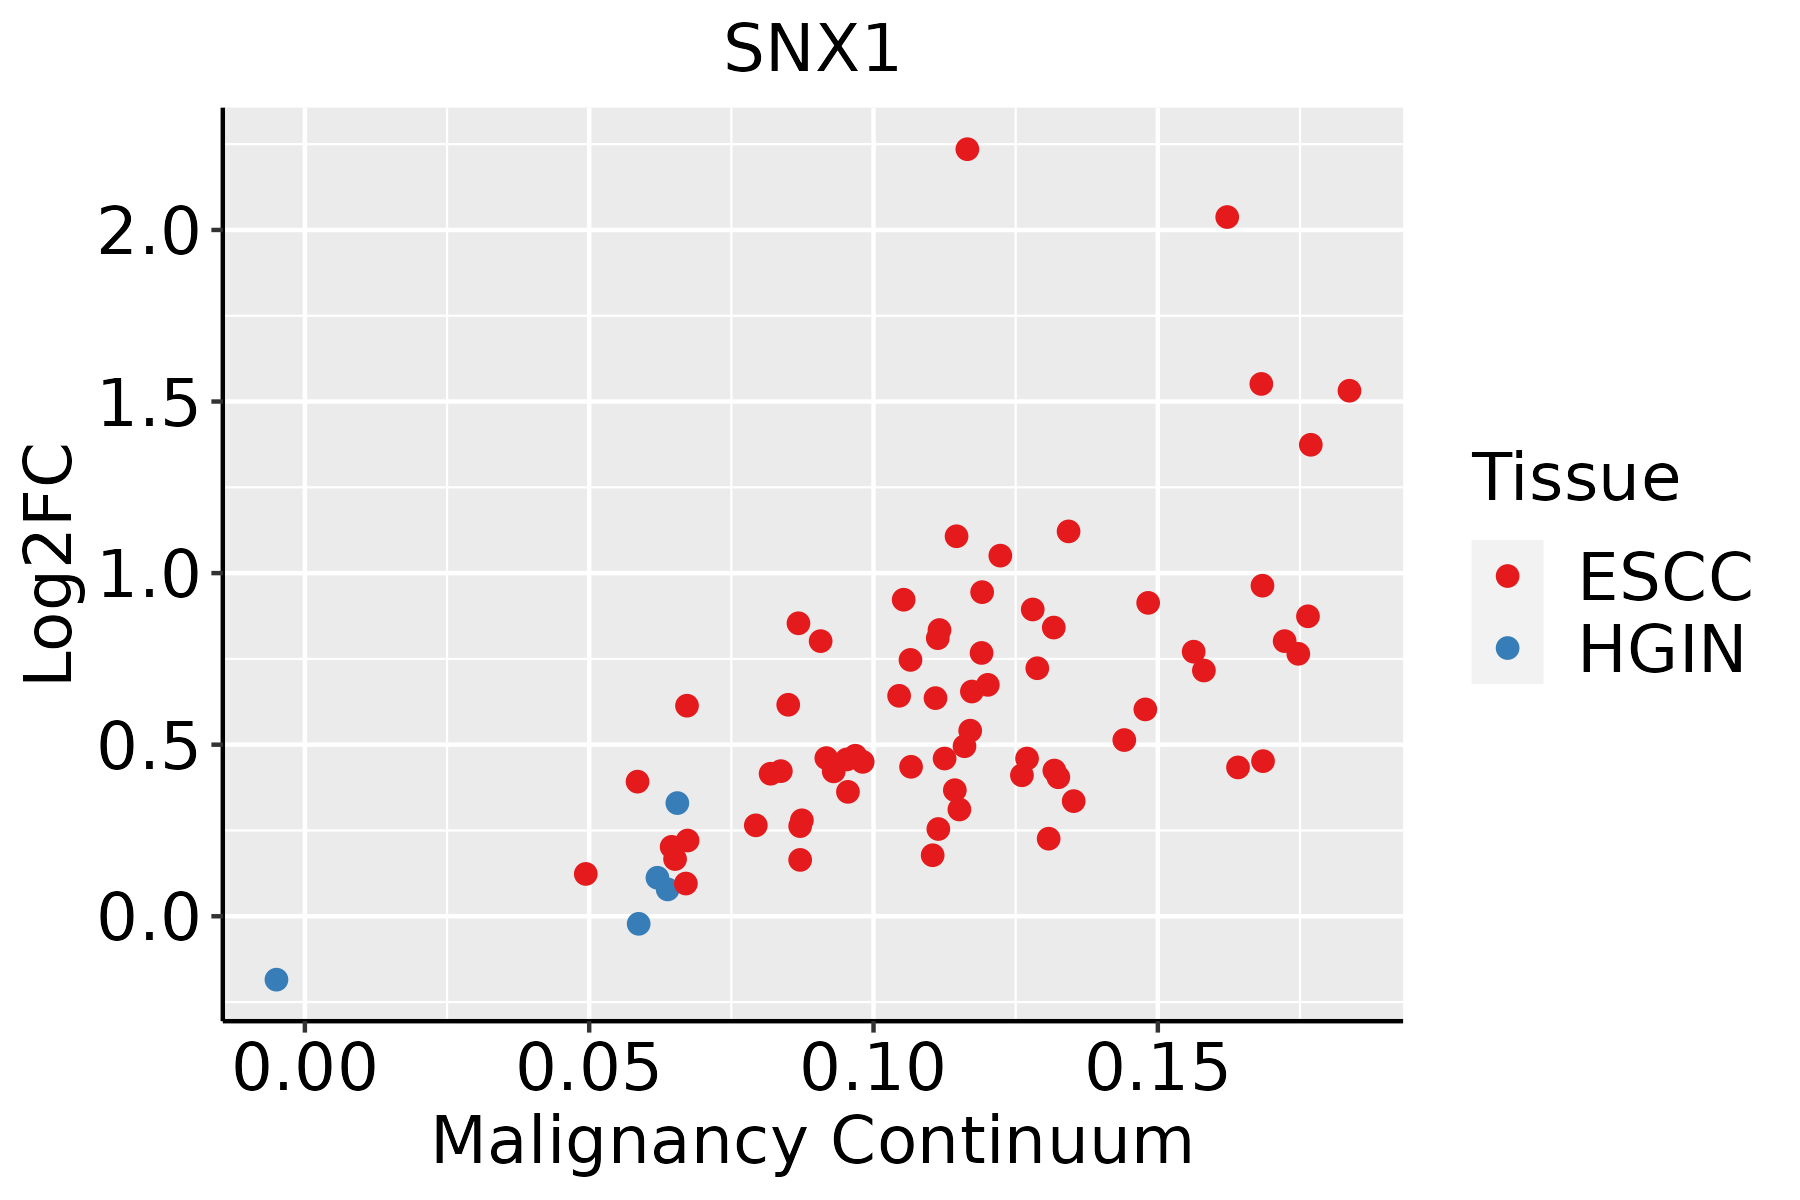 | ESCC: Esophageal squamous cell carcinoma |
| HGIN: High-grade intraepithelial neoplasias | ||
| LGIN: Low-grade intraepithelial neoplasias | ||
| Liver | 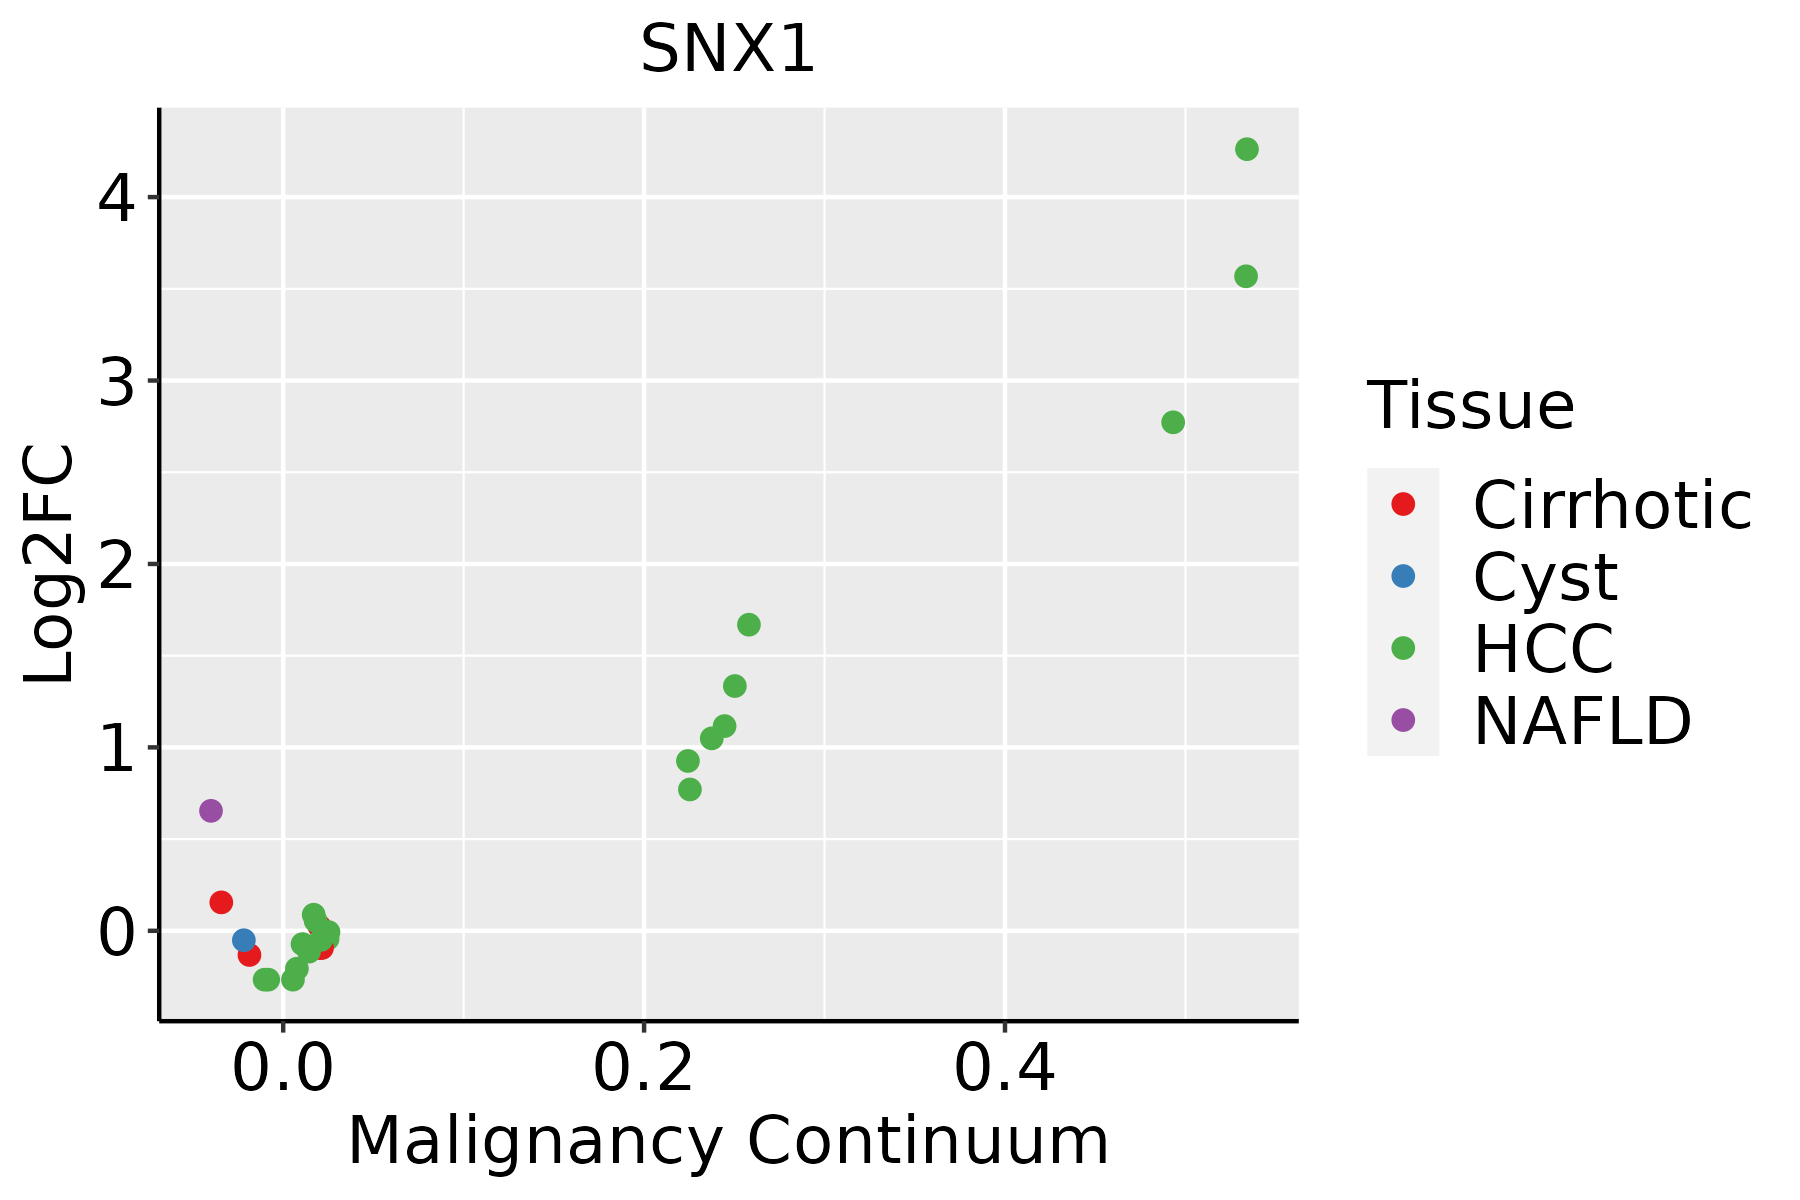 | HCC: Hepatocellular carcinoma |
| NAFLD: Non-alcoholic fatty liver disease | ||
| Oral Cavity | 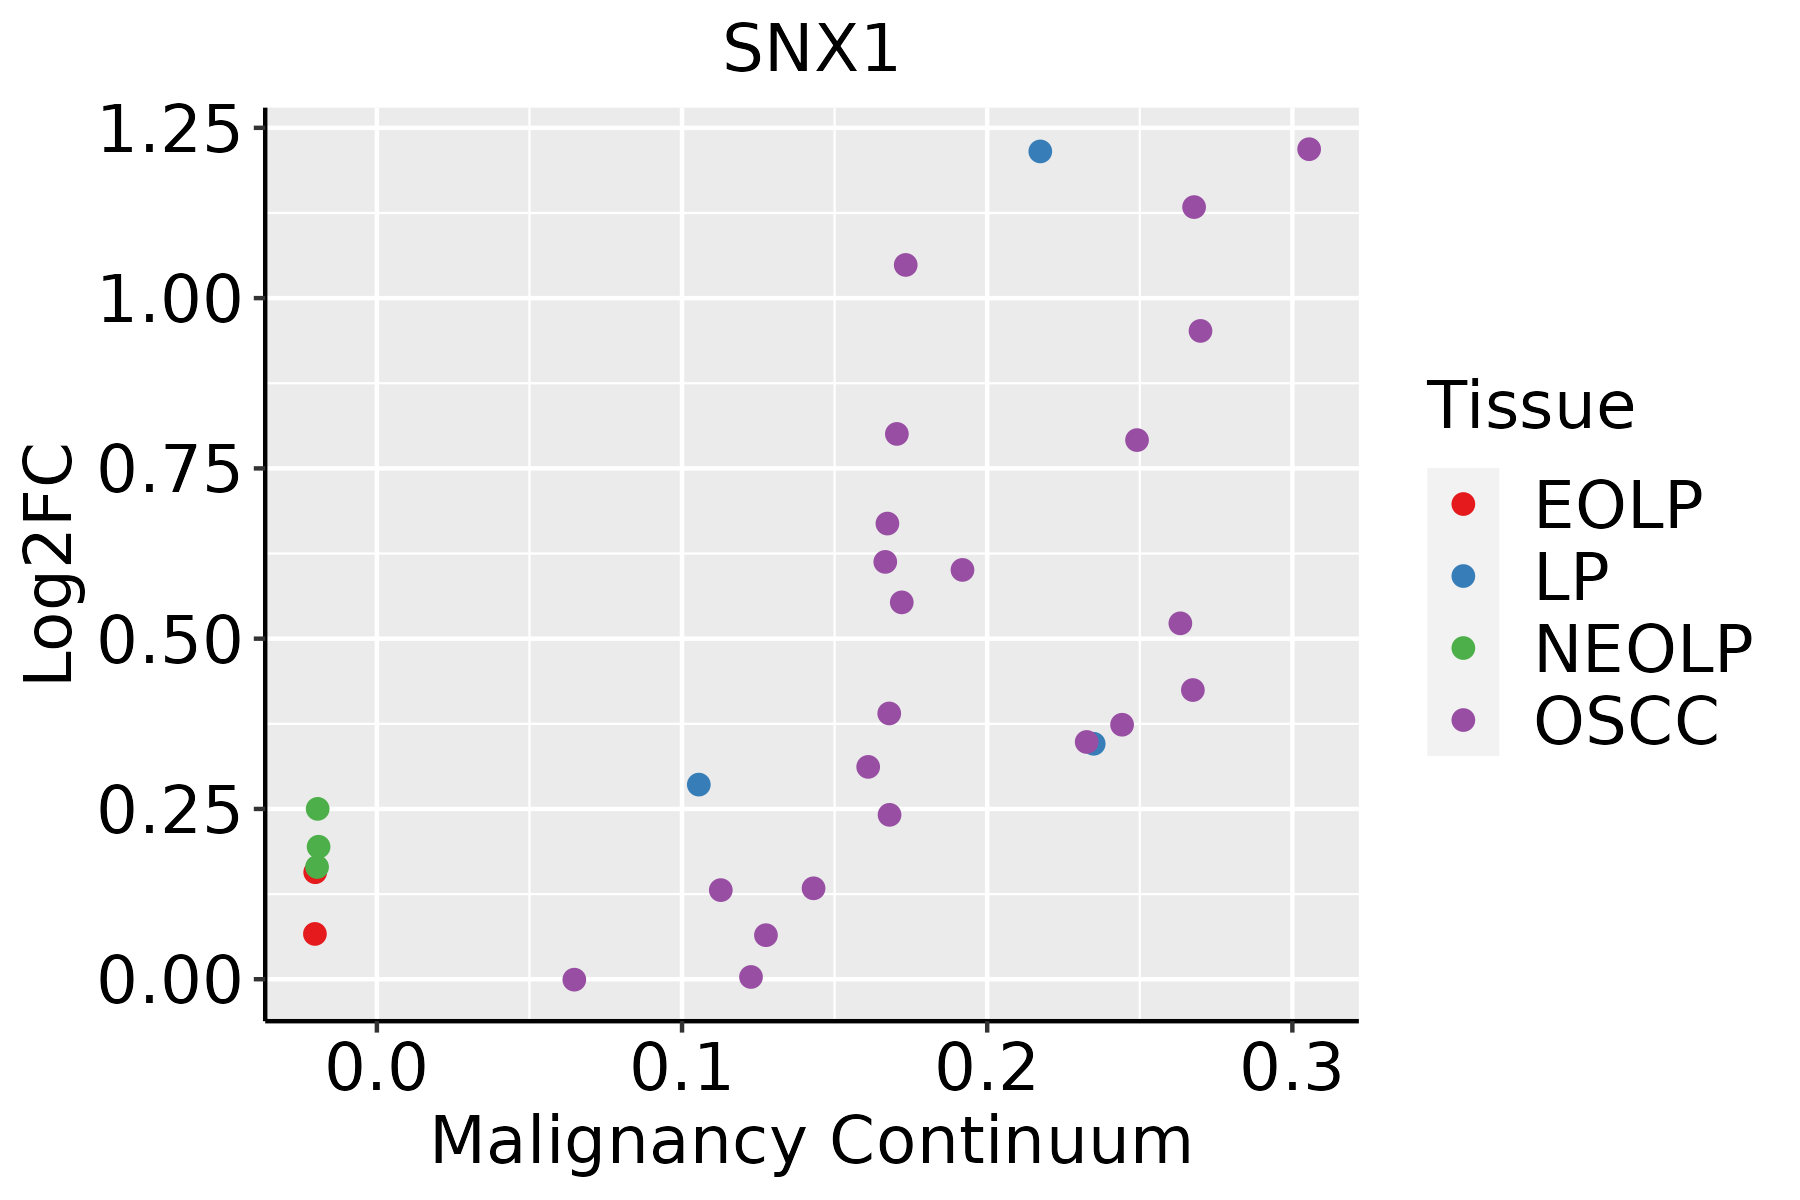 | EOLP: Erosive Oral lichen planus |
| LP: leukoplakia | ||
| NEOLP: Non-erosive oral lichen planus | ||
| OSCC: Oral squamous cell carcinoma | ||
| Prostate | 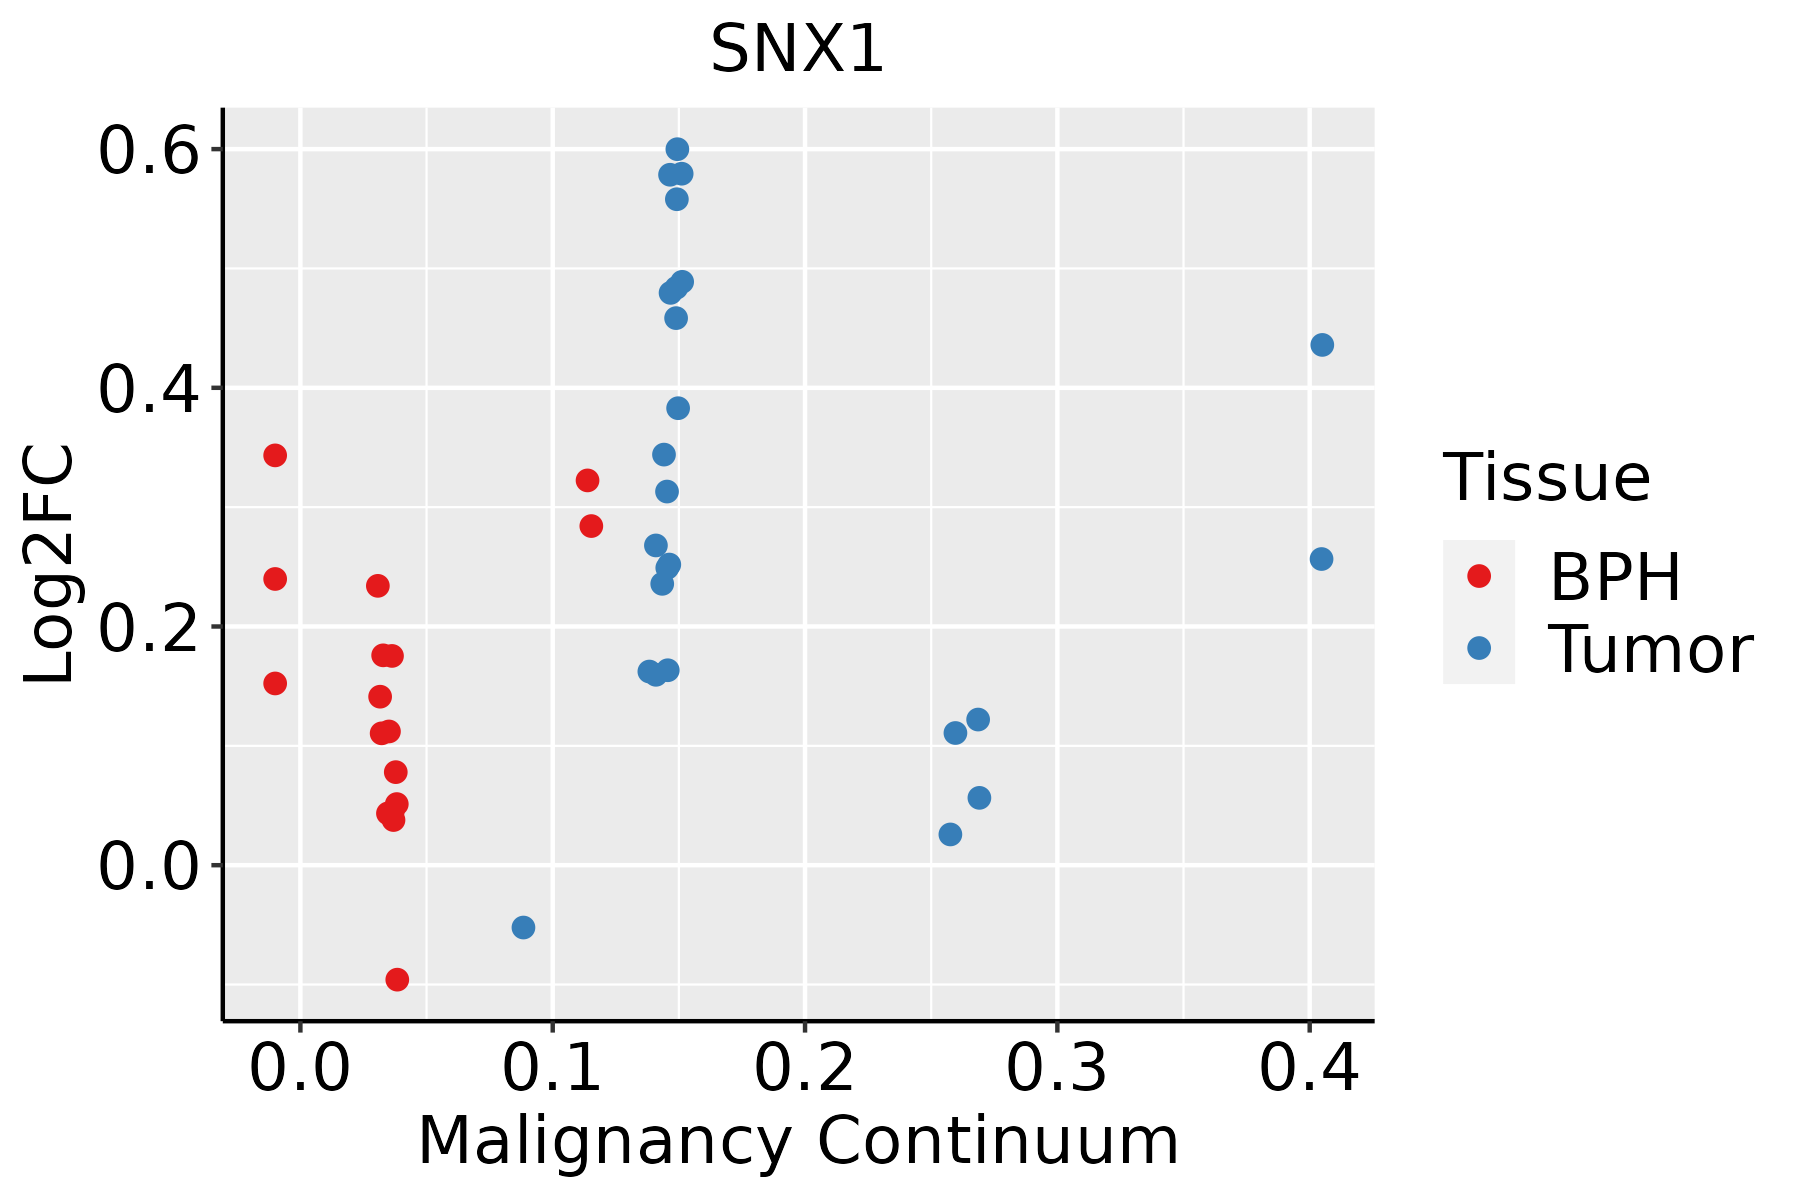 | BPH: Benign Prostatic Hyperplasia |
| Skin | 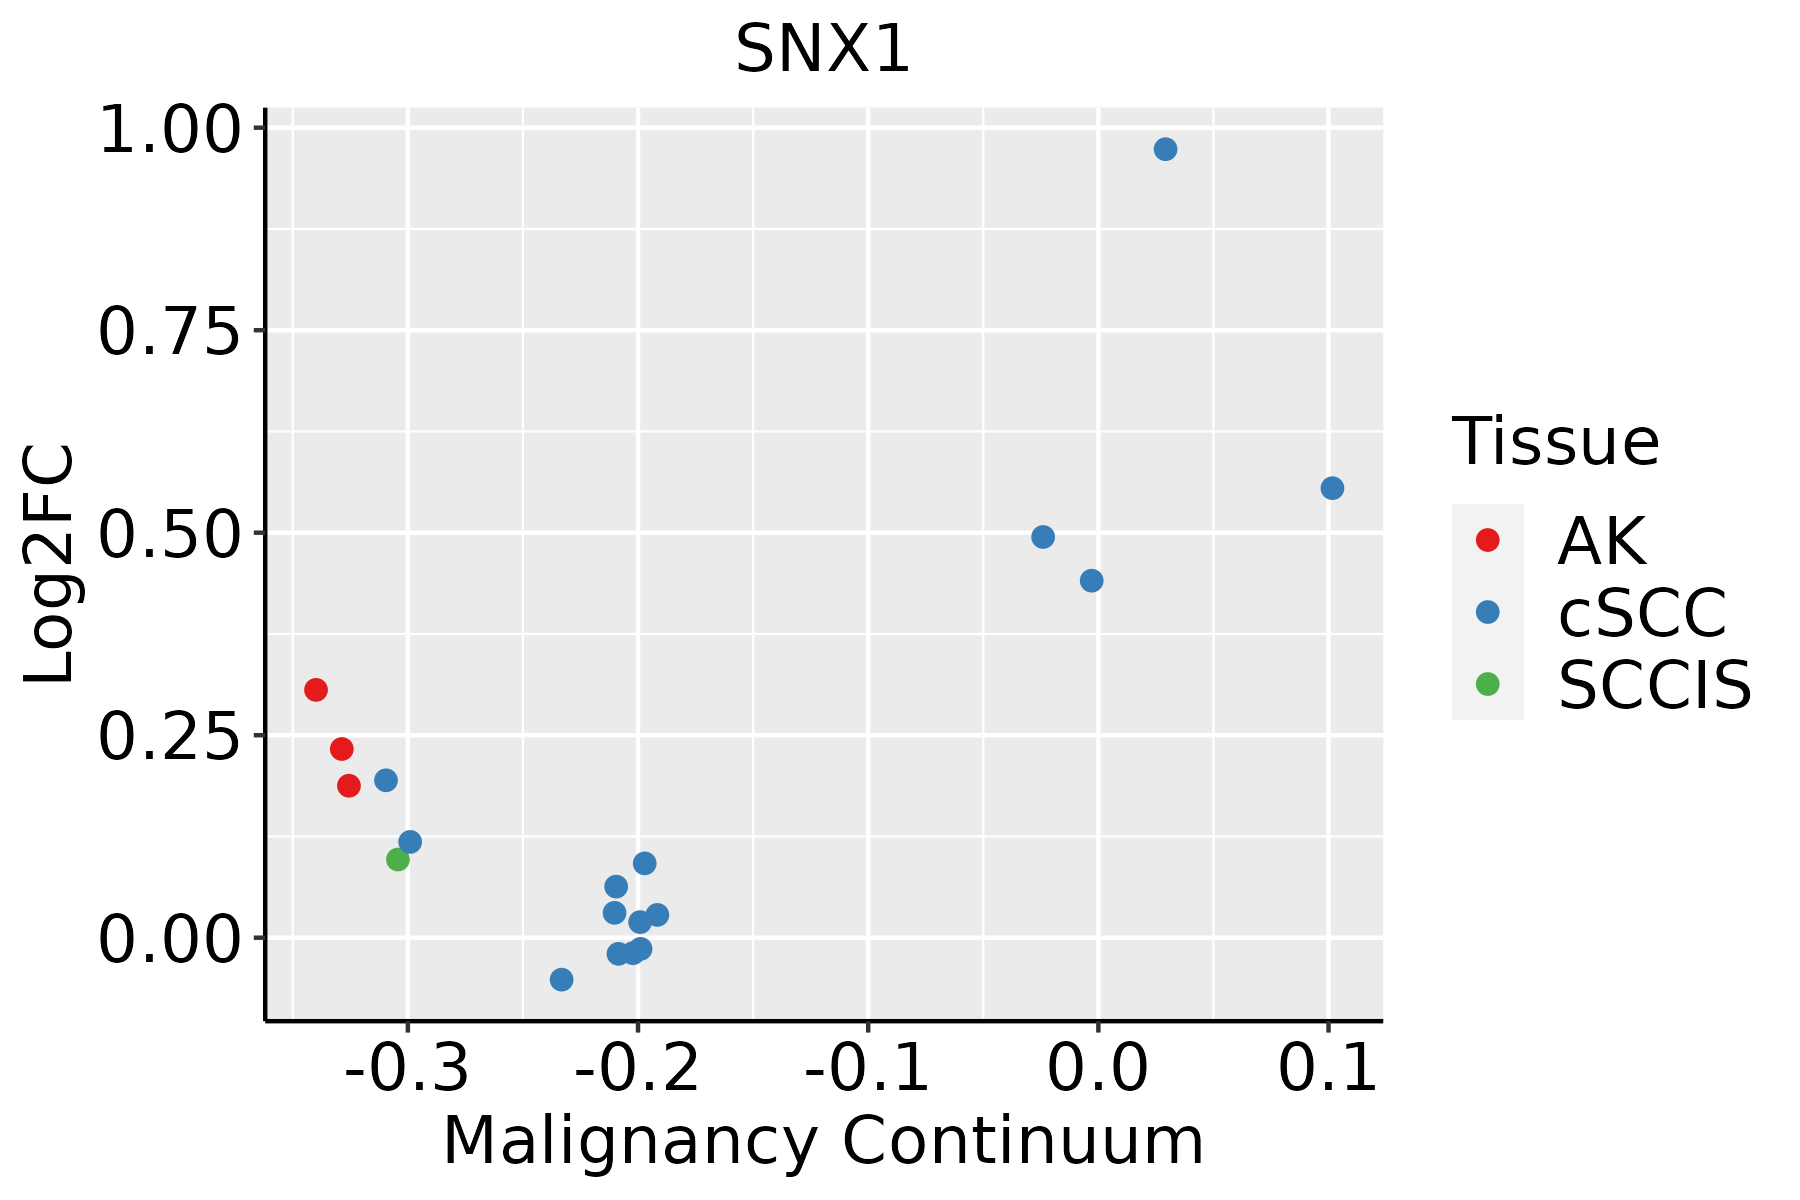 | AK: Actinic keratosis |
| cSCC: Cutaneous squamous cell carcinoma | ||
| SCCIS:squamous cell carcinoma in situ | ||
| Thyroid | 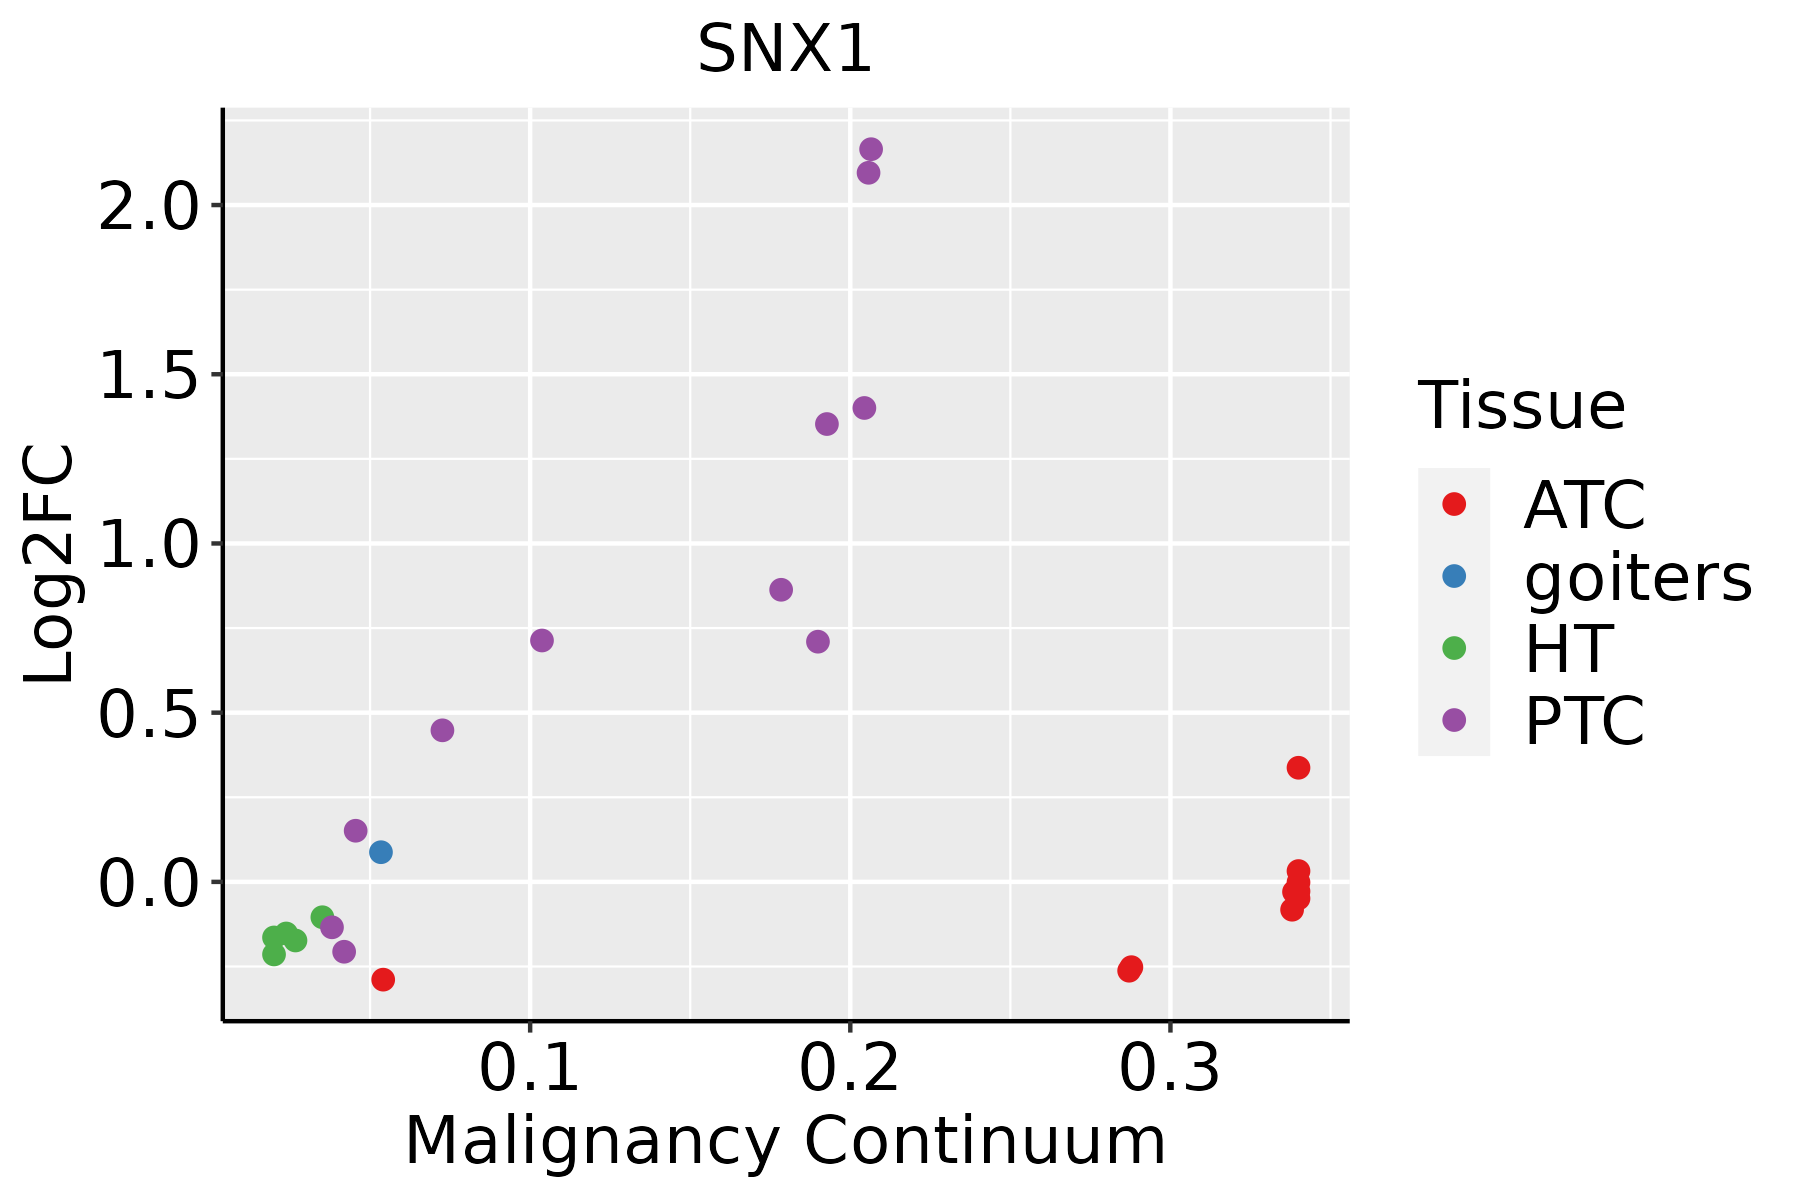 | ATC: Anaplastic thyroid cancer |
| HT: Hashimoto's thyroiditis | ||
| PTC: Papillary thyroid cancer |
| ∗log2FC in expression of this searched gene in stem-like cells from each diseased tissue sample relative to stem-like cells in normal samples in each tissue plotted against the malignancy continuum. Samples are colored based on if they are from different disease stage. |
Top |
Malignant transformation related pathway analysis |
| Find out the enriched GO biological processes and KEGG pathways involved in transition from healthy to precancer to cancer |
| Tissue | Disease Stage | Enriched GO biological Processes |
| Colorectum | AD |  |
| Colorectum | SER |  |
| Colorectum | MSS |  |
| Colorectum | MSI-H |  |
| Colorectum | FAP |  |
| ∗Top 15 enriched GO BP terms are showed in the bar plot of each disease state in each tissue. Each row represents a significant GO biological process which is colored according to the -log10(p.adjust). |
| Page: 1 2 3 4 5 6 7 8 9 |
| GO ID | Tissue | Disease Stage | Description | Gene Ratio | Bg Ratio | pvalue | p.adjust | Count |
| GO:0042176 | Colorectum | AD | regulation of protein catabolic process | 160/3918 | 391/18723 | 1.06e-19 | 7.34e-17 | 160 |
| GO:0009895 | Colorectum | AD | negative regulation of catabolic process | 124/3918 | 320/18723 | 1.66e-13 | 3.35e-11 | 124 |
| GO:0048193 | Colorectum | AD | Golgi vesicle transport | 109/3918 | 296/18723 | 1.80e-10 | 1.68e-08 | 109 |
| GO:0016197 | Colorectum | AD | endosomal transport | 90/3918 | 230/18723 | 1.88e-10 | 1.73e-08 | 90 |
| GO:0042177 | Colorectum | AD | negative regulation of protein catabolic process | 55/3918 | 121/18723 | 1.19e-09 | 8.85e-08 | 55 |
| GO:0016482 | Colorectum | AD | cytosolic transport | 68/3918 | 168/18723 | 6.00e-09 | 3.72e-07 | 68 |
| GO:0098876 | Colorectum | AD | vesicle-mediated transport to the plasma membrane | 57/3918 | 136/18723 | 2.30e-08 | 1.27e-06 | 57 |
| GO:1901361 | Colorectum | AD | organic cyclic compound catabolic process | 153/3918 | 495/18723 | 8.23e-08 | 4.18e-06 | 153 |
| GO:0032386 | Colorectum | AD | regulation of intracellular transport | 109/3918 | 337/18723 | 5.33e-07 | 1.95e-05 | 109 |
| GO:0044282 | Colorectum | AD | small molecule catabolic process | 118/3918 | 376/18723 | 1.05e-06 | 3.55e-05 | 118 |
| GO:0043087 | Colorectum | AD | regulation of GTPase activity | 110/3918 | 348/18723 | 1.64e-06 | 5.03e-05 | 110 |
| GO:0042147 | Colorectum | AD | retrograde transport, endosome to Golgi | 37/3918 | 91/18723 | 1.46e-05 | 3.14e-04 | 37 |
| GO:0045861 | Colorectum | AD | negative regulation of proteolysis | 106/3918 | 351/18723 | 2.33e-05 | 4.57e-04 | 106 |
| GO:0006066 | Colorectum | AD | alcohol metabolic process | 106/3918 | 353/18723 | 3.02e-05 | 5.57e-04 | 106 |
| GO:0016042 | Colorectum | AD | lipid catabolic process | 97/3918 | 320/18723 | 4.31e-05 | 7.56e-04 | 97 |
| GO:0006898 | Colorectum | AD | receptor-mediated endocytosis | 76/3918 | 244/18723 | 1.07e-04 | 1.59e-03 | 76 |
| GO:0030100 | Colorectum | AD | regulation of endocytosis | 67/3918 | 211/18723 | 1.42e-04 | 2.01e-03 | 67 |
| GO:0032456 | Colorectum | AD | endocytic recycling | 28/3918 | 73/18723 | 4.87e-04 | 5.30e-03 | 28 |
| GO:0098927 | Colorectum | AD | vesicle-mediated transport between endosomal compartments | 19/3918 | 43/18723 | 5.03e-04 | 5.43e-03 | 19 |
| GO:0051604 | Colorectum | AD | protein maturation | 85/3918 | 294/18723 | 6.73e-04 | 6.91e-03 | 85 |
| Page: 1 2 3 4 5 6 7 8 9 10 11 12 13 14 15 16 17 18 19 20 21 22 23 24 25 26 |
| Pathway ID | Tissue | Disease Stage | Description | Gene Ratio | Bg Ratio | pvalue | p.adjust | qvalue | Count |
| hsa04144210 | Esophagus | ESCC | Endocytosis | 186/4205 | 251/8465 | 9.74e-16 | 4.66e-14 | 2.39e-14 | 186 |
| hsa0414437 | Esophagus | ESCC | Endocytosis | 186/4205 | 251/8465 | 9.74e-16 | 4.66e-14 | 2.39e-14 | 186 |
| hsa0414412 | Liver | Cirrhotic | Endocytosis | 119/2530 | 251/8465 | 2.33e-09 | 4.56e-08 | 2.81e-08 | 119 |
| hsa0414413 | Liver | Cirrhotic | Endocytosis | 119/2530 | 251/8465 | 2.33e-09 | 4.56e-08 | 2.81e-08 | 119 |
| hsa0414422 | Liver | HCC | Endocytosis | 178/4020 | 251/8465 | 2.03e-14 | 5.22e-13 | 2.91e-13 | 178 |
| hsa0414432 | Liver | HCC | Endocytosis | 178/4020 | 251/8465 | 2.03e-14 | 5.22e-13 | 2.91e-13 | 178 |
| hsa0414427 | Oral cavity | OSCC | Endocytosis | 174/3704 | 251/8465 | 9.42e-17 | 4.51e-15 | 2.29e-15 | 174 |
| hsa04144112 | Oral cavity | OSCC | Endocytosis | 174/3704 | 251/8465 | 9.42e-17 | 4.51e-15 | 2.29e-15 | 174 |
| hsa0414428 | Oral cavity | LP | Endocytosis | 121/2418 | 251/8465 | 1.89e-11 | 3.70e-10 | 2.38e-10 | 121 |
| hsa0414436 | Oral cavity | LP | Endocytosis | 121/2418 | 251/8465 | 1.89e-11 | 3.70e-10 | 2.38e-10 | 121 |
| hsa0414425 | Prostate | BPH | Endocytosis | 89/1718 | 251/8465 | 1.06e-08 | 1.29e-07 | 7.99e-08 | 89 |
| hsa04144111 | Prostate | BPH | Endocytosis | 89/1718 | 251/8465 | 1.06e-08 | 1.29e-07 | 7.99e-08 | 89 |
| hsa0414426 | Prostate | Tumor | Endocytosis | 92/1791 | 251/8465 | 7.83e-09 | 1.04e-07 | 6.43e-08 | 92 |
| hsa0414435 | Prostate | Tumor | Endocytosis | 92/1791 | 251/8465 | 7.83e-09 | 1.04e-07 | 6.43e-08 | 92 |
| Page: 1 |
Top |
Cell-cell communication analysis |
| Identification of potential cell-cell interactions between two cell types and their ligand-receptor pairs for different disease states |
| Ligand | Receptor | LRpair | Pathway | Tissue | Disease Stage |
| Page: 1 |
Top |
Single-cell gene regulatory network inference analysis |
| Find out the significant the regulons (TFs) and the target genes of each regulon across cell types for different disease states |
| TF | Cell Type | Tissue | Disease Stage | Target Gene | RSS | Regulon Activity |
| ∗The dot plots of a searched regulon are shown for all cell subpopulations in each disease state of each tissue based on the regulon specific score inferred using pySCENIC and by calculating the average expression. |
| Page: 1 |
Top |
Somatic mutation of malignant transformation related genes |
| Annotation of somatic variants for genes involved in malignant transformation |
| Hugo Symbol | Variant Class | Variant Classification | dbSNP RS | HGVSc | HGVSp | HGVSp Short | SWISSPROT | BIOTYPE | SIFT | PolyPhen | Tumor Sample Barcode | Tissue | Histology | Sex | Age | Stage | Therapy Types | Drugs | Outcome |
| SNX1 | SNV | Missense_Mutation | novel | c.38N>C | p.Arg13Thr | p.R13T | Q13596 | protein_coding | deleterious_low_confidence(0) | possibly_damaging(0.886) | TCGA-A2-A0YK-01 | Breast | breast invasive carcinoma | Female | <65 | I/II | Chemotherapy | cytoxan | SD |
| SNX1 | SNV | Missense_Mutation | c.76G>A | p.Glu26Lys | p.E26K | Q13596 | protein_coding | tolerated_low_confidence(0.25) | benign(0.221) | TCGA-AC-A23H-01 | Breast | breast invasive carcinoma | Female | >=65 | I/II | Unknown | Unknown | PD | |
| SNX1 | SNV | Missense_Mutation | rs780100137 | c.1424N>A | p.Arg475Gln | p.R475Q | Q13596 | protein_coding | deleterious(0.04) | probably_damaging(0.939) | TCGA-BH-A0BT-01 | Breast | breast invasive carcinoma | Female | <65 | I/II | Chemotherapy | adriamycin | CR |
| SNX1 | insertion | Nonsense_Mutation | novel | c.1435_1436insGGCCTTCCTGAGGCCTAGTCCCCCTGTTCTTTTTC | p.Ile479ArgfsTer4 | p.I479Rfs*4 | Q13596 | protein_coding | TCGA-A8-A06P-01 | Breast | breast invasive carcinoma | Female | <65 | III/IV | Unspecific | SD | |||
| SNX1 | insertion | In_Frame_Ins | novel | c.478_479insGTAAAC | p.Asn160delinsSerLysHis | p.N160delinsSKH | Q13596 | protein_coding | TCGA-AC-A3QQ-01 | Breast | breast invasive carcinoma | Female | <65 | I/II | Unknown | Unknown | SD | ||
| SNX1 | SNV | Missense_Mutation | rs754631936 | c.1300N>A | p.Glu434Lys | p.E434K | Q13596 | protein_coding | tolerated(0.6) | probably_damaging(0.973) | TCGA-2W-A8YY-01 | Cervix | cervical & endocervical cancer | Female | <65 | I/II | Chemotherapy | cisplatin | CR |
| SNX1 | SNV | Missense_Mutation | c.1306C>T | p.Arg436Trp | p.R436W | Q13596 | protein_coding | deleterious(0) | probably_damaging(0.969) | TCGA-C5-A2M2-01 | Cervix | cervical & endocervical cancer | Female | <65 | I/II | Unknown | Unknown | SD | |
| SNX1 | SNV | Missense_Mutation | c.262C>G | p.Leu88Val | p.L88V | Q13596 | protein_coding | deleterious(0.01) | possibly_damaging(0.668) | TCGA-EK-A2RJ-01 | Cervix | cervical & endocervical cancer | Female | <65 | I/II | Unknown | Unknown | SD | |
| SNX1 | SNV | Missense_Mutation | c.76N>C | p.Glu26Gln | p.E26Q | Q13596 | protein_coding | tolerated_low_confidence(0.19) | possibly_damaging(0.51) | TCGA-IR-A3LK-01 | Cervix | cervical & endocervical cancer | Female | >=65 | I/II | Chemotherapy | cisplatin | PD | |
| SNX1 | SNV | Missense_Mutation | novel | c.1291C>T | p.Arg431Trp | p.R431W | Q13596 | protein_coding | deleterious(0) | probably_damaging(0.999) | TCGA-MA-AA42-01 | Cervix | cervical & endocervical cancer | Female | >=65 | I/II | Unknown | Unknown | SD |
| Page: 1 2 3 4 5 6 |
Top |
Related drugs of malignant transformation related genes |
| Identification of chemicals and drugs interact with genes involved in malignant transfromation |
| (DGIdb 4.0) |
| Entrez ID | Symbol | Category | Interaction Types | Drug Claim Name | Drug Name | PMIDs |
| Page: 1 |

Copyright 2023-Present -The University of Texas Health Science Center at Houston |