
|
|||||
|
 | |
| |
| |
| |
| |
| |
|
Gene: SNU13 |
Gene summary for SNU13 |
| Gene information | Species | Human | Gene symbol | SNU13 | Gene ID | 4809 |
| Gene name | small nuclear ribonucleoprotein 13 | |
| Gene Alias | 15.5K | |
| Cytomap | 22q13.2 | |
| Gene Type | protein-coding | GO ID | GO:0000003 | UniProtAcc | P55769 |
Top |
Malignant transformation analysis |
| Identification of the aberrant gene expression in precancerous and cancerous lesions by comparing the gene expression of stem-like cells in diseased tissues with normal stem cells |
| Entrez ID | Symbol | Replicates | Species | Organ | Tissue | Adj P-value | Log2FC | Malignancy |
| 4809 | SNU13 | GSM4909281 | Human | Breast | IDC | 5.08e-05 | 3.16e-01 | 0.21 |
| 4809 | SNU13 | GSM4909282 | Human | Breast | IDC | 5.23e-06 | 3.13e-01 | -0.0288 |
| 4809 | SNU13 | GSM4909288 | Human | Breast | IDC | 2.52e-06 | -1.48e-01 | 0.0988 |
| 4809 | SNU13 | GSM4909293 | Human | Breast | IDC | 1.94e-11 | -4.02e-01 | 0.1581 |
| 4809 | SNU13 | GSM4909294 | Human | Breast | IDC | 6.23e-08 | -9.14e-02 | 0.2022 |
| 4809 | SNU13 | GSM4909296 | Human | Breast | IDC | 1.52e-15 | 5.79e-02 | 0.1524 |
| 4809 | SNU13 | GSM4909297 | Human | Breast | IDC | 1.48e-34 | -2.18e-01 | 0.1517 |
| 4809 | SNU13 | GSM4909298 | Human | Breast | IDC | 9.83e-07 | -2.76e-01 | 0.1551 |
| 4809 | SNU13 | GSM4909302 | Human | Breast | IDC | 1.17e-05 | -3.50e-01 | 0.1545 |
| 4809 | SNU13 | GSM4909309 | Human | Breast | IDC | 1.62e-08 | -2.40e-01 | 0.0483 |
| 4809 | SNU13 | GSM4909311 | Human | Breast | IDC | 1.39e-55 | -1.58e-01 | 0.1534 |
| 4809 | SNU13 | GSM4909312 | Human | Breast | IDC | 1.74e-14 | 1.29e-02 | 0.1552 |
| 4809 | SNU13 | GSM4909313 | Human | Breast | IDC | 1.07e-06 | -2.56e-01 | 0.0391 |
| 4809 | SNU13 | GSM4909316 | Human | Breast | IDC | 4.21e-06 | 1.86e-01 | 0.21 |
| 4809 | SNU13 | GSM4909319 | Human | Breast | IDC | 7.24e-71 | -2.40e-01 | 0.1563 |
| 4809 | SNU13 | GSM4909320 | Human | Breast | IDC | 1.30e-10 | -3.28e-01 | 0.1575 |
| 4809 | SNU13 | GSM4909321 | Human | Breast | IDC | 2.16e-24 | -3.45e-01 | 0.1559 |
| 4809 | SNU13 | brca1 | Human | Breast | Precancer | 1.53e-06 | 3.49e-01 | -0.0338 |
| 4809 | SNU13 | brca2 | Human | Breast | Precancer | 5.61e-03 | 2.14e-01 | -0.024 |
| 4809 | SNU13 | M2 | Human | Breast | IDC | 1.94e-03 | -8.08e-02 | 0.21 |
| Page: 1 2 3 4 5 6 7 8 9 10 11 12 13 14 15 16 |
| Tissue | Expression Dynamics | Abbreviation |
| Breast | 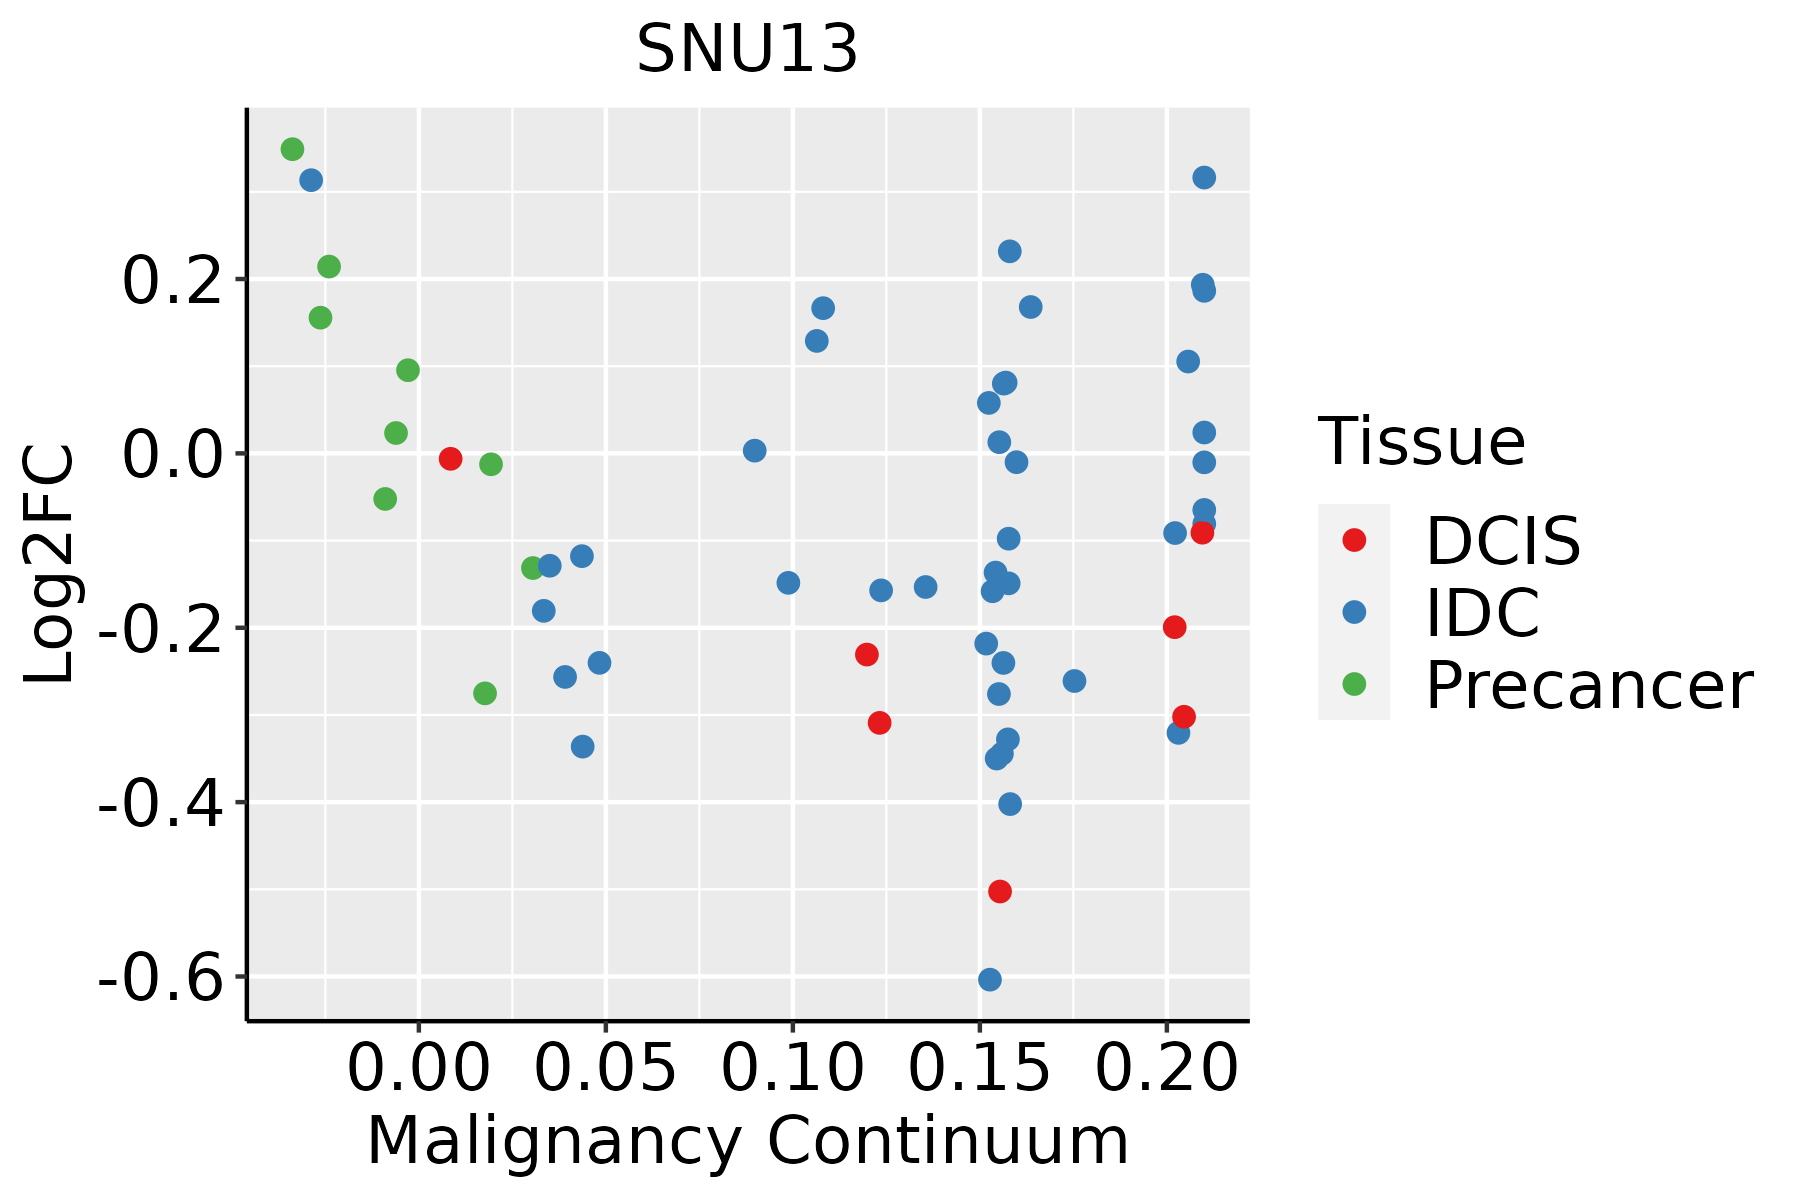 | IDC: Invasive ductal carcinoma |
| DCIS: Ductal carcinoma in situ | ||
| Precancer(BRCA1-mut): Precancerous lesion from BRCA1 mutation carriers | ||
| Cervix | 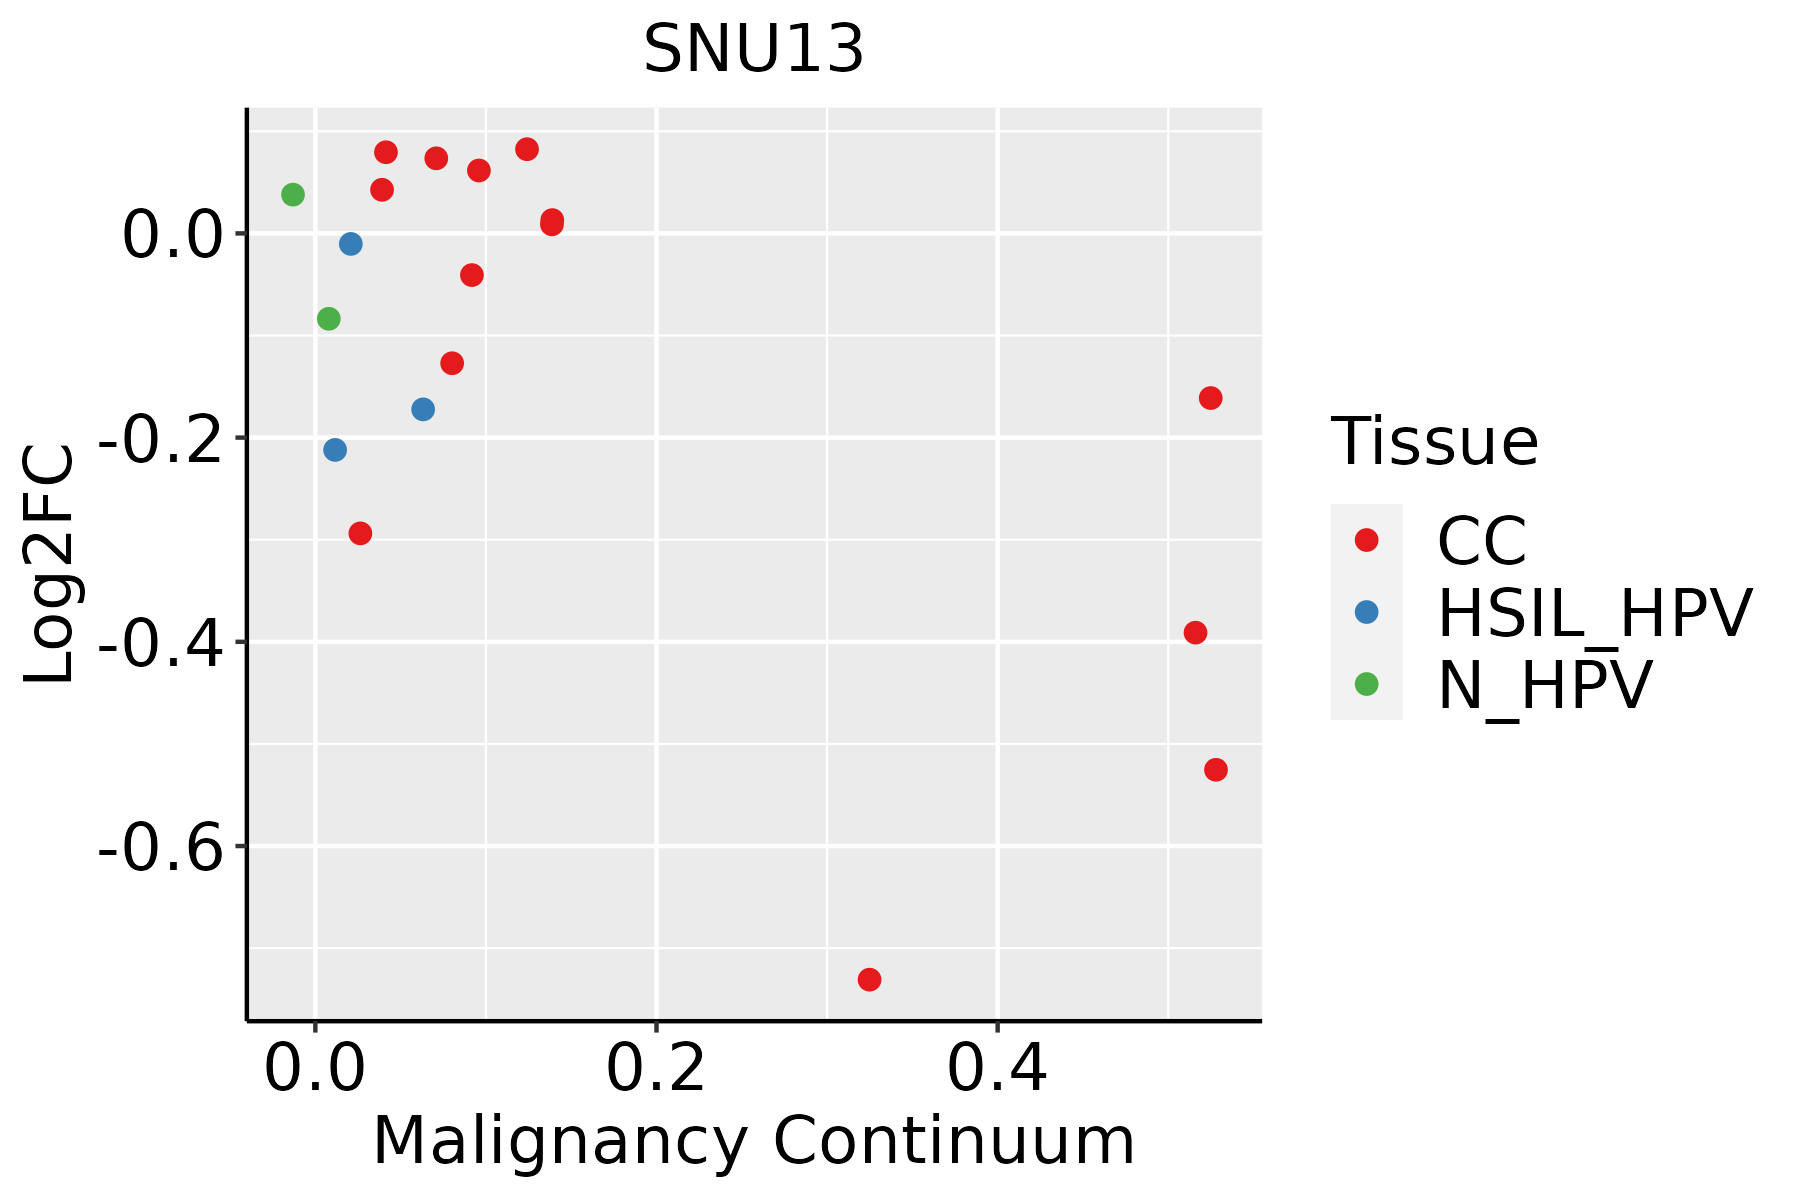 | CC: Cervix cancer |
| HSIL_HPV: HPV-infected high-grade squamous intraepithelial lesions | ||
| N_HPV: HPV-infected normal cervix | ||
| Colorectum (GSE201348) |  | FAP: Familial adenomatous polyposis |
| CRC: Colorectal cancer | ||
| Colorectum (HTA11) |  | AD: Adenomas |
| SER: Sessile serrated lesions | ||
| MSI-H: Microsatellite-high colorectal cancer | ||
| MSS: Microsatellite stable colorectal cancer | ||
| Endometrium | 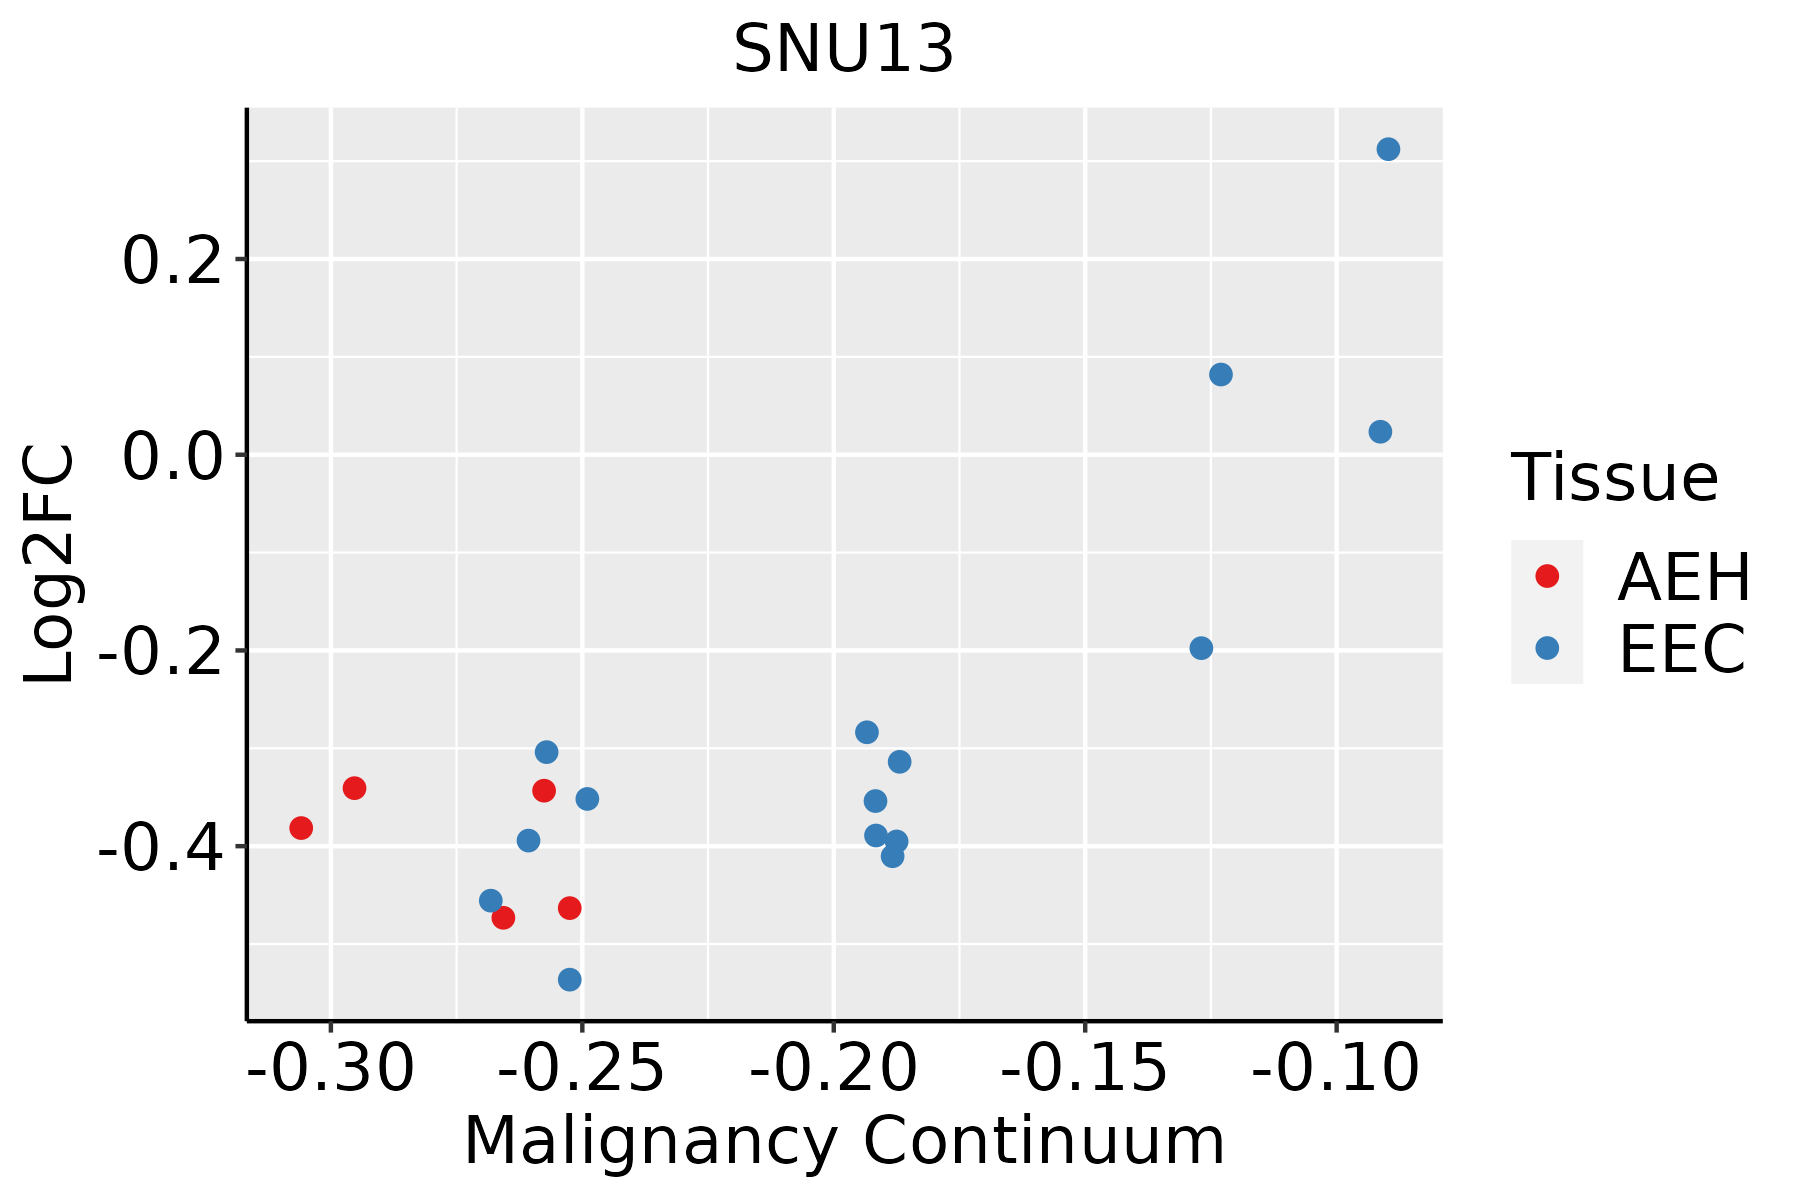 | AEH: Atypical endometrial hyperplasia |
| EEC: Endometrioid Cancer | ||
| Esophagus | 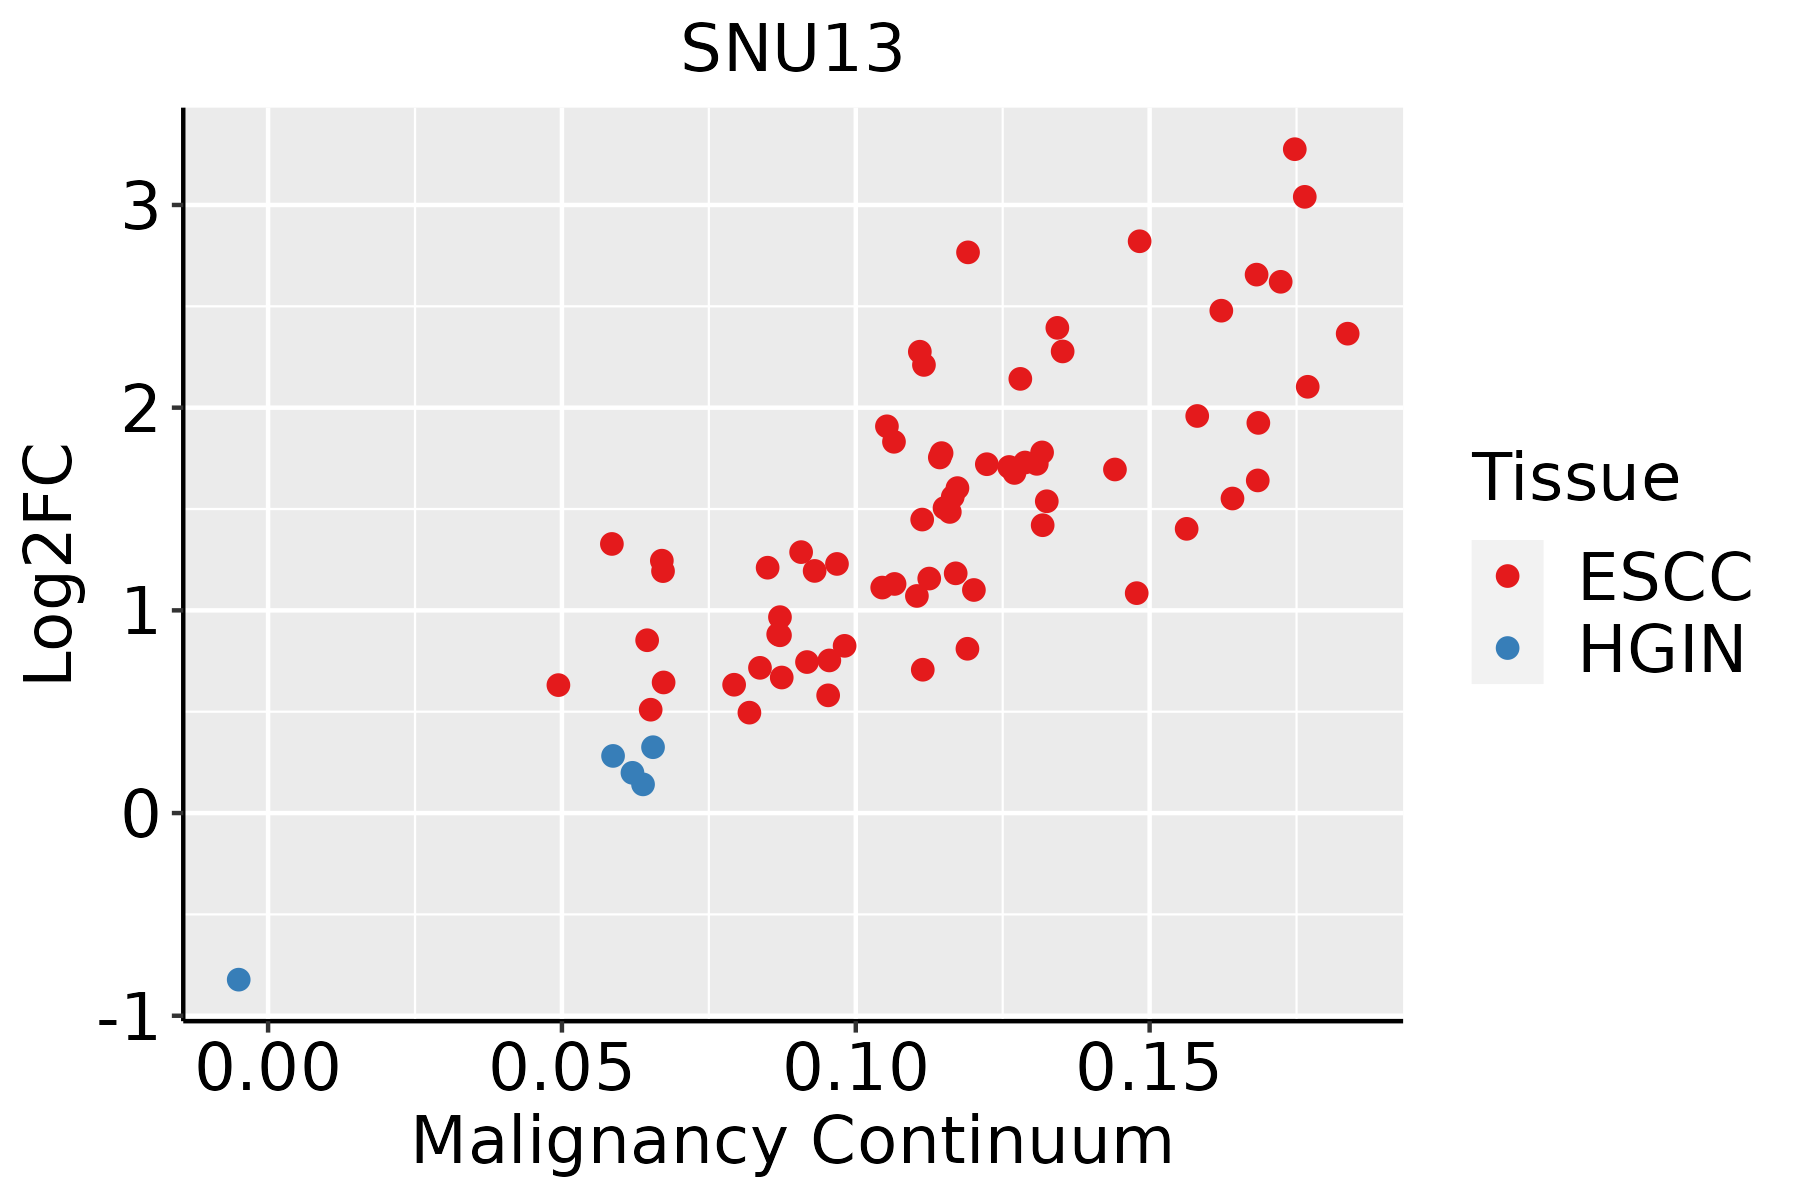 | ESCC: Esophageal squamous cell carcinoma |
| HGIN: High-grade intraepithelial neoplasias | ||
| LGIN: Low-grade intraepithelial neoplasias | ||
| GC | 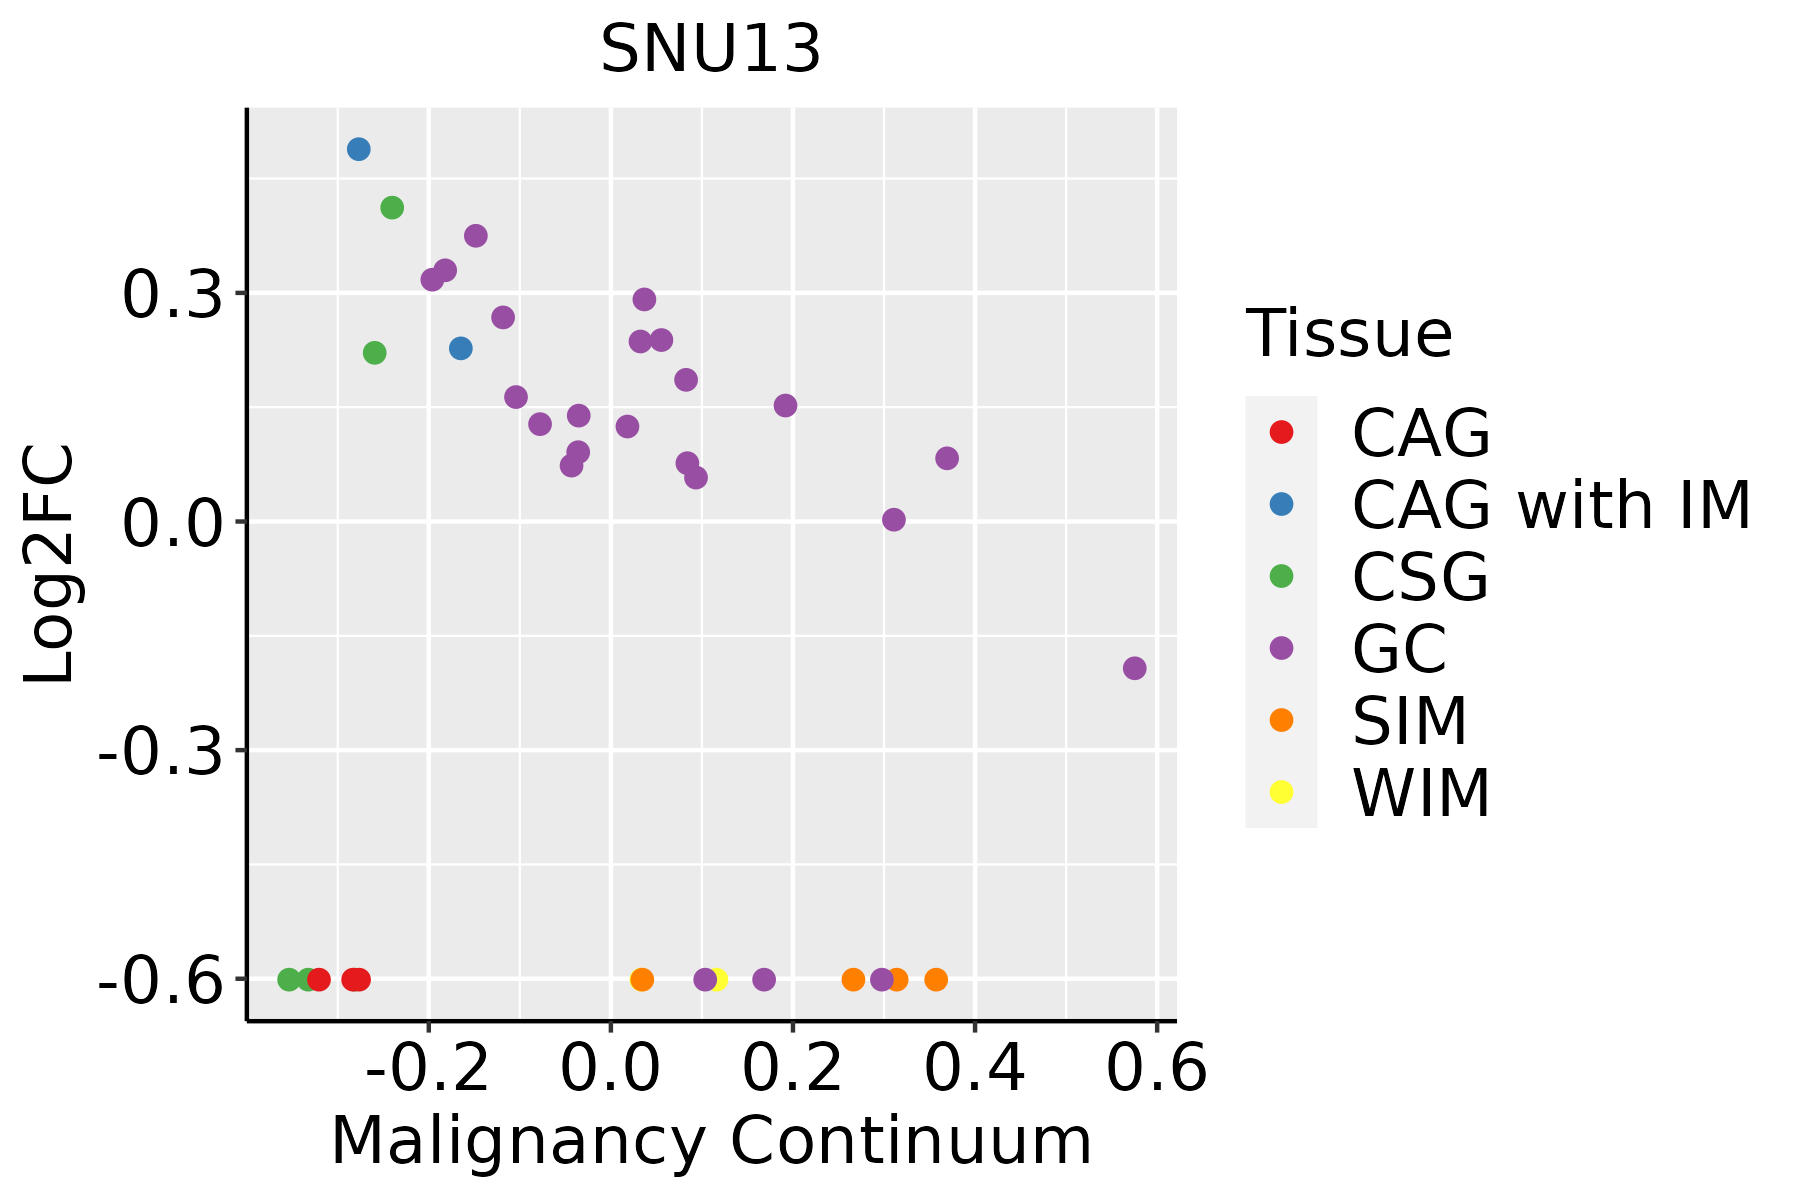 | CAG: Chronic atrophic gastritis |
| CAG with IM: Chronic atrophic gastritis with intestinal metaplasia | ||
| CSG: Chronic superficial gastritis | ||
| GC: Gastric cancer | ||
| SIM: Severe intestinal metaplasia | ||
| WIM: Wild intestinal metaplasia | ||
| Liver | 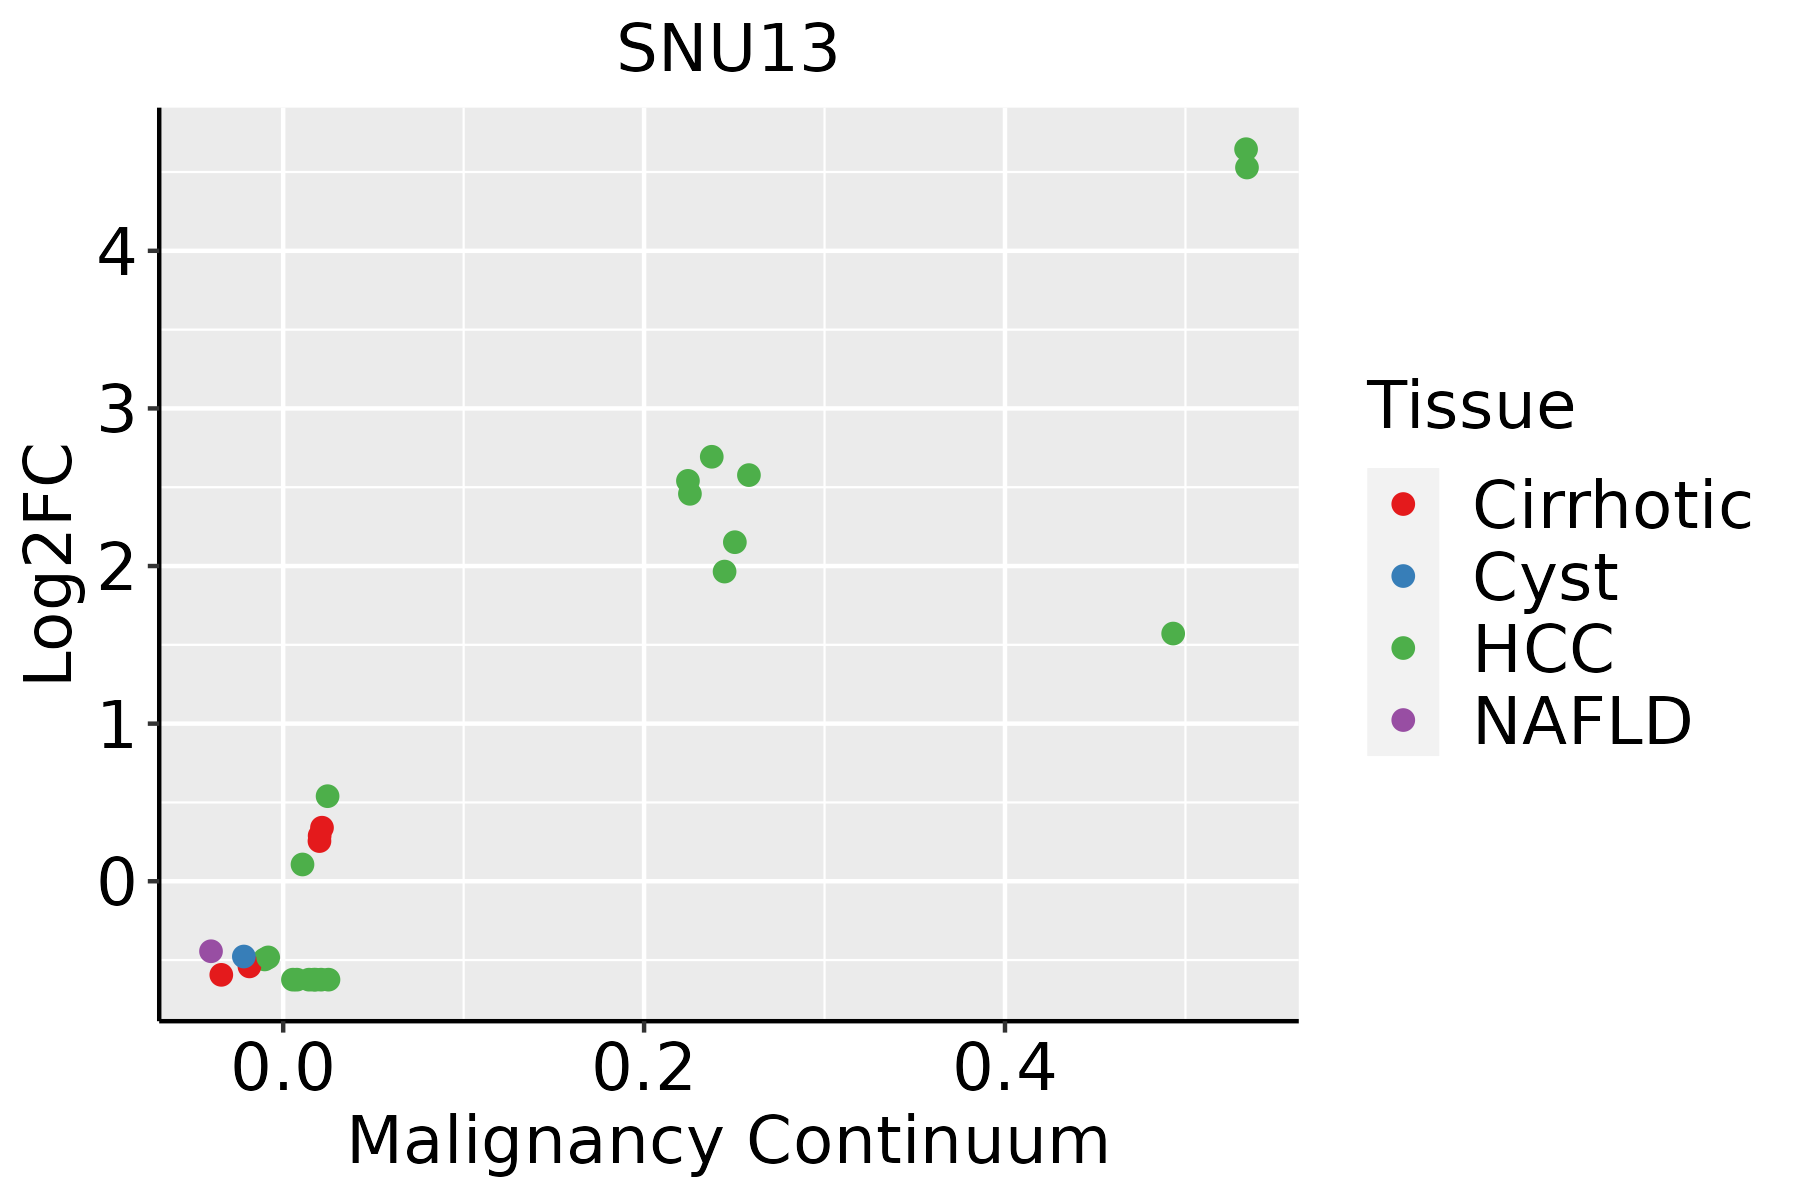 | HCC: Hepatocellular carcinoma |
| NAFLD: Non-alcoholic fatty liver disease | ||
| Oral Cavity | 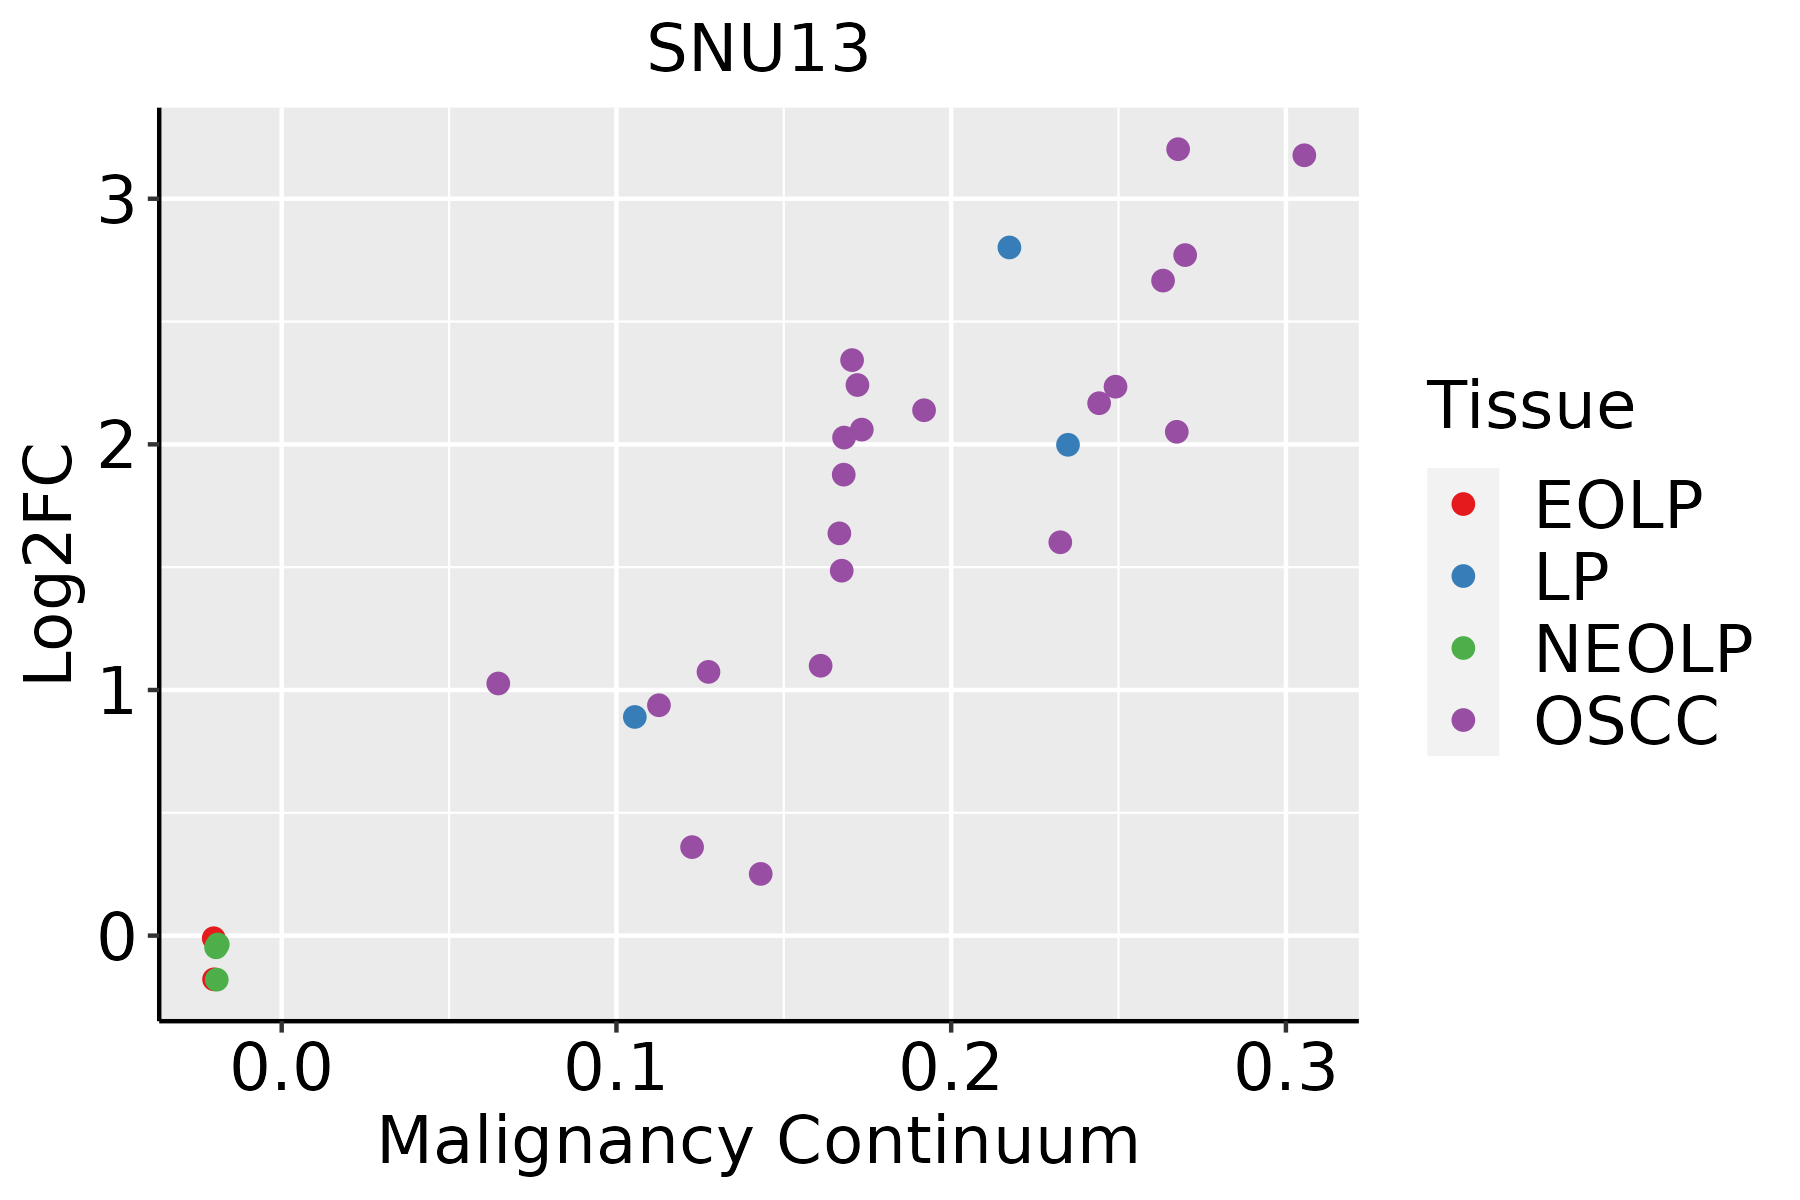 | EOLP: Erosive Oral lichen planus |
| LP: leukoplakia | ||
| NEOLP: Non-erosive oral lichen planus | ||
| OSCC: Oral squamous cell carcinoma | ||
| Prostate | 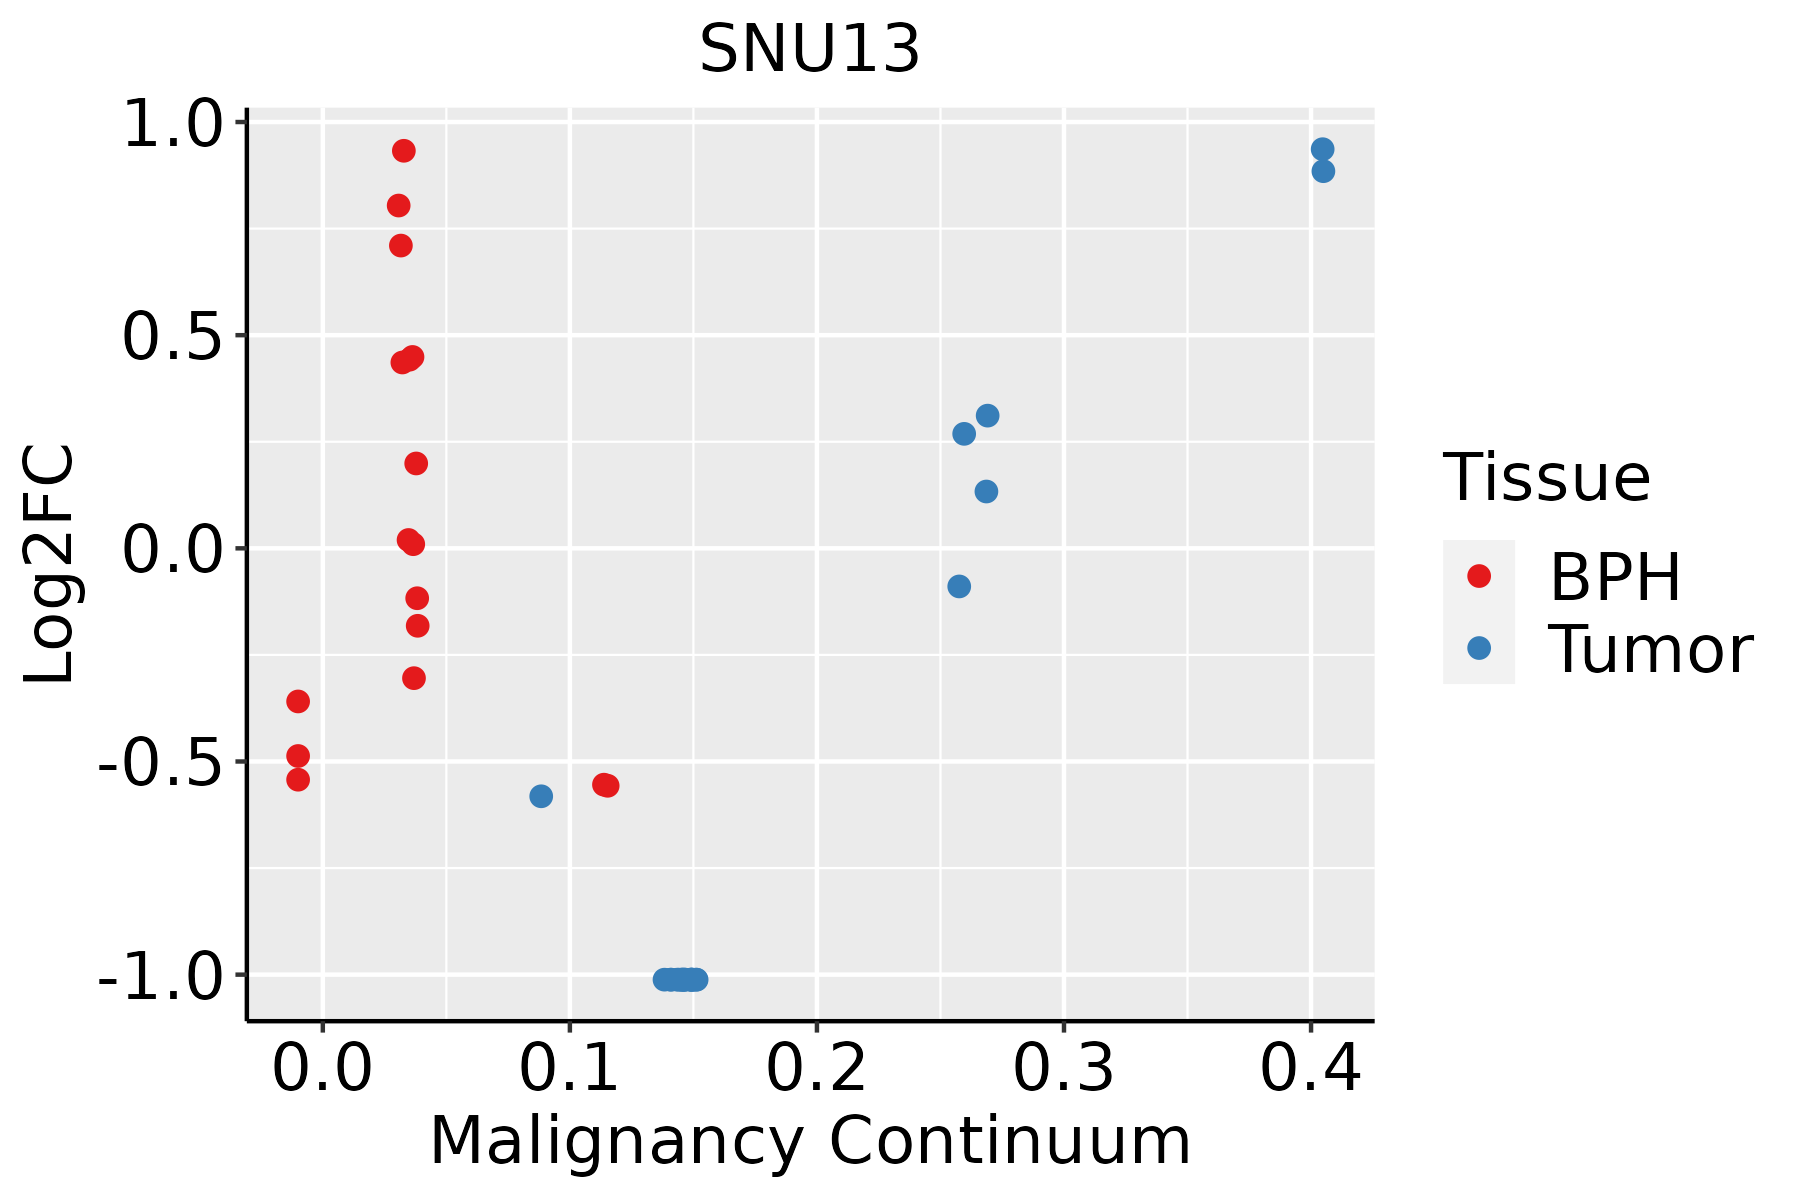 | BPH: Benign Prostatic Hyperplasia |
| Skin | 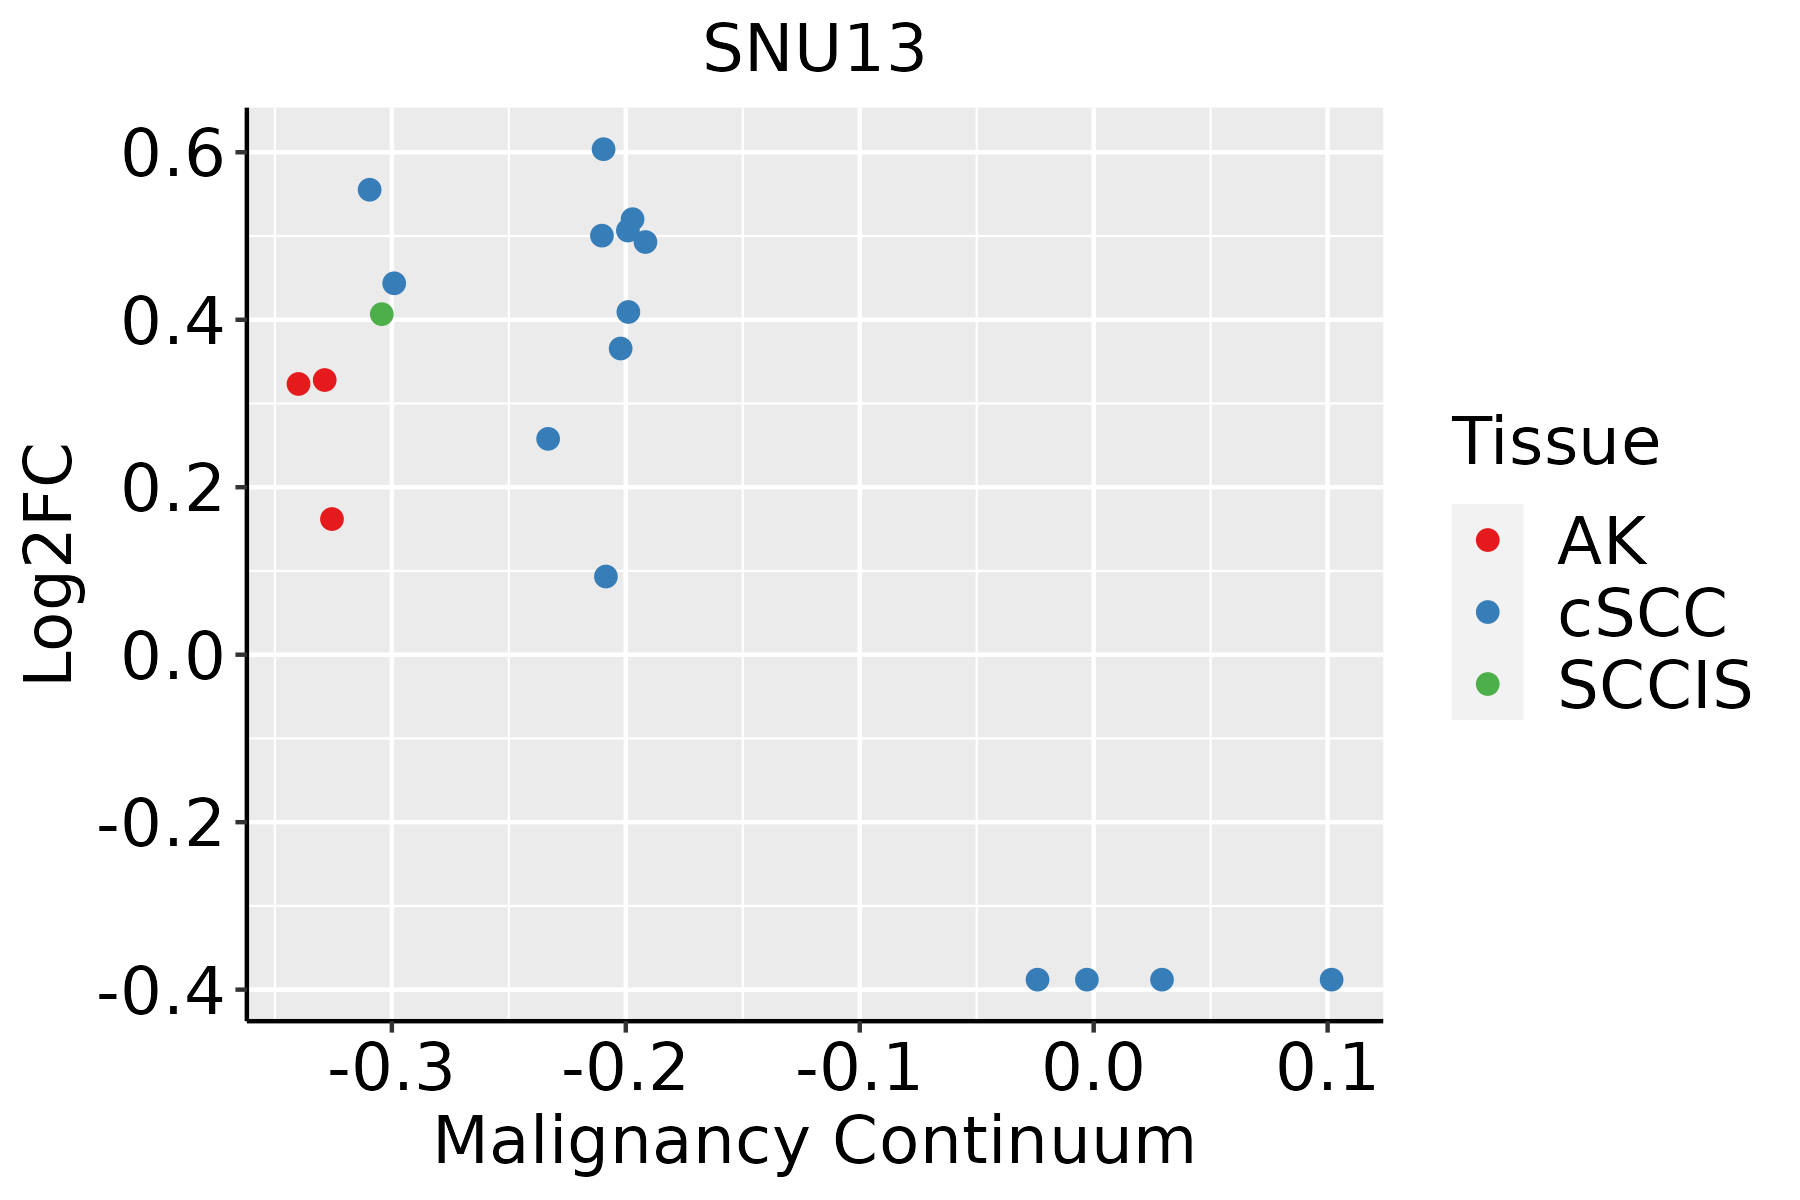 | AK: Actinic keratosis |
| cSCC: Cutaneous squamous cell carcinoma | ||
| SCCIS:squamous cell carcinoma in situ | ||
| Thyroid | 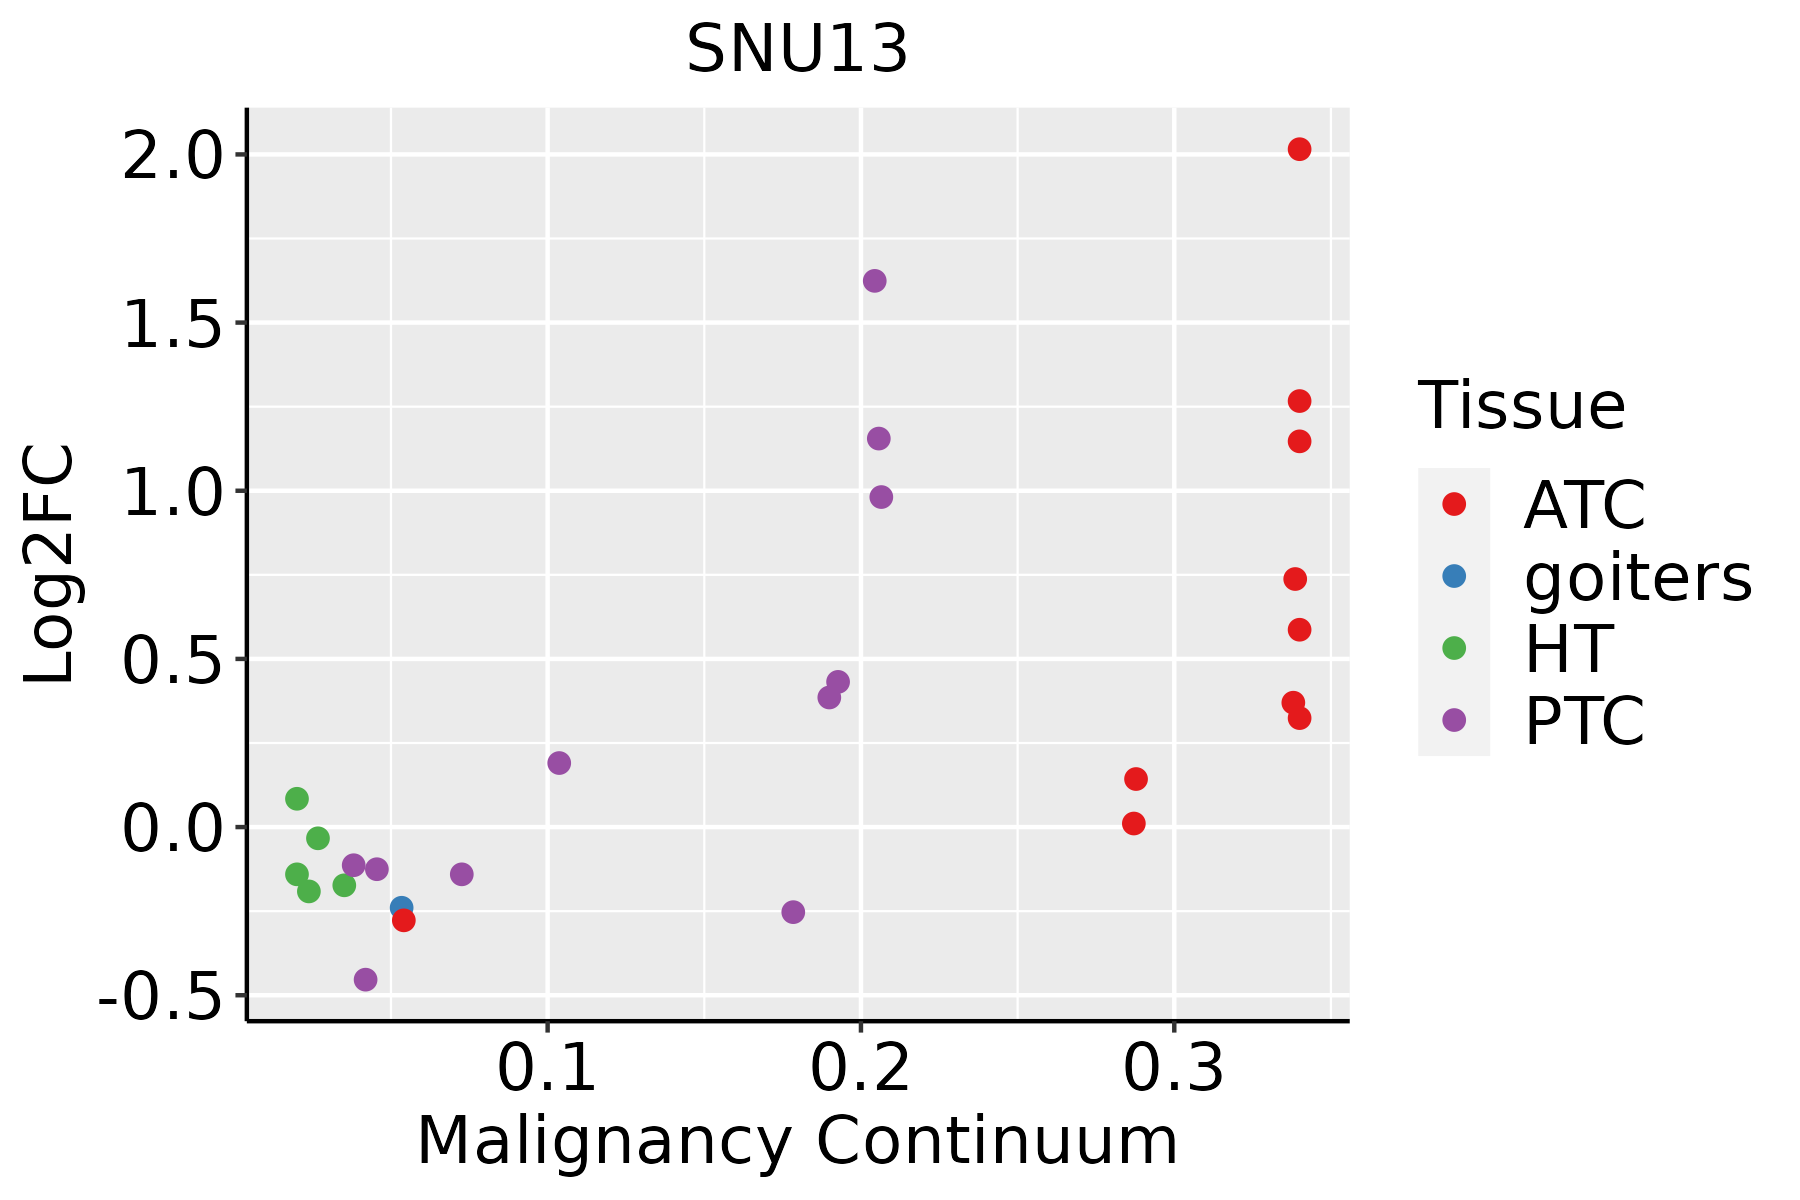 | ATC: Anaplastic thyroid cancer |
| HT: Hashimoto's thyroiditis | ||
| PTC: Papillary thyroid cancer |
| ∗log2FC in expression of this searched gene in stem-like cells from each diseased tissue sample relative to stem-like cells in normal samples in each tissue plotted against the malignancy continuum. Samples are colored based on if they are from different disease stage. |
Top |
Malignant transformation related pathway analysis |
| Find out the enriched GO biological processes and KEGG pathways involved in transition from healthy to precancer to cancer |
| Tissue | Disease Stage | Enriched GO biological Processes |
| Colorectum | AD |  |
| Colorectum | SER |  |
| Colorectum | MSS |  |
| Colorectum | MSI-H |  |
| Colorectum | FAP |  |
| ∗Top 15 enriched GO BP terms are showed in the bar plot of each disease state in each tissue. Each row represents a significant GO biological process which is colored according to the -log10(p.adjust). |
| Page: 1 2 3 4 5 6 7 8 9 |
| GO ID | Tissue | Disease Stage | Description | Gene Ratio | Bg Ratio | pvalue | p.adjust | Count |
| GO:00226139 | Breast | Precancer | ribonucleoprotein complex biogenesis | 79/1080 | 463/18723 | 2.11e-18 | 1.03e-15 | 79 |
| GO:00718269 | Breast | Precancer | ribonucleoprotein complex subunit organization | 48/1080 | 227/18723 | 2.68e-15 | 8.45e-13 | 48 |
| GO:00226189 | Breast | Precancer | ribonucleoprotein complex assembly | 47/1080 | 220/18723 | 3.47e-15 | 1.03e-12 | 47 |
| GO:00422549 | Breast | Precancer | ribosome biogenesis | 52/1080 | 299/18723 | 7.35e-13 | 1.51e-10 | 52 |
| GO:00083809 | Breast | Precancer | RNA splicing | 65/1080 | 434/18723 | 1.27e-12 | 2.53e-10 | 65 |
| GO:00003759 | Breast | Precancer | RNA splicing, via transesterification reactions | 52/1080 | 324/18723 | 1.74e-11 | 2.22e-09 | 52 |
| GO:00003779 | Breast | Precancer | RNA splicing, via transesterification reactions with bulged adenosine as nucleophile | 51/1080 | 320/18723 | 3.55e-11 | 4.04e-09 | 51 |
| GO:00003989 | Breast | Precancer | mRNA splicing, via spliceosome | 51/1080 | 320/18723 | 3.55e-11 | 4.04e-09 | 51 |
| GO:00422739 | Breast | Precancer | ribosomal large subunit biogenesis | 22/1080 | 72/18723 | 5.03e-11 | 5.61e-09 | 22 |
| GO:00422749 | Breast | Precancer | ribosomal small subunit biogenesis | 21/1080 | 73/18723 | 4.84e-10 | 4.39e-08 | 21 |
| GO:00063646 | Breast | Precancer | rRNA processing | 35/1080 | 225/18723 | 7.90e-08 | 4.60e-06 | 35 |
| GO:00160726 | Breast | Precancer | rRNA metabolic process | 36/1080 | 236/18723 | 8.59e-08 | 4.84e-06 | 36 |
| GO:00344705 | Breast | Precancer | ncRNA processing | 42/1080 | 395/18723 | 9.91e-05 | 1.83e-03 | 42 |
| GO:00004703 | Breast | Precancer | maturation of LSU-rRNA | 7/1080 | 28/18723 | 8.46e-04 | 9.82e-03 | 7 |
| GO:00346604 | Breast | Precancer | ncRNA metabolic process | 45/1080 | 485/18723 | 1.15e-03 | 1.26e-02 | 45 |
| GO:00304902 | Breast | Precancer | maturation of SSU-rRNA | 8/1080 | 50/18723 | 7.39e-03 | 4.90e-02 | 8 |
| GO:002261314 | Breast | IDC | ribonucleoprotein complex biogenesis | 83/1434 | 463/18723 | 2.01e-13 | 5.20e-11 | 83 |
| GO:007182614 | Breast | IDC | ribonucleoprotein complex subunit organization | 52/1434 | 227/18723 | 5.18e-13 | 1.21e-10 | 52 |
| GO:002261814 | Breast | IDC | ribonucleoprotein complex assembly | 51/1434 | 220/18723 | 5.32e-13 | 1.21e-10 | 51 |
| GO:000838014 | Breast | IDC | RNA splicing | 73/1434 | 434/18723 | 1.27e-10 | 1.57e-08 | 73 |
| Page: 1 2 3 4 5 6 7 8 9 10 11 12 13 14 15 16 17 18 19 20 21 |
| Pathway ID | Tissue | Disease Stage | Description | Gene Ratio | Bg Ratio | pvalue | p.adjust | qvalue | Count |
| hsa030408 | Breast | Precancer | Spliceosome | 39/684 | 217/8465 | 1.44e-06 | 2.27e-05 | 1.74e-05 | 39 |
| hsa0304013 | Breast | Precancer | Spliceosome | 39/684 | 217/8465 | 1.44e-06 | 2.27e-05 | 1.74e-05 | 39 |
| hsa0304023 | Breast | IDC | Spliceosome | 40/867 | 217/8465 | 1.53e-04 | 1.42e-03 | 1.06e-03 | 40 |
| hsa0304033 | Breast | IDC | Spliceosome | 40/867 | 217/8465 | 1.53e-04 | 1.42e-03 | 1.06e-03 | 40 |
| hsa0304043 | Breast | DCIS | Spliceosome | 40/846 | 217/8465 | 8.97e-05 | 8.52e-04 | 6.28e-04 | 40 |
| hsa0304053 | Breast | DCIS | Spliceosome | 40/846 | 217/8465 | 8.97e-05 | 8.52e-04 | 6.28e-04 | 40 |
| hsa03040 | Colorectum | AD | Spliceosome | 73/2092 | 217/8465 | 1.73e-03 | 9.68e-03 | 6.18e-03 | 73 |
| hsa030401 | Colorectum | AD | Spliceosome | 73/2092 | 217/8465 | 1.73e-03 | 9.68e-03 | 6.18e-03 | 73 |
| hsa030402 | Colorectum | MSS | Spliceosome | 66/1875 | 217/8465 | 2.58e-03 | 1.27e-02 | 7.81e-03 | 66 |
| hsa030403 | Colorectum | MSS | Spliceosome | 66/1875 | 217/8465 | 2.58e-03 | 1.27e-02 | 7.81e-03 | 66 |
| hsa030404 | Colorectum | MSI-H | Spliceosome | 37/797 | 217/8465 | 2.49e-04 | 3.23e-03 | 2.70e-03 | 37 |
| hsa030405 | Colorectum | MSI-H | Spliceosome | 37/797 | 217/8465 | 2.49e-04 | 3.23e-03 | 2.70e-03 | 37 |
| hsa030409 | Endometrium | AEH | Spliceosome | 54/1197 | 217/8465 | 1.47e-05 | 1.65e-04 | 1.21e-04 | 54 |
| hsa0304014 | Endometrium | AEH | Spliceosome | 54/1197 | 217/8465 | 1.47e-05 | 1.65e-04 | 1.21e-04 | 54 |
| hsa0304024 | Endometrium | EEC | Spliceosome | 54/1237 | 217/8465 | 3.78e-05 | 3.88e-04 | 2.89e-04 | 54 |
| hsa0304034 | Endometrium | EEC | Spliceosome | 54/1237 | 217/8465 | 3.78e-05 | 3.88e-04 | 2.89e-04 | 54 |
| hsa0304027 | Esophagus | ESCC | Spliceosome | 128/4205 | 217/8465 | 3.31e-03 | 8.79e-03 | 4.50e-03 | 128 |
| hsa0304037 | Esophagus | ESCC | Spliceosome | 128/4205 | 217/8465 | 3.31e-03 | 8.79e-03 | 4.50e-03 | 128 |
| hsa030407 | Liver | Cirrhotic | Spliceosome | 102/2530 | 217/8465 | 5.69e-08 | 9.47e-07 | 5.84e-07 | 102 |
| hsa0304012 | Liver | Cirrhotic | Spliceosome | 102/2530 | 217/8465 | 5.69e-08 | 9.47e-07 | 5.84e-07 | 102 |
| Page: 1 2 |
Top |
Cell-cell communication analysis |
| Identification of potential cell-cell interactions between two cell types and their ligand-receptor pairs for different disease states |
| Ligand | Receptor | LRpair | Pathway | Tissue | Disease Stage |
| Page: 1 |
Top |
Single-cell gene regulatory network inference analysis |
| Find out the significant the regulons (TFs) and the target genes of each regulon across cell types for different disease states |
| TF | Cell Type | Tissue | Disease Stage | Target Gene | RSS | Regulon Activity |
| ∗The dot plots of a searched regulon are shown for all cell subpopulations in each disease state of each tissue based on the regulon specific score inferred using pySCENIC and by calculating the average expression. |
| Page: 1 |
Top |
Somatic mutation of malignant transformation related genes |
| Annotation of somatic variants for genes involved in malignant transformation |
| Hugo Symbol | Variant Class | Variant Classification | dbSNP RS | HGVSc | HGVSp | HGVSp Short | SWISSPROT | BIOTYPE | SIFT | PolyPhen | Tumor Sample Barcode | Tissue | Histology | Sex | Age | Stage | Therapy Types | Drugs | Outcome |
| SNU13 | SNV | Missense_Mutation | c.329N>T | p.Ser110Leu | p.S110L | P55769 | protein_coding | deleterious(0.03) | probably_damaging(1) | TCGA-BH-A0HF-01 | Breast | breast invasive carcinoma | Female | >=65 | I/II | Hormone Therapy | arimidex | SD | |
| SNU13 | SNV | Missense_Mutation | novel | c.152N>G | p.Ser51Cys | p.S51C | P55769 | protein_coding | tolerated(0.18) | benign(0.186) | TCGA-C5-A1M7-01 | Cervix | cervical & endocervical cancer | Female | <65 | I/II | Unknown | Unknown | SD |
| SNU13 | SNV | Missense_Mutation | c.329N>T | p.Ser110Leu | p.S110L | P55769 | protein_coding | deleterious(0.03) | probably_damaging(1) | TCGA-A6-5665-01 | Colorectum | colon adenocarcinoma | Female | >=65 | I/II | Unknown | Unknown | PD | |
| SNU13 | SNV | Missense_Mutation | c.52C>A | p.Leu18Ile | p.L18I | P55769 | protein_coding | deleterious(0.02) | benign(0.43) | TCGA-AY-6197-01 | Colorectum | colon adenocarcinoma | Male | <65 | I/II | Unknown | Unknown | SD | |
| SNU13 | SNV | Missense_Mutation | c.301N>A | p.Ala101Thr | p.A101T | P55769 | protein_coding | deleterious(0.04) | benign(0.044) | TCGA-EI-6512-01 | Colorectum | rectum adenocarcinoma | Female | <65 | III/IV | Chemotherapy | folfox | SD | |
| SNU13 | SNV | Missense_Mutation | novel | c.76N>A | p.Val26Ile | p.V26I | P55769 | protein_coding | tolerated(0.38) | benign(0.006) | TCGA-A5-A0G1-01 | Endometrium | uterine corpus endometrioid carcinoma | Female | >=65 | I/II | Unknown | Unknown | SD |
| SNU13 | SNV | Missense_Mutation | novel | c.123G>T | p.Glu41Asp | p.E41D | P55769 | protein_coding | deleterious(0) | probably_damaging(0.928) | TCGA-A5-A0G2-01 | Endometrium | uterine corpus endometrioid carcinoma | Female | <65 | III/IV | Unknown | Unknown | SD |
| SNU13 | SNV | Missense_Mutation | novel | c.149T>C | p.Ile50Thr | p.I50T | P55769 | protein_coding | tolerated(0.32) | benign(0.039) | TCGA-AX-A0J0-01 | Endometrium | uterine corpus endometrioid carcinoma | Female | <65 | I/II | Unknown | Unknown | SD |
| SNU13 | SNV | Missense_Mutation | novel | c.191N>T | p.Glu64Val | p.E64V | P55769 | protein_coding | deleterious(0) | probably_damaging(0.947) | TCGA-EY-A215-01 | Endometrium | uterine corpus endometrioid carcinoma | Female | <65 | I/II | Unknown | Unknown | SD |
| SNU13 | SNV | Missense_Mutation | novel | c.370G>A | p.Glu124Lys | p.E124K | P55769 | protein_coding | deleterious(0) | benign(0.085) | TCGA-55-8089-01 | Lung | lung adenocarcinoma | Male | <65 | I/II | Unknown | Unknown | SD |
| Page: 1 2 |
Top |
Related drugs of malignant transformation related genes |
| Identification of chemicals and drugs interact with genes involved in malignant transfromation |
| (DGIdb 4.0) |
| Entrez ID | Symbol | Category | Interaction Types | Drug Claim Name | Drug Name | PMIDs |
| Page: 1 |

Copyright 2023-Present -The University of Texas Health Science Center at Houston |