
|
|||||
|
 | |
| |
| |
| |
| |
| |
|
Gene: SNTG1 |
Gene summary for SNTG1 |
| Gene information | Species | Human | Gene symbol | SNTG1 | Gene ID | 54212 |
| Gene name | syntrophin gamma 1 | |
| Gene Alias | G1SYN | |
| Cytomap | 8q11.21 | |
| Gene Type | protein-coding | GO ID | GO:0007154 | UniProtAcc | A0A024R7Y0 |
Top |
Malignant transformation analysis |
| Identification of the aberrant gene expression in precancerous and cancerous lesions by comparing the gene expression of stem-like cells in diseased tissues with normal stem cells |
| Entrez ID | Symbol | Replicates | Species | Organ | Tissue | Adj P-value | Log2FC | Malignancy |
| 54212 | SNTG1 | cirrhotic2 | Human | Liver | Cirrhotic | 4.06e-02 | -7.06e-02 | 0.0201 |
| 54212 | SNTG1 | HCC1 | Human | Liver | HCC | 6.01e-11 | 1.11e+00 | 0.5336 |
| 54212 | SNTG1 | HCC2 | Human | Liver | HCC | 2.01e-05 | 2.18e-01 | 0.5341 |
| 54212 | SNTG1 | Pt13.a | Human | Liver | HCC | 4.06e-02 | -7.06e-02 | 0.021 |
| 54212 | SNTG1 | S014 | Human | Liver | HCC | 1.39e-17 | 9.44e-01 | 0.2254 |
| 54212 | SNTG1 | S015 | Human | Liver | HCC | 3.48e-13 | 7.53e-01 | 0.2375 |
| 54212 | SNTG1 | S016 | Human | Liver | HCC | 2.17e-31 | 1.23e+00 | 0.2243 |
| 54212 | SNTG1 | HTA12-15-2 | Human | Pancreas | PDAC | 4.47e-05 | 4.90e-01 | 0.2315 |
| 54212 | SNTG1 | HTA12-23-1 | Human | Pancreas | PDAC | 5.20e-08 | 8.41e-01 | 0.3405 |
| 54212 | SNTG1 | HTA12-25-1 | Human | Pancreas | PDAC | 3.68e-04 | 5.24e-01 | 0.313 |
| 54212 | SNTG1 | HTA12-26-1 | Human | Pancreas | PDAC | 2.67e-04 | 4.95e-01 | 0.3728 |
| 54212 | SNTG1 | HTA12-29-1 | Human | Pancreas | PDAC | 6.45e-37 | 9.89e-01 | 0.3722 |
| 54212 | SNTG1 | HTA12-32-1 | Human | Pancreas | PDAC | 1.11e-06 | 1.18e+00 | 0.3624 |
| 54212 | SNTG1 | HTA12-9-3 | Human | Pancreas | PDAC | 1.07e-02 | 5.26e-01 | 0.2045 |
| Page: 1 |
| Tissue | Expression Dynamics | Abbreviation |
| Liver | 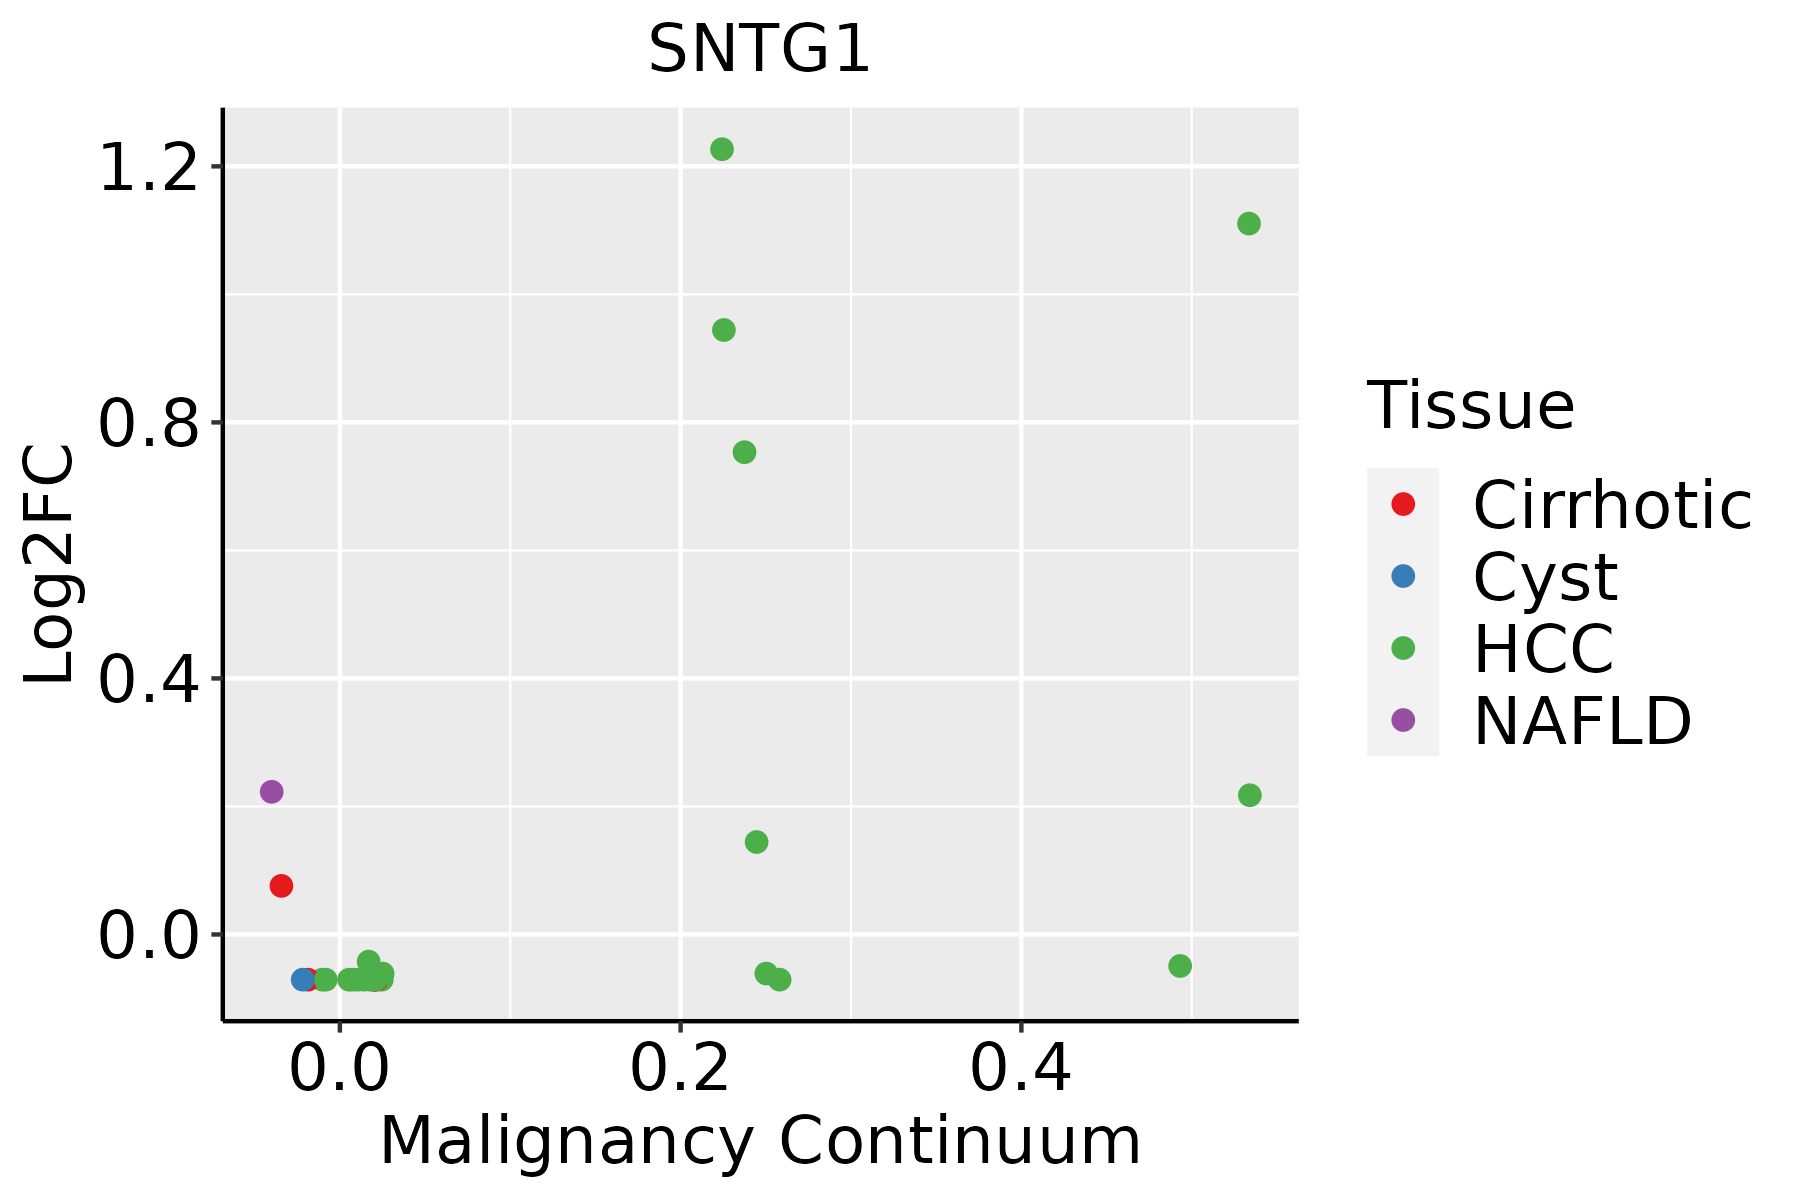 | HCC: Hepatocellular carcinoma |
| NAFLD: Non-alcoholic fatty liver disease |
| ∗log2FC in expression of this searched gene in stem-like cells from each diseased tissue sample relative to stem-like cells in normal samples in each tissue plotted against the malignancy continuum. Samples are colored based on if they are from different disease stage. |
Top |
Malignant transformation related pathway analysis |
| Find out the enriched GO biological processes and KEGG pathways involved in transition from healthy to precancer to cancer |
| Tissue | Disease Stage | Enriched GO biological Processes |
| Colorectum | AD |  |
| Colorectum | SER |  |
| Colorectum | MSS |  |
| Colorectum | MSI-H |  |
| Colorectum | FAP |  |
| ∗Top 15 enriched GO BP terms are showed in the bar plot of each disease state in each tissue. Each row represents a significant GO biological process which is colored according to the -log10(p.adjust). |
| Page: 1 2 3 4 5 6 7 8 9 |
| GO ID | Tissue | Disease Stage | Description | Gene Ratio | Bg Ratio | pvalue | p.adjust | Count |
| Page: 1 |
| Pathway ID | Tissue | Disease Stage | Description | Gene Ratio | Bg Ratio | pvalue | p.adjust | qvalue | Count |
| Page: 1 |
Top |
Cell-cell communication analysis |
| Identification of potential cell-cell interactions between two cell types and their ligand-receptor pairs for different disease states |
| Ligand | Receptor | LRpair | Pathway | Tissue | Disease Stage |
| Page: 1 |
Top |
Single-cell gene regulatory network inference analysis |
| Find out the significant the regulons (TFs) and the target genes of each regulon across cell types for different disease states |
| TF | Cell Type | Tissue | Disease Stage | Target Gene | RSS | Regulon Activity |
| ∗The dot plots of a searched regulon are shown for all cell subpopulations in each disease state of each tissue based on the regulon specific score inferred using pySCENIC and by calculating the average expression. |
| Page: 1 |
Top |
Somatic mutation of malignant transformation related genes |
| Annotation of somatic variants for genes involved in malignant transformation |
| Hugo Symbol | Variant Class | Variant Classification | dbSNP RS | HGVSc | HGVSp | HGVSp Short | SWISSPROT | BIOTYPE | SIFT | PolyPhen | Tumor Sample Barcode | Tissue | Histology | Sex | Age | Stage | Therapy Types | Drugs | Outcome |
| SNTG1 | SNV | Missense_Mutation | rs756659910 | c.1060N>T | p.Arg354Trp | p.R354W | Q9NSN8 | protein_coding | deleterious(0.02) | probably_damaging(0.988) | TCGA-A2-A0EU-01 | Breast | breast invasive carcinoma | Female | >=65 | I/II | Unknown | Unknown | SD |
| SNTG1 | SNV | Missense_Mutation | novel | c.292C>A | p.Leu98Ile | p.L98I | Q9NSN8 | protein_coding | deleterious(0.03) | probably_damaging(0.982) | TCGA-AR-A2LR-01 | Breast | breast invasive carcinoma | Female | <65 | I/II | Chemotherapy | adriamycin | SD |
| SNTG1 | SNV | Missense_Mutation | c.287N>T | p.Ser96Leu | p.S96L | Q9NSN8 | protein_coding | deleterious(0.01) | probably_damaging(0.977) | TCGA-BH-A0B5-01 | Breast | breast invasive carcinoma | Female | <65 | III/IV | Chemotherapy | adriamycin | CR | |
| SNTG1 | SNV | Missense_Mutation | c.1365N>T | p.Gln455His | p.Q455H | Q9NSN8 | protein_coding | deleterious(0.01) | probably_damaging(0.965) | TCGA-BH-A0RX-01 | Breast | breast invasive carcinoma | Female | <65 | I/II | Chemotherapy | fluorouracil | SD | |
| SNTG1 | SNV | Missense_Mutation | novel | c.1330N>A | p.Asp444Asn | p.D444N | Q9NSN8 | protein_coding | deleterious(0) | probably_damaging(0.971) | TCGA-BH-A1F0-01 | Breast | breast invasive carcinoma | Female | >=65 | I/II | Unknown | Unknown | PD |
| SNTG1 | SNV | Missense_Mutation | c.413T>C | p.Phe138Ser | p.F138S | Q9NSN8 | protein_coding | deleterious(0) | probably_damaging(0.939) | TCGA-D8-A27M-01 | Breast | breast invasive carcinoma | Female | <65 | I/II | Chemotherapy | methotrexate+5 | SD | |
| SNTG1 | SNV | Missense_Mutation | novel | c.684N>C | p.Gln228His | p.Q228H | Q9NSN8 | protein_coding | tolerated(0.57) | benign(0.28) | TCGA-XX-A89A-01 | Breast | breast invasive carcinoma | Female | >=65 | I/II | Unknown | Unknown | SD |
| SNTG1 | SNV | Missense_Mutation | rs768385931 | c.643N>T | p.Arg215Cys | p.R215C | Q9NSN8 | protein_coding | deleterious(0.01) | probably_damaging(0.982) | TCGA-ZJ-AAXU-01 | Cervix | cervical & endocervical cancer | Female | <65 | I/II | Unknown | Unknown | SD |
| SNTG1 | SNV | Missense_Mutation | c.64C>G | p.Gln22Glu | p.Q22E | Q9NSN8 | protein_coding | tolerated(0.96) | benign(0) | TCGA-AA-3660-01 | Colorectum | colon adenocarcinoma | Female | <65 | I/II | Unknown | Unknown | SD | |
| SNTG1 | SNV | Missense_Mutation | c.239T>G | p.Ile80Ser | p.I80S | Q9NSN8 | protein_coding | deleterious(0) | benign(0.293) | TCGA-AA-3842-01 | Colorectum | colon adenocarcinoma | Male | <65 | III/IV | Chemotherapy | folinic | PD |
| Page: 1 2 3 4 5 6 7 8 9 10 11 12 13 14 15 16 |
Top |
Related drugs of malignant transformation related genes |
| Identification of chemicals and drugs interact with genes involved in malignant transfromation |
| (DGIdb 4.0) |
| Entrez ID | Symbol | Category | Interaction Types | Drug Claim Name | Drug Name | PMIDs |
| Page: 1 |

Copyright 2023-Present -The University of Texas Health Science Center at Houston |