
|
|||||
|
 | |
| |
| |
| |
| |
| |
|
Gene: SNTB1 |
Gene summary for SNTB1 |
| Gene information | Species | Human | Gene symbol | SNTB1 | Gene ID | 6641 |
| Gene name | syntrophin beta 1 | |
| Gene Alias | 59-DAP | |
| Cytomap | 8q24.12 | |
| Gene Type | protein-coding | GO ID | GO:0003008 | UniProtAcc | Q13884 |
Top |
Malignant transformation analysis |
| Identification of the aberrant gene expression in precancerous and cancerous lesions by comparing the gene expression of stem-like cells in diseased tissues with normal stem cells |
| Entrez ID | Symbol | Replicates | Species | Organ | Tissue | Adj P-value | Log2FC | Malignancy |
| 6641 | SNTB1 | HTA11_2487_2000001011 | Human | Colorectum | SER | 6.55e-06 | -4.53e-01 | -0.1808 |
| 6641 | SNTB1 | HTA11_347_2000001011 | Human | Colorectum | AD | 2.28e-10 | -4.15e-01 | -0.1954 |
| 6641 | SNTB1 | HTA11_3361_2000001011 | Human | Colorectum | AD | 2.42e-05 | -4.84e-01 | -0.1207 |
| 6641 | SNTB1 | HTA11_83_2000001011 | Human | Colorectum | SER | 4.14e-02 | -4.15e-01 | -0.1526 |
| 6641 | SNTB1 | HTA11_5212_2000001011 | Human | Colorectum | AD | 4.26e-02 | -5.07e-01 | -0.2061 |
| 6641 | SNTB1 | HTA11_7696_3000711011 | Human | Colorectum | AD | 1.20e-03 | -2.65e-01 | 0.0674 |
| 6641 | SNTB1 | HTA11_99999970781_79442 | Human | Colorectum | MSS | 3.41e-05 | 5.34e-01 | 0.294 |
| 6641 | SNTB1 | HTA11_99999965062_69753 | Human | Colorectum | MSI-H | 1.53e-04 | 1.30e+00 | 0.3487 |
| 6641 | SNTB1 | HTA11_99999965104_69814 | Human | Colorectum | MSS | 1.08e-02 | 7.03e-01 | 0.281 |
| 6641 | SNTB1 | HTA11_99999971662_82457 | Human | Colorectum | MSS | 5.55e-28 | 1.42e+00 | 0.3859 |
| 6641 | SNTB1 | HTA11_99999974143_84620 | Human | Colorectum | MSS | 4.46e-03 | 3.34e-01 | 0.3005 |
| 6641 | SNTB1 | A001-C-207 | Human | Colorectum | FAP | 2.06e-07 | 6.24e-01 | 0.1278 |
| 6641 | SNTB1 | A015-C-203 | Human | Colorectum | FAP | 7.61e-09 | 2.89e-03 | -0.1294 |
| 6641 | SNTB1 | A002-C-201 | Human | Colorectum | FAP | 3.47e-08 | 3.65e-01 | 0.0324 |
| 6641 | SNTB1 | A002-C-203 | Human | Colorectum | FAP | 6.10e-06 | 5.16e-01 | 0.2786 |
| 6641 | SNTB1 | A001-C-108 | Human | Colorectum | FAP | 1.03e-12 | 5.02e-01 | -0.0272 |
| 6641 | SNTB1 | A002-C-021 | Human | Colorectum | FAP | 4.39e-04 | 5.11e-01 | 0.1171 |
| 6641 | SNTB1 | A002-C-205 | Human | Colorectum | FAP | 2.64e-09 | 1.53e-01 | -0.1236 |
| 6641 | SNTB1 | A001-C-104 | Human | Colorectum | FAP | 4.30e-11 | 6.28e-01 | 0.0184 |
| 6641 | SNTB1 | A015-C-006 | Human | Colorectum | FAP | 1.15e-06 | -8.63e-02 | -0.0994 |
| Page: 1 2 3 4 |
| Tissue | Expression Dynamics | Abbreviation |
| Colorectum (GSE201348) |  | FAP: Familial adenomatous polyposis |
| CRC: Colorectal cancer | ||
| Colorectum (HTA11) |  | AD: Adenomas |
| SER: Sessile serrated lesions | ||
| MSI-H: Microsatellite-high colorectal cancer | ||
| MSS: Microsatellite stable colorectal cancer | ||
| Liver |  | HCC: Hepatocellular carcinoma |
| NAFLD: Non-alcoholic fatty liver disease | ||
| Lung | 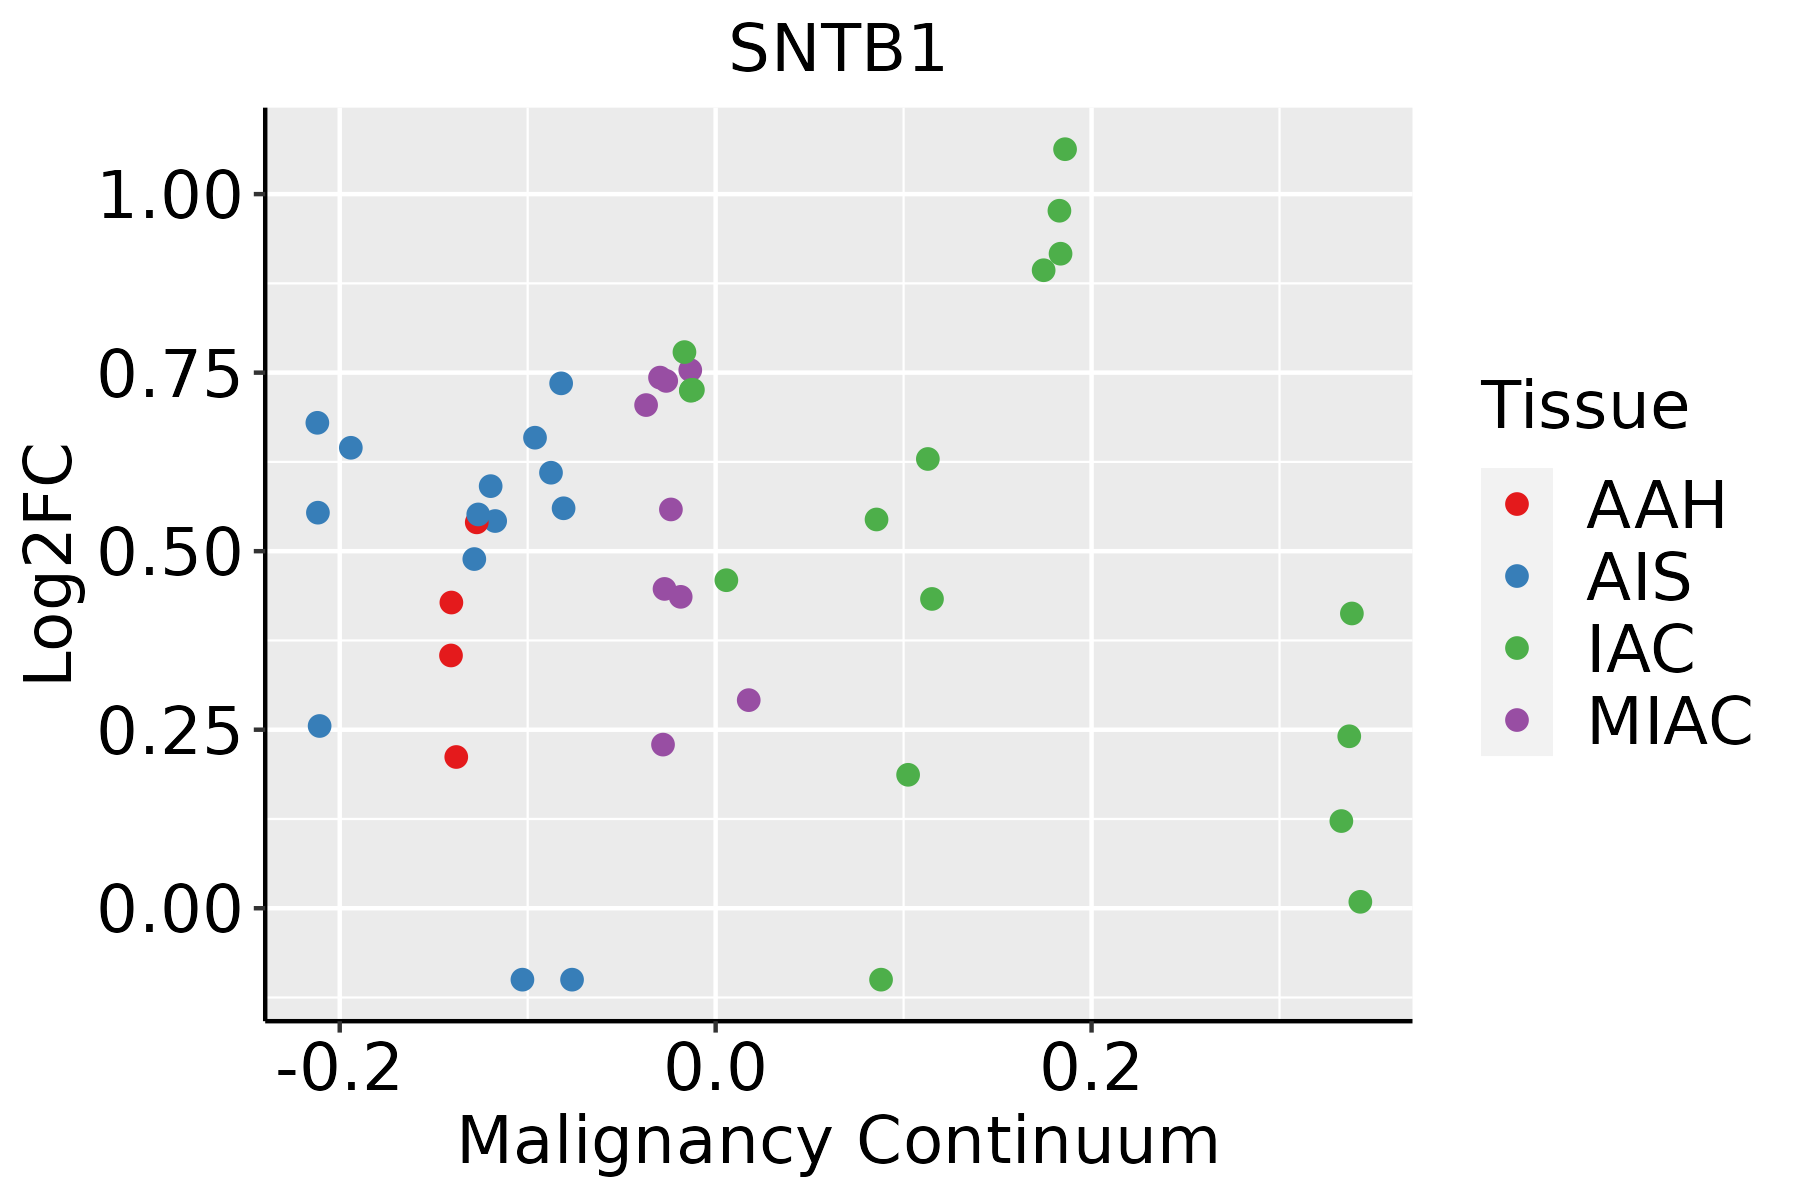 | AAH: Atypical adenomatous hyperplasia |
| AIS: Adenocarcinoma in situ | ||
| IAC: Invasive lung adenocarcinoma | ||
| MIA: Minimally invasive adenocarcinoma |
| ∗log2FC in expression of this searched gene in stem-like cells from each diseased tissue sample relative to stem-like cells in normal samples in each tissue plotted against the malignancy continuum. Samples are colored based on if they are from different disease stage. |
Top |
Malignant transformation related pathway analysis |
| Find out the enriched GO biological processes and KEGG pathways involved in transition from healthy to precancer to cancer |
| Tissue | Disease Stage | Enriched GO biological Processes |
| Colorectum | AD |  |
| Colorectum | SER |  |
| Colorectum | MSS |  |
| Colorectum | MSI-H |  |
| Colorectum | FAP |  |
| ∗Top 15 enriched GO BP terms are showed in the bar plot of each disease state in each tissue. Each row represents a significant GO biological process which is colored according to the -log10(p.adjust). |
| Page: 1 2 3 4 5 6 7 8 9 |
| GO ID | Tissue | Disease Stage | Description | Gene Ratio | Bg Ratio | pvalue | p.adjust | Count |
| GO:0003012 | Colorectum | SER | muscle system process | 92/2897 | 452/18723 | 2.98e-03 | 2.63e-02 | 92 |
| GO:00030121 | Colorectum | MSS | muscle system process | 105/3467 | 452/18723 | 6.39e-03 | 4.26e-02 | 105 |
| GO:00030122 | Colorectum | FAP | muscle system process | 89/2622 | 452/18723 | 4.63e-04 | 5.39e-03 | 89 |
| GO:00030123 | Colorectum | CRC | muscle system process | 74/2078 | 452/18723 | 3.92e-04 | 5.80e-03 | 74 |
| GO:00030124 | Lung | IAC | muscle system process | 71/2061 | 452/18723 | 1.29e-03 | 1.45e-02 | 71 |
| GO:000301211 | Lung | AIS | muscle system process | 63/1849 | 452/18723 | 3.18e-03 | 3.05e-02 | 63 |
| Page: 1 |
| Pathway ID | Tissue | Disease Stage | Description | Gene Ratio | Bg Ratio | pvalue | p.adjust | qvalue | Count |
| Page: 1 |
Top |
Cell-cell communication analysis |
| Identification of potential cell-cell interactions between two cell types and their ligand-receptor pairs for different disease states |
| Ligand | Receptor | LRpair | Pathway | Tissue | Disease Stage |
| Page: 1 |
Top |
Single-cell gene regulatory network inference analysis |
| Find out the significant the regulons (TFs) and the target genes of each regulon across cell types for different disease states |
| TF | Cell Type | Tissue | Disease Stage | Target Gene | RSS | Regulon Activity |
| ∗The dot plots of a searched regulon are shown for all cell subpopulations in each disease state of each tissue based on the regulon specific score inferred using pySCENIC and by calculating the average expression. |
| Page: 1 |
Top |
Somatic mutation of malignant transformation related genes |
| Annotation of somatic variants for genes involved in malignant transformation |
| Hugo Symbol | Variant Class | Variant Classification | dbSNP RS | HGVSc | HGVSp | HGVSp Short | SWISSPROT | BIOTYPE | SIFT | PolyPhen | Tumor Sample Barcode | Tissue | Histology | Sex | Age | Stage | Therapy Types | Drugs | Outcome |
| SNTB1 | SNV | Missense_Mutation | novel | c.328N>C | p.Lys110Gln | p.K110Q | Q13884 | protein_coding | tolerated(0.07) | probably_damaging(0.969) | TCGA-AN-A046-01 | Breast | breast invasive carcinoma | Female | >=65 | I/II | Unknown | Unknown | SD |
| SNTB1 | SNV | Missense_Mutation | rs199549031 | c.1199N>T | p.Thr400Met | p.T400M | Q13884 | protein_coding | deleterious(0.02) | possibly_damaging(0.904) | TCGA-AO-A128-01 | Breast | breast invasive carcinoma | Female | <65 | I/II | Chemotherapy | doxorubicin | SD |
| SNTB1 | SNV | Missense_Mutation | rs746819066 | c.355N>C | p.Glu119Gln | p.E119Q | Q13884 | protein_coding | deleterious(0.01) | possibly_damaging(0.838) | TCGA-BH-A0DL-01 | Breast | breast invasive carcinoma | Female | <65 | I/II | Chemotherapy | cytoxan | CR |
| SNTB1 | SNV | Missense_Mutation | c.919G>A | p.Glu307Lys | p.E307K | Q13884 | protein_coding | deleterious(0) | possibly_damaging(0.566) | TCGA-C8-A1HE-01 | Breast | breast invasive carcinoma | Female | <65 | I/II | Unknown | Unknown | SD | |
| SNTB1 | SNV | Missense_Mutation | c.884N>G | p.Ser295Cys | p.S295C | Q13884 | protein_coding | deleterious(0.01) | possibly_damaging(0.687) | TCGA-JW-A5VL-01 | Cervix | cervical & endocervical cancer | Female | <65 | I/II | Unknown | Unknown | SD | |
| SNTB1 | SNV | Missense_Mutation | rs772200241 | c.775G>A | p.Asp259Asn | p.D259N | Q13884 | protein_coding | deleterious(0) | possibly_damaging(0.889) | TCGA-A6-5661-01 | Colorectum | colon adenocarcinoma | Female | >=65 | I/II | Unknown | Unknown | SD |
| SNTB1 | SNV | Missense_Mutation | c.1589N>G | p.Lys530Arg | p.K530R | Q13884 | protein_coding | deleterious(0) | probably_damaging(1) | TCGA-AA-3950-01 | Colorectum | colon adenocarcinoma | Female | >=65 | I/II | Unknown | Unknown | SD | |
| SNTB1 | SNV | Missense_Mutation | c.1610T>C | p.Val537Ala | p.V537A | Q13884 | protein_coding | deleterious(0) | benign(0.269) | TCGA-AA-A00N-01 | Colorectum | colon adenocarcinoma | Male | >=65 | I/II | Unknown | Unknown | PD | |
| SNTB1 | SNV | Missense_Mutation | rs754847025 | c.133G>A | p.Ala45Thr | p.A45T | Q13884 | protein_coding | tolerated(0.84) | benign(0.025) | TCGA-AA-A010-01 | Colorectum | colon adenocarcinoma | Female | <65 | I/II | Chemotherapy | folinic | CR |
| SNTB1 | SNV | Missense_Mutation | rs749144227 | c.1439A>C | p.Gln480Pro | p.Q480P | Q13884 | protein_coding | deleterious(0.03) | possibly_damaging(0.514) | TCGA-AZ-4615-01 | Colorectum | colon adenocarcinoma | Male | >=65 | III/IV | Chemotherapy | xeloda | PD |
| Page: 1 2 3 4 5 6 |
Top |
Related drugs of malignant transformation related genes |
| Identification of chemicals and drugs interact with genes involved in malignant transfromation |
| (DGIdb 4.0) |
| Entrez ID | Symbol | Category | Interaction Types | Drug Claim Name | Drug Name | PMIDs |
| Page: 1 |

Copyright 2023-Present -The University of Texas Health Science Center at Houston |