
|
|||||
|
 | |
| |
| |
| |
| |
| |
|
Gene: SNRPB2 |
Gene summary for SNRPB2 |
| Gene information | Species | Human | Gene symbol | SNRPB2 | Gene ID | 6629 |
| Gene name | small nuclear ribonucleoprotein polypeptide B2 | |
| Gene Alias | Msl1 | |
| Cytomap | 20p12.1 | |
| Gene Type | protein-coding | GO ID | GO:0000375 | UniProtAcc | P08579 |
Top |
Malignant transformation analysis |
| Identification of the aberrant gene expression in precancerous and cancerous lesions by comparing the gene expression of stem-like cells in diseased tissues with normal stem cells |
| Entrez ID | Symbol | Replicates | Species | Organ | Tissue | Adj P-value | Log2FC | Malignancy |
| 6629 | SNRPB2 | GSM4909281 | Human | Breast | IDC | 4.41e-04 | 3.12e-01 | 0.21 |
| 6629 | SNRPB2 | GSM4909282 | Human | Breast | IDC | 3.45e-10 | 3.99e-01 | -0.0288 |
| 6629 | SNRPB2 | GSM4909291 | Human | Breast | IDC | 8.27e-05 | 3.57e-01 | 0.1753 |
| 6629 | SNRPB2 | GSM4909292 | Human | Breast | IDC | 1.27e-14 | 9.10e-01 | 0.1236 |
| 6629 | SNRPB2 | GSM4909294 | Human | Breast | IDC | 3.34e-04 | 9.39e-02 | 0.2022 |
| 6629 | SNRPB2 | GSM4909295 | Human | Breast | IDC | 8.29e-04 | 3.92e-01 | 0.0898 |
| 6629 | SNRPB2 | GSM4909296 | Human | Breast | IDC | 1.72e-09 | 5.27e-02 | 0.1524 |
| 6629 | SNRPB2 | GSM4909297 | Human | Breast | IDC | 7.17e-20 | 1.31e-01 | 0.1517 |
| 6629 | SNRPB2 | GSM4909298 | Human | Breast | IDC | 4.51e-04 | 2.99e-01 | 0.1551 |
| 6629 | SNRPB2 | GSM4909311 | Human | Breast | IDC | 1.01e-35 | -9.11e-02 | 0.1534 |
| 6629 | SNRPB2 | GSM4909312 | Human | Breast | IDC | 3.83e-16 | 1.07e-01 | 0.1552 |
| 6629 | SNRPB2 | GSM4909315 | Human | Breast | IDC | 1.40e-06 | 3.54e-01 | 0.21 |
| 6629 | SNRPB2 | GSM4909316 | Human | Breast | IDC | 1.20e-02 | 2.99e-01 | 0.21 |
| 6629 | SNRPB2 | GSM4909317 | Human | Breast | IDC | 2.84e-78 | 1.12e+00 | 0.1355 |
| 6629 | SNRPB2 | GSM4909318 | Human | Breast | IDC | 2.23e-39 | 1.23e+00 | 0.2031 |
| 6629 | SNRPB2 | GSM4909319 | Human | Breast | IDC | 1.26e-36 | -2.92e-01 | 0.1563 |
| 6629 | SNRPB2 | GSM4909320 | Human | Breast | IDC | 1.76e-08 | -2.70e-01 | 0.1575 |
| 6629 | SNRPB2 | GSM4909321 | Human | Breast | IDC | 2.23e-19 | -2.04e-01 | 0.1559 |
| 6629 | SNRPB2 | brca2 | Human | Breast | Precancer | 6.99e-08 | 3.45e-01 | -0.024 |
| 6629 | SNRPB2 | brca3 | Human | Breast | Precancer | 1.80e-14 | 3.82e-01 | -0.0263 |
| Page: 1 2 3 4 5 6 7 8 9 10 11 |
| Tissue | Expression Dynamics | Abbreviation |
| Breast | 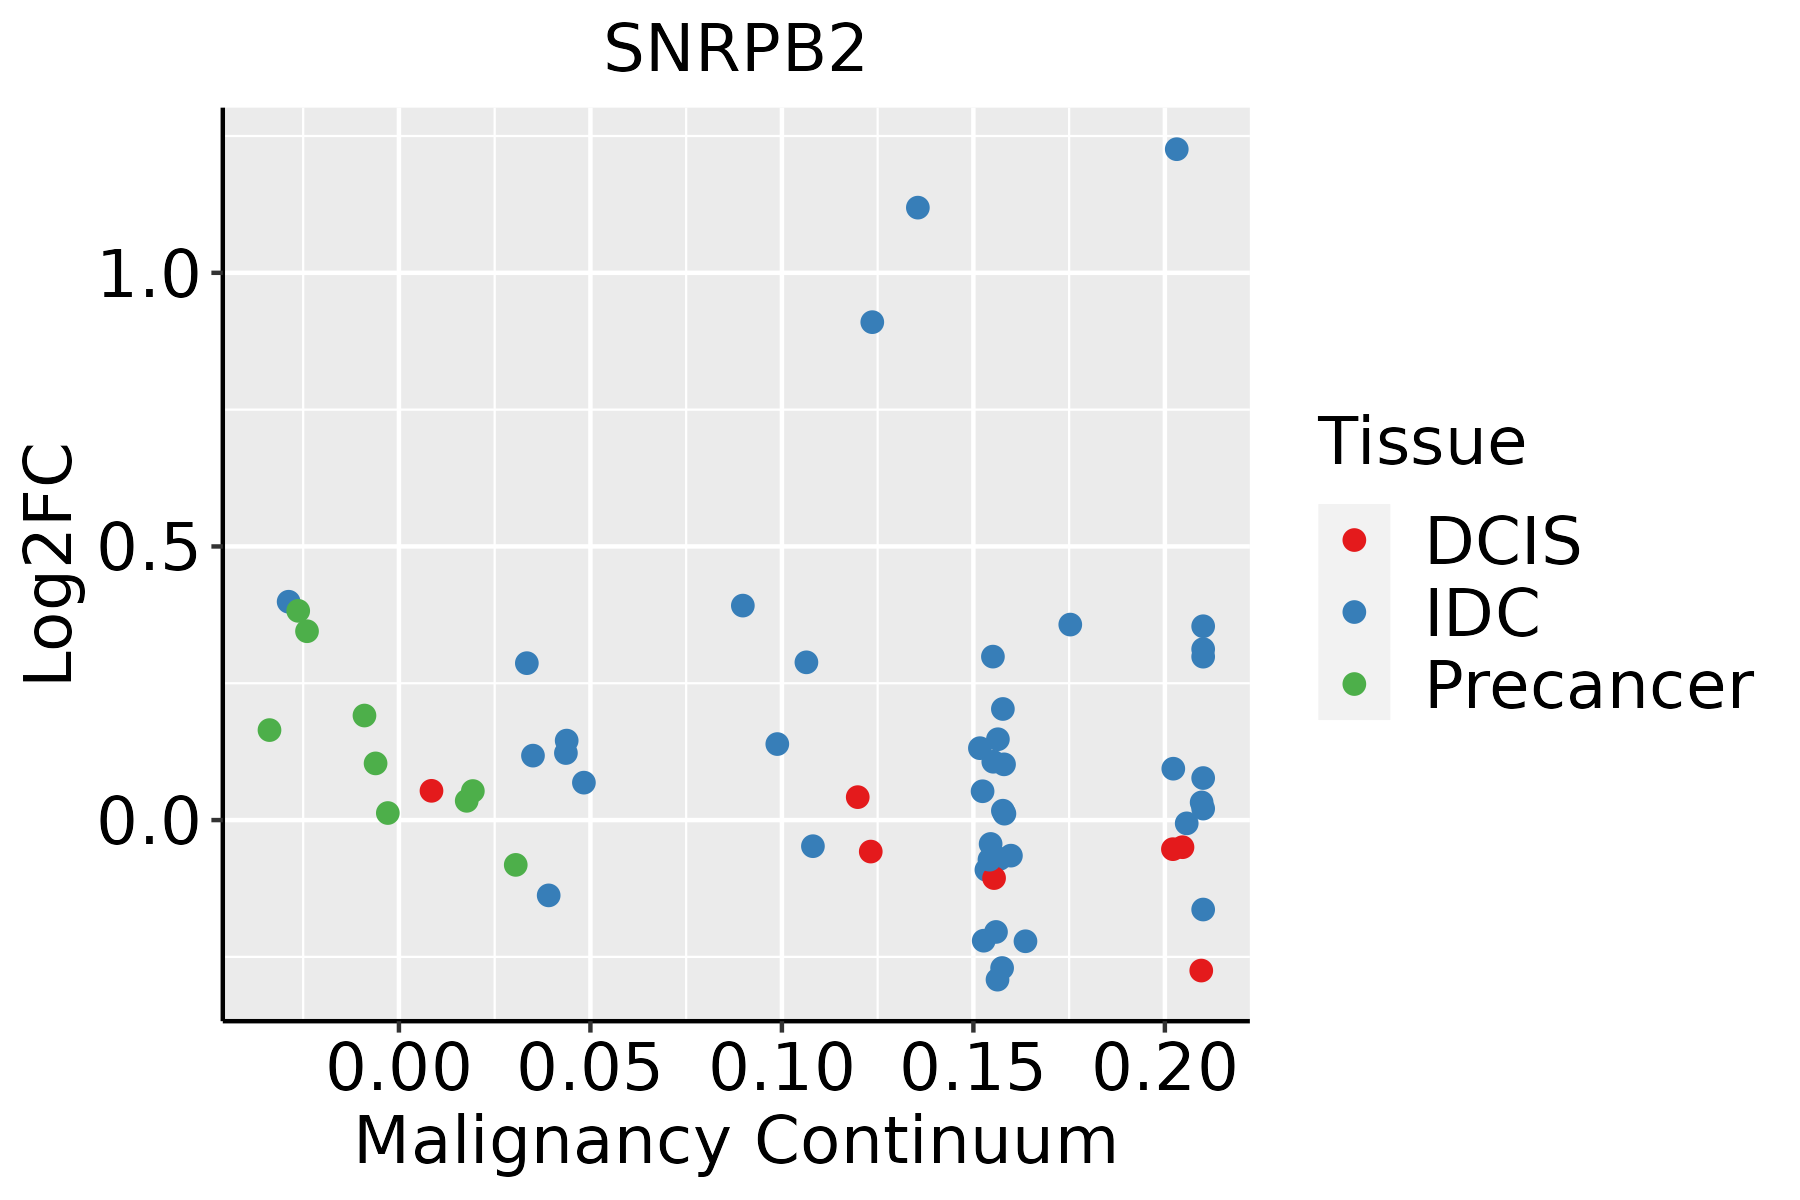 | IDC: Invasive ductal carcinoma |
| DCIS: Ductal carcinoma in situ | ||
| Precancer(BRCA1-mut): Precancerous lesion from BRCA1 mutation carriers | ||
| Colorectum (GSE201348) |  | FAP: Familial adenomatous polyposis |
| CRC: Colorectal cancer | ||
| Colorectum (HTA11) |  | AD: Adenomas |
| SER: Sessile serrated lesions | ||
| MSI-H: Microsatellite-high colorectal cancer | ||
| MSS: Microsatellite stable colorectal cancer | ||
| Endometrium | 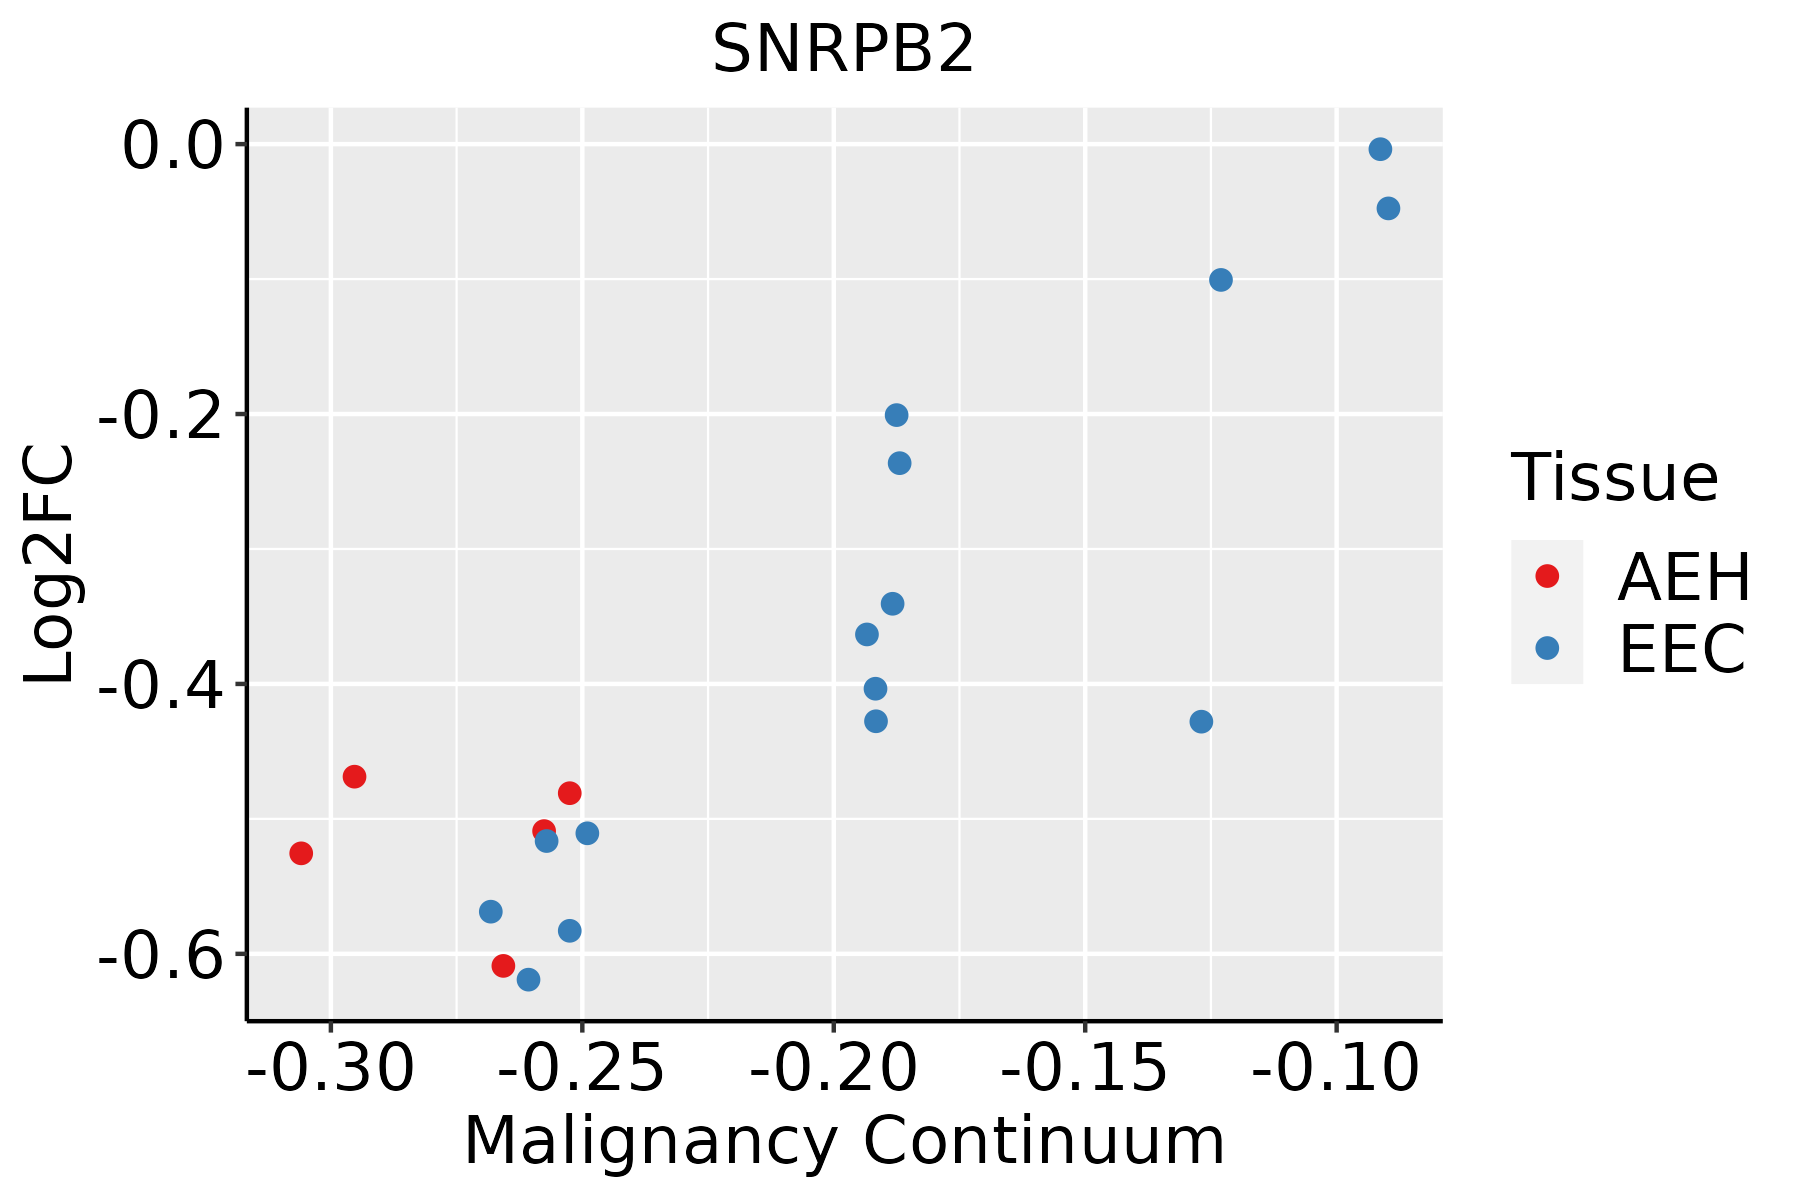 | AEH: Atypical endometrial hyperplasia |
| EEC: Endometrioid Cancer | ||
| Esophagus | 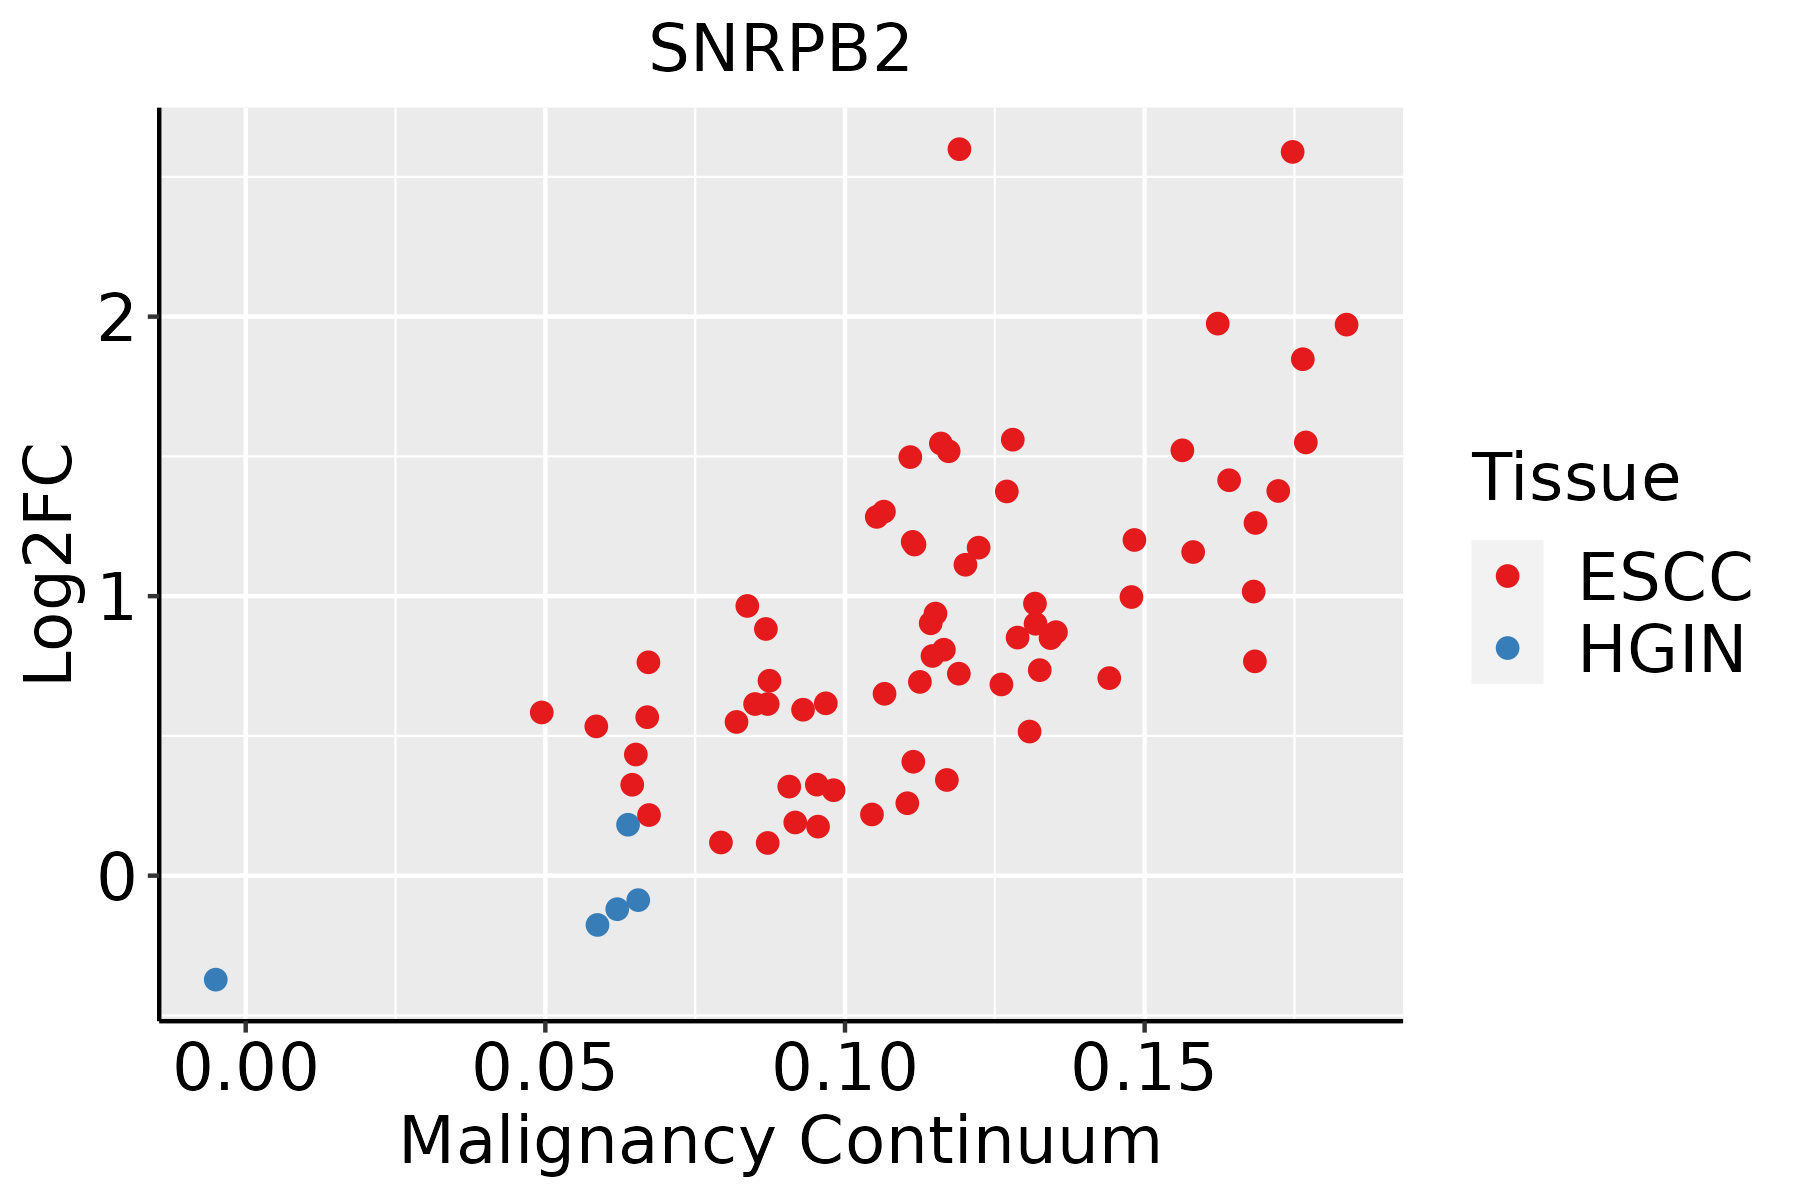 | ESCC: Esophageal squamous cell carcinoma |
| HGIN: High-grade intraepithelial neoplasias | ||
| LGIN: Low-grade intraepithelial neoplasias | ||
| Liver | 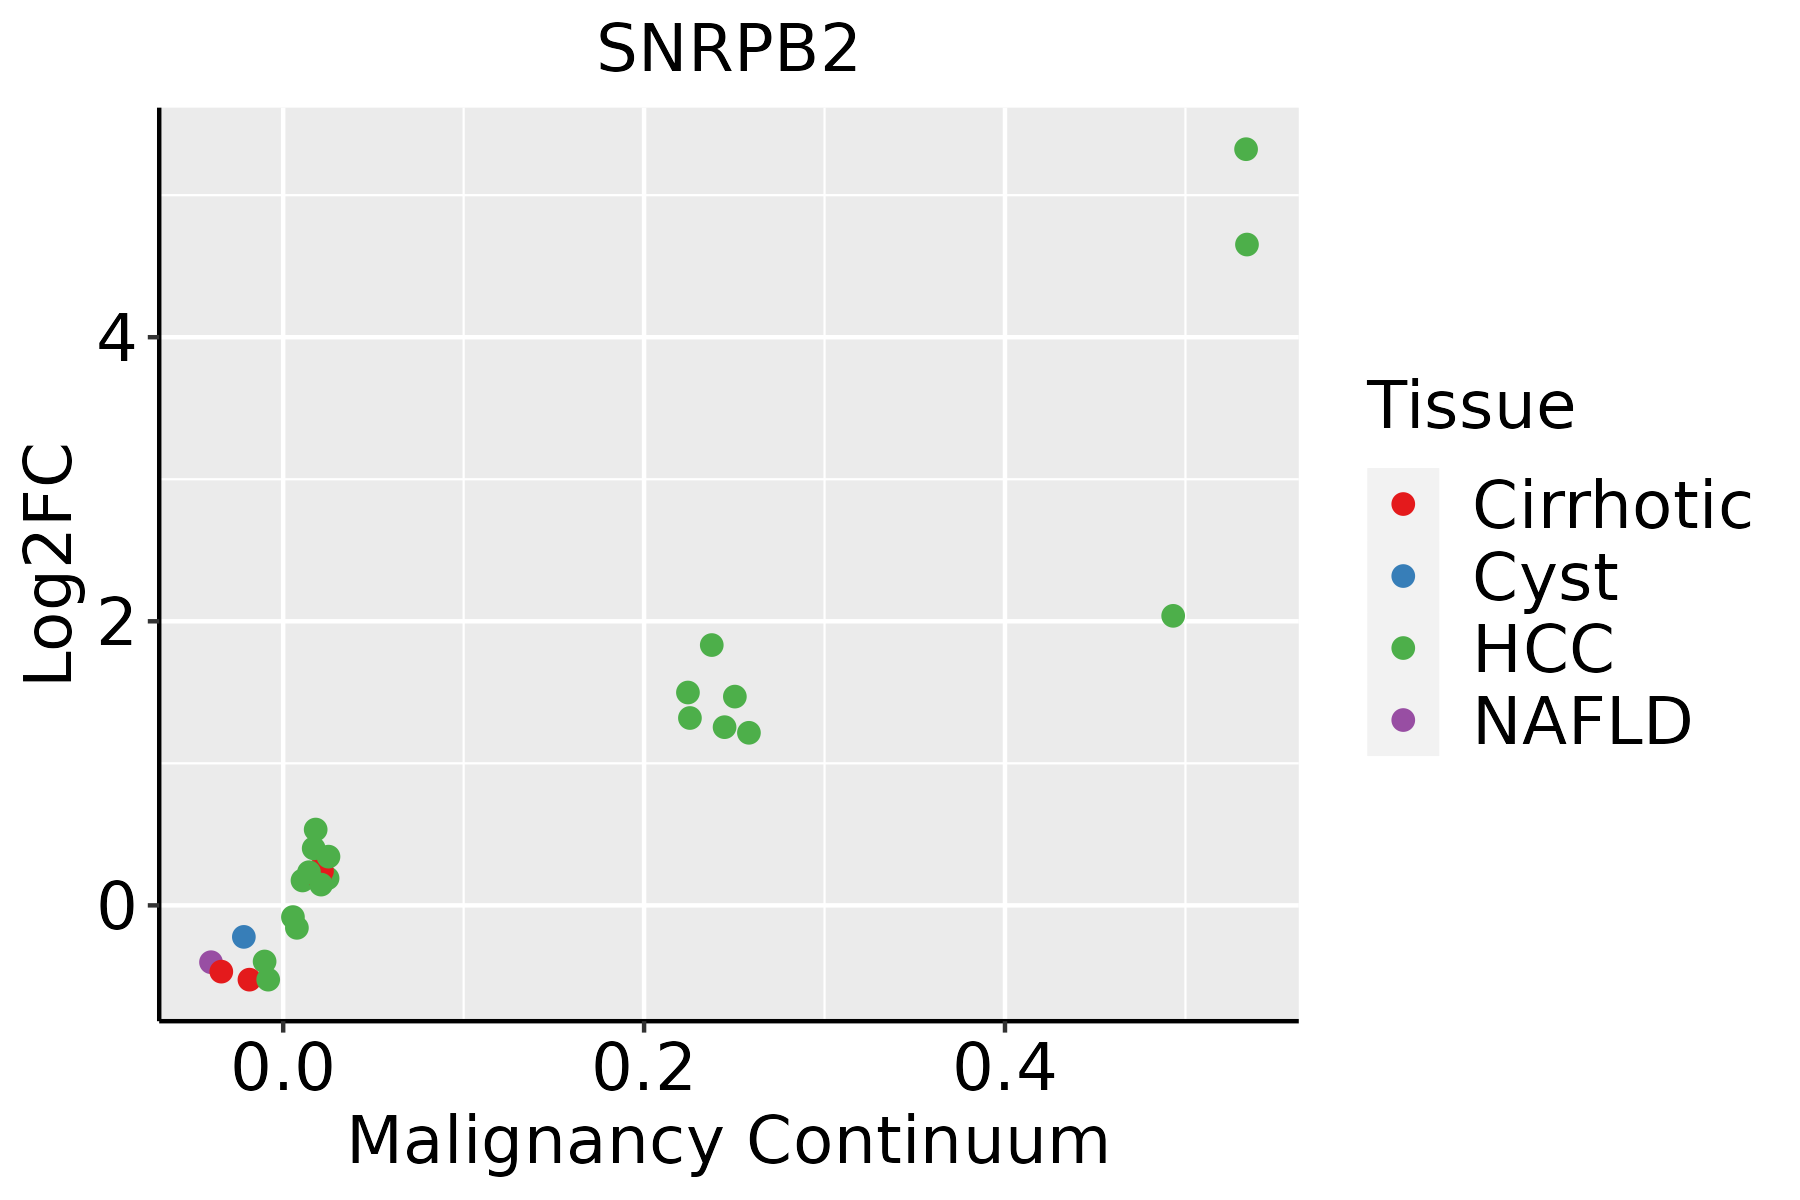 | HCC: Hepatocellular carcinoma |
| NAFLD: Non-alcoholic fatty liver disease | ||
| Oral Cavity |  | EOLP: Erosive Oral lichen planus |
| LP: leukoplakia | ||
| NEOLP: Non-erosive oral lichen planus | ||
| OSCC: Oral squamous cell carcinoma | ||
| Prostate | 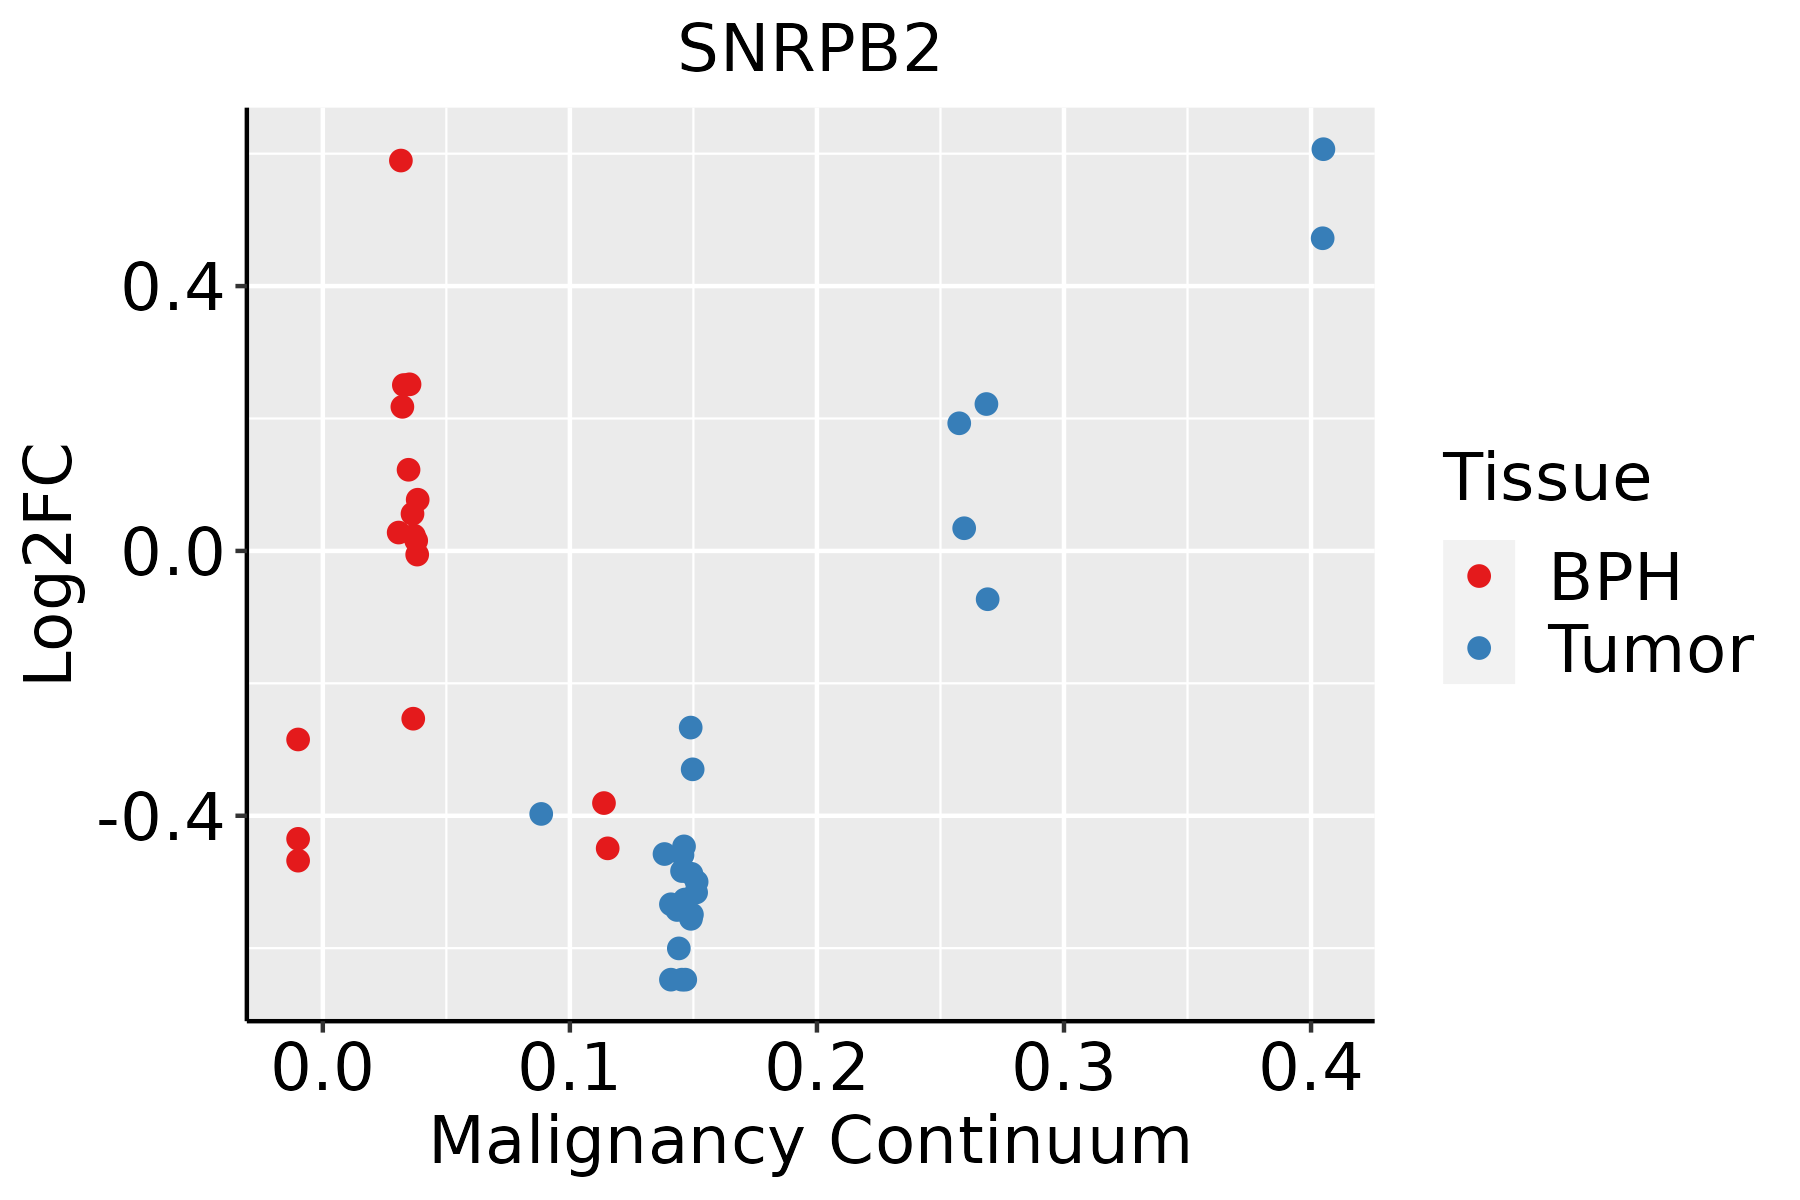 | BPH: Benign Prostatic Hyperplasia |
| Skin | 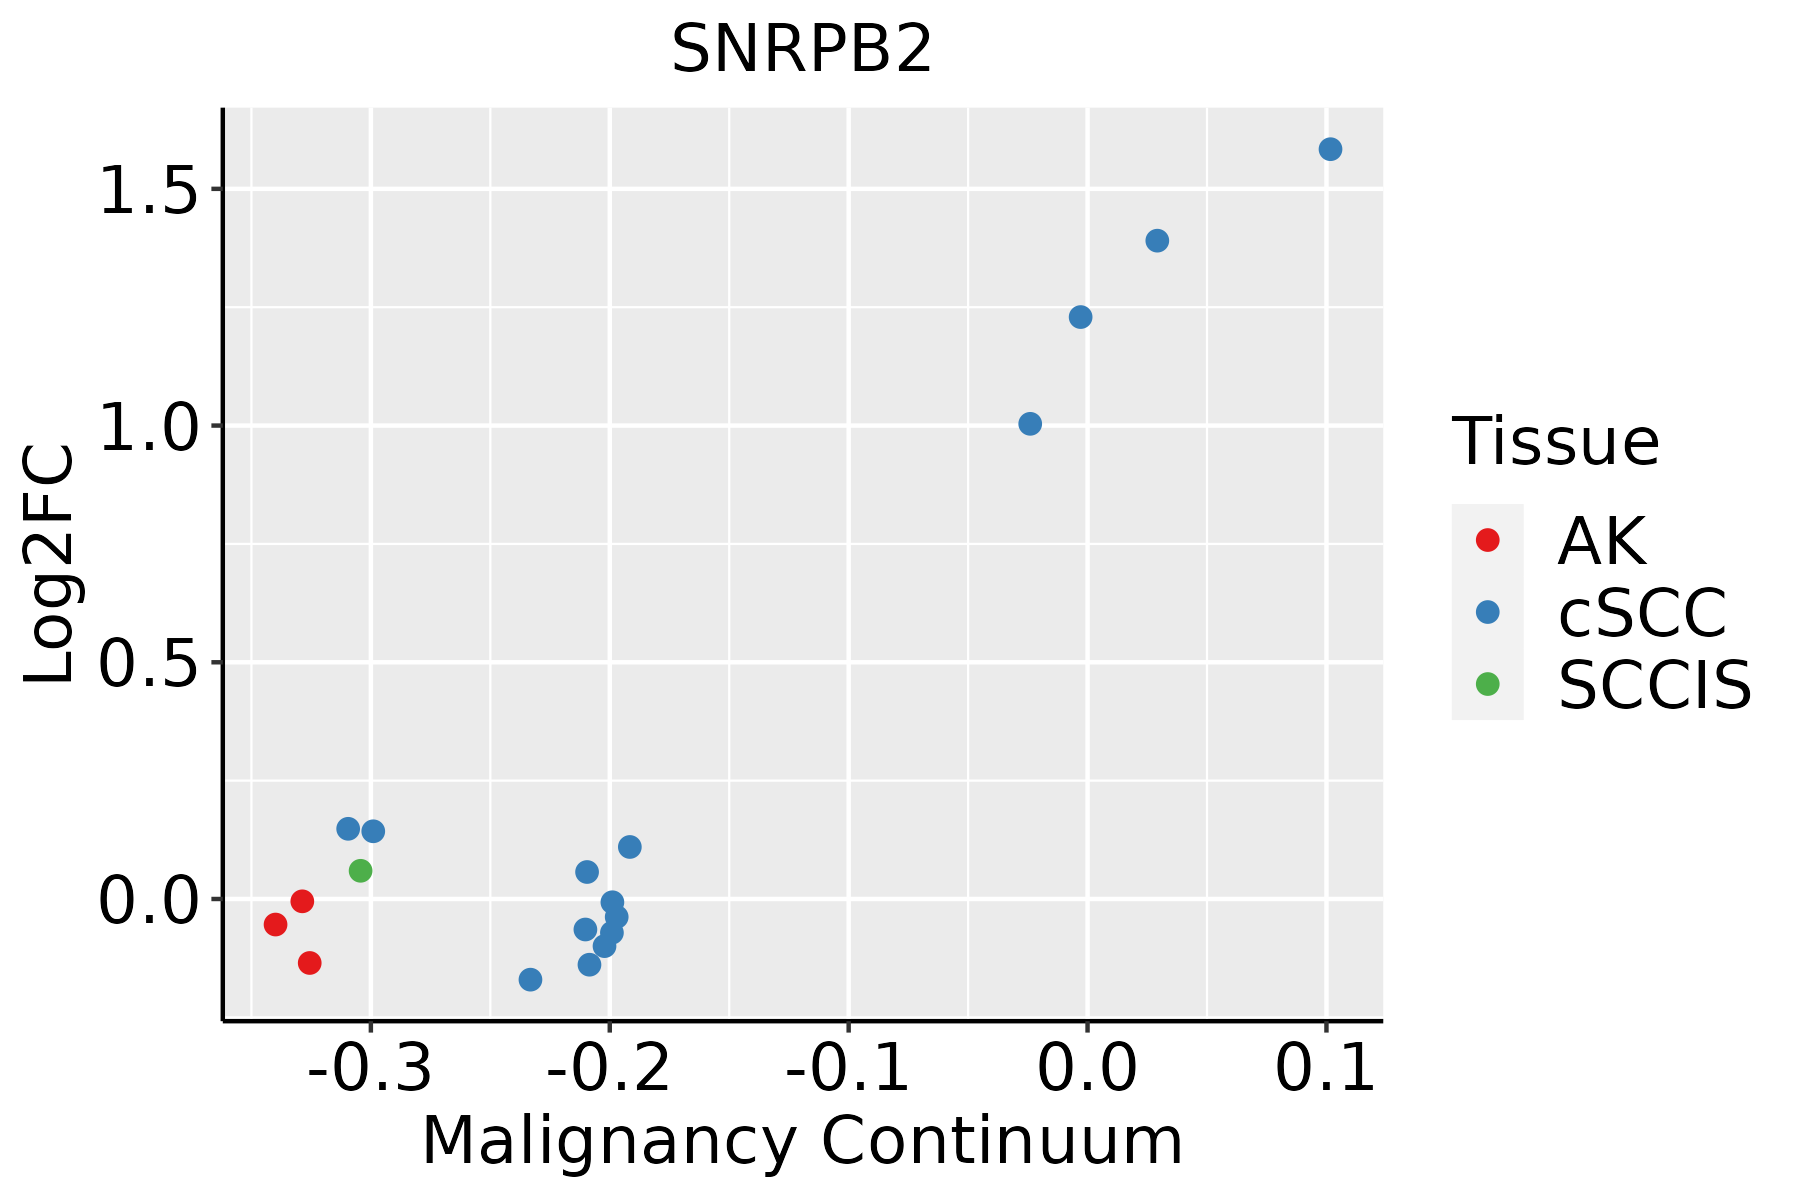 | AK: Actinic keratosis |
| cSCC: Cutaneous squamous cell carcinoma | ||
| SCCIS:squamous cell carcinoma in situ | ||
| Thyroid | 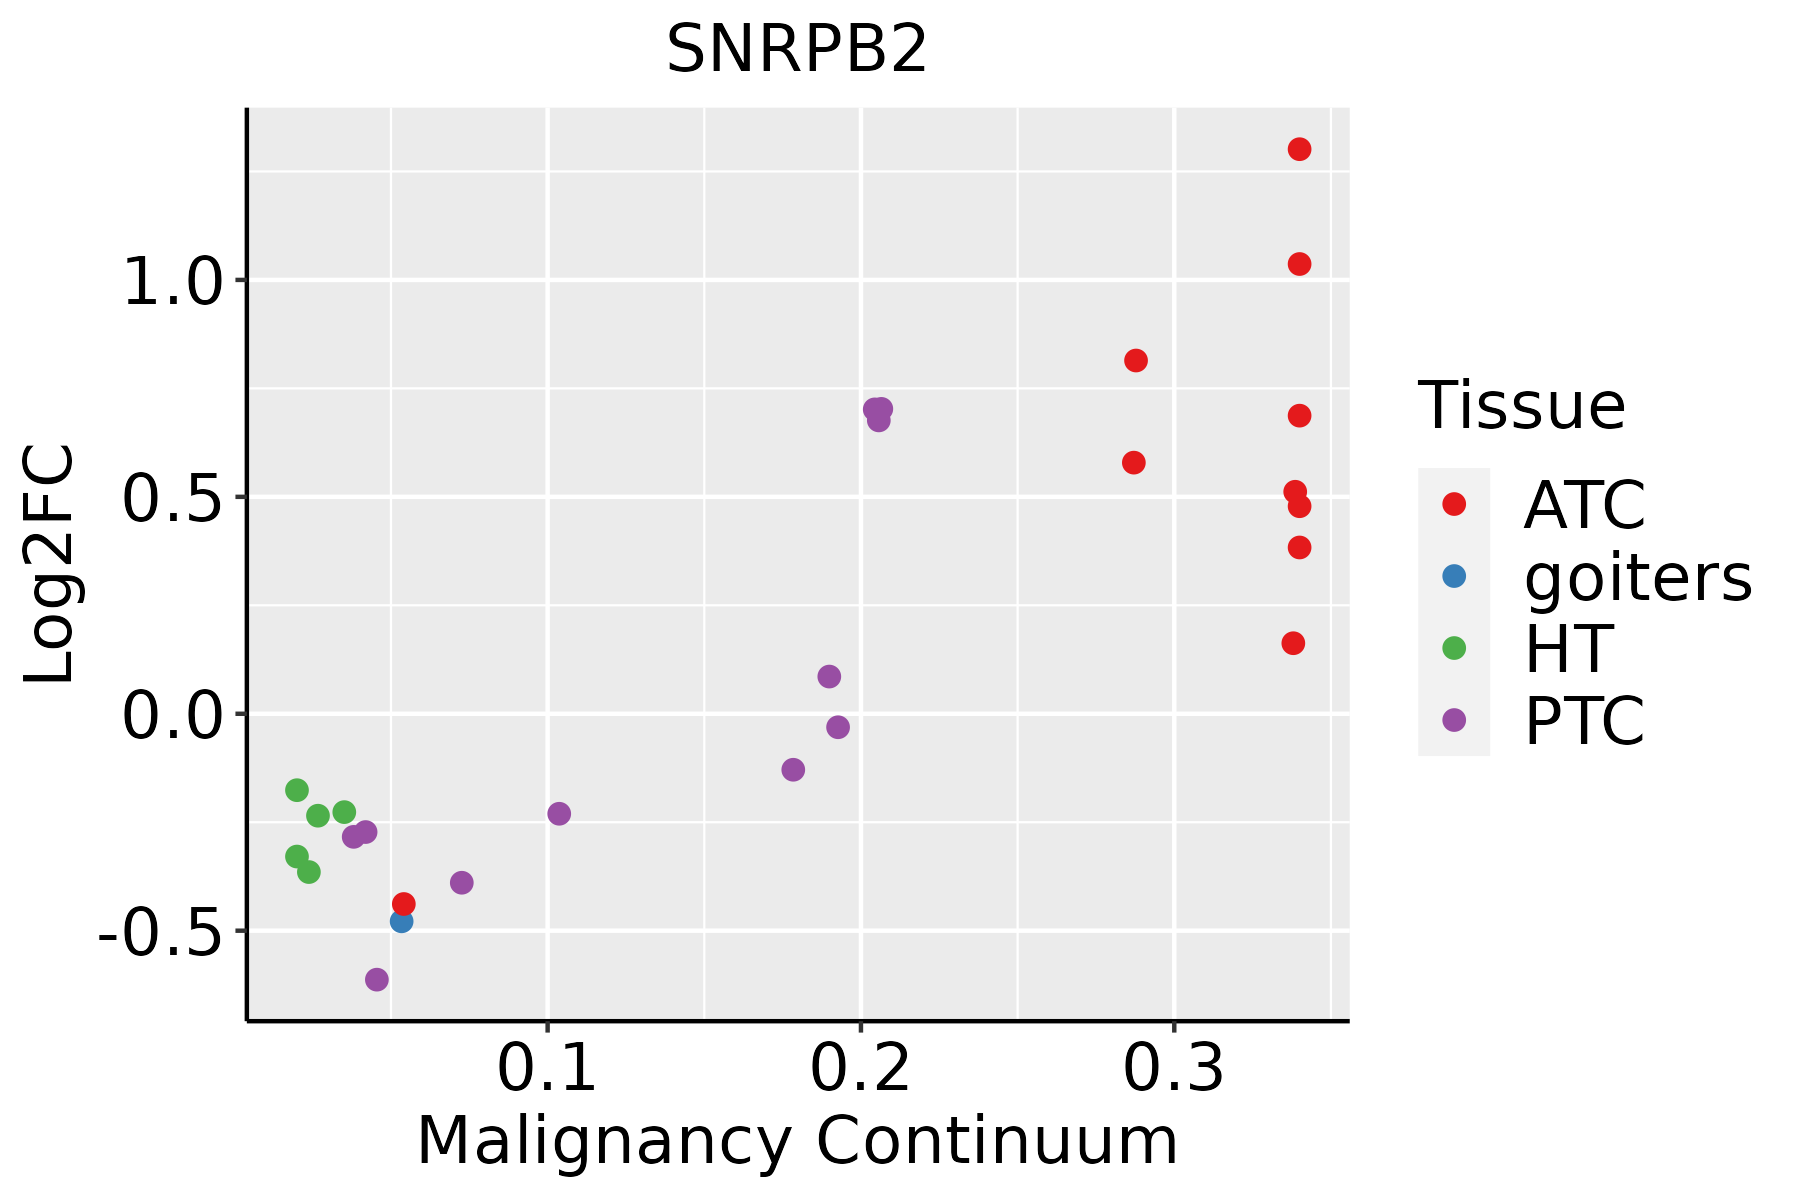 | ATC: Anaplastic thyroid cancer |
| HT: Hashimoto's thyroiditis | ||
| PTC: Papillary thyroid cancer |
| ∗log2FC in expression of this searched gene in stem-like cells from each diseased tissue sample relative to stem-like cells in normal samples in each tissue plotted against the malignancy continuum. Samples are colored based on if they are from different disease stage. |
Top |
Malignant transformation related pathway analysis |
| Find out the enriched GO biological processes and KEGG pathways involved in transition from healthy to precancer to cancer |
| Tissue | Disease Stage | Enriched GO biological Processes |
| Colorectum | AD |  |
| Colorectum | SER |  |
| Colorectum | MSS |  |
| Colorectum | MSI-H |  |
| Colorectum | FAP |  |
| ∗Top 15 enriched GO BP terms are showed in the bar plot of each disease state in each tissue. Each row represents a significant GO biological process which is colored according to the -log10(p.adjust). |
| Page: 1 2 3 4 5 6 7 8 9 |
| GO ID | Tissue | Disease Stage | Description | Gene Ratio | Bg Ratio | pvalue | p.adjust | Count |
| GO:00083809 | Breast | Precancer | RNA splicing | 65/1080 | 434/18723 | 1.27e-12 | 2.53e-10 | 65 |
| GO:00003759 | Breast | Precancer | RNA splicing, via transesterification reactions | 52/1080 | 324/18723 | 1.74e-11 | 2.22e-09 | 52 |
| GO:00003779 | Breast | Precancer | RNA splicing, via transesterification reactions with bulged adenosine as nucleophile | 51/1080 | 320/18723 | 3.55e-11 | 4.04e-09 | 51 |
| GO:00003989 | Breast | Precancer | mRNA splicing, via spliceosome | 51/1080 | 320/18723 | 3.55e-11 | 4.04e-09 | 51 |
| GO:000838014 | Breast | IDC | RNA splicing | 73/1434 | 434/18723 | 1.27e-10 | 1.57e-08 | 73 |
| GO:000037514 | Breast | IDC | RNA splicing, via transesterification reactions | 58/1434 | 324/18723 | 9.44e-10 | 9.58e-08 | 58 |
| GO:000037714 | Breast | IDC | RNA splicing, via transesterification reactions with bulged adenosine as nucleophile | 57/1434 | 320/18723 | 1.60e-09 | 1.49e-07 | 57 |
| GO:000039814 | Breast | IDC | mRNA splicing, via spliceosome | 57/1434 | 320/18723 | 1.60e-09 | 1.49e-07 | 57 |
| GO:000838024 | Breast | DCIS | RNA splicing | 73/1390 | 434/18723 | 3.05e-11 | 5.08e-09 | 73 |
| GO:000037524 | Breast | DCIS | RNA splicing, via transesterification reactions | 58/1390 | 324/18723 | 2.89e-10 | 3.34e-08 | 58 |
| GO:000037724 | Breast | DCIS | RNA splicing, via transesterification reactions with bulged adenosine as nucleophile | 57/1390 | 320/18723 | 5.01e-10 | 5.35e-08 | 57 |
| GO:000039824 | Breast | DCIS | mRNA splicing, via spliceosome | 57/1390 | 320/18723 | 5.01e-10 | 5.35e-08 | 57 |
| GO:0008380 | Colorectum | AD | RNA splicing | 169/3918 | 434/18723 | 3.59e-18 | 2.04e-15 | 169 |
| GO:0000377 | Colorectum | AD | RNA splicing, via transesterification reactions with bulged adenosine as nucleophile | 130/3918 | 320/18723 | 5.88e-16 | 2.16e-13 | 130 |
| GO:0000398 | Colorectum | AD | mRNA splicing, via spliceosome | 130/3918 | 320/18723 | 5.88e-16 | 2.16e-13 | 130 |
| GO:0000375 | Colorectum | AD | RNA splicing, via transesterification reactions | 131/3918 | 324/18723 | 7.11e-16 | 2.22e-13 | 131 |
| GO:00083801 | Colorectum | SER | RNA splicing | 123/2897 | 434/18723 | 3.84e-12 | 8.41e-10 | 123 |
| GO:00003751 | Colorectum | SER | RNA splicing, via transesterification reactions | 90/2897 | 324/18723 | 8.68e-09 | 7.50e-07 | 90 |
| GO:00003771 | Colorectum | SER | RNA splicing, via transesterification reactions with bulged adenosine as nucleophile | 89/2897 | 320/18723 | 9.82e-09 | 8.14e-07 | 89 |
| GO:00003981 | Colorectum | SER | mRNA splicing, via spliceosome | 89/2897 | 320/18723 | 9.82e-09 | 8.14e-07 | 89 |
| Page: 1 2 3 4 5 |
| Pathway ID | Tissue | Disease Stage | Description | Gene Ratio | Bg Ratio | pvalue | p.adjust | qvalue | Count |
| hsa030408 | Breast | Precancer | Spliceosome | 39/684 | 217/8465 | 1.44e-06 | 2.27e-05 | 1.74e-05 | 39 |
| hsa0304013 | Breast | Precancer | Spliceosome | 39/684 | 217/8465 | 1.44e-06 | 2.27e-05 | 1.74e-05 | 39 |
| hsa0304023 | Breast | IDC | Spliceosome | 40/867 | 217/8465 | 1.53e-04 | 1.42e-03 | 1.06e-03 | 40 |
| hsa0304033 | Breast | IDC | Spliceosome | 40/867 | 217/8465 | 1.53e-04 | 1.42e-03 | 1.06e-03 | 40 |
| hsa0304043 | Breast | DCIS | Spliceosome | 40/846 | 217/8465 | 8.97e-05 | 8.52e-04 | 6.28e-04 | 40 |
| hsa0304053 | Breast | DCIS | Spliceosome | 40/846 | 217/8465 | 8.97e-05 | 8.52e-04 | 6.28e-04 | 40 |
| hsa03040 | Colorectum | AD | Spliceosome | 73/2092 | 217/8465 | 1.73e-03 | 9.68e-03 | 6.18e-03 | 73 |
| hsa030401 | Colorectum | AD | Spliceosome | 73/2092 | 217/8465 | 1.73e-03 | 9.68e-03 | 6.18e-03 | 73 |
| hsa030402 | Colorectum | MSS | Spliceosome | 66/1875 | 217/8465 | 2.58e-03 | 1.27e-02 | 7.81e-03 | 66 |
| hsa030403 | Colorectum | MSS | Spliceosome | 66/1875 | 217/8465 | 2.58e-03 | 1.27e-02 | 7.81e-03 | 66 |
| hsa030409 | Endometrium | AEH | Spliceosome | 54/1197 | 217/8465 | 1.47e-05 | 1.65e-04 | 1.21e-04 | 54 |
| hsa0304014 | Endometrium | AEH | Spliceosome | 54/1197 | 217/8465 | 1.47e-05 | 1.65e-04 | 1.21e-04 | 54 |
| hsa0304024 | Endometrium | EEC | Spliceosome | 54/1237 | 217/8465 | 3.78e-05 | 3.88e-04 | 2.89e-04 | 54 |
| hsa0304034 | Endometrium | EEC | Spliceosome | 54/1237 | 217/8465 | 3.78e-05 | 3.88e-04 | 2.89e-04 | 54 |
| hsa0304018 | Esophagus | HGIN | Spliceosome | 79/1383 | 217/8465 | 3.22e-13 | 7.00e-12 | 5.56e-12 | 79 |
| hsa0304019 | Esophagus | HGIN | Spliceosome | 79/1383 | 217/8465 | 3.22e-13 | 7.00e-12 | 5.56e-12 | 79 |
| hsa0304027 | Esophagus | ESCC | Spliceosome | 128/4205 | 217/8465 | 3.31e-03 | 8.79e-03 | 4.50e-03 | 128 |
| hsa0304037 | Esophagus | ESCC | Spliceosome | 128/4205 | 217/8465 | 3.31e-03 | 8.79e-03 | 4.50e-03 | 128 |
| hsa030407 | Liver | Cirrhotic | Spliceosome | 102/2530 | 217/8465 | 5.69e-08 | 9.47e-07 | 5.84e-07 | 102 |
| hsa0304012 | Liver | Cirrhotic | Spliceosome | 102/2530 | 217/8465 | 5.69e-08 | 9.47e-07 | 5.84e-07 | 102 |
| Page: 1 2 |
Top |
Cell-cell communication analysis |
| Identification of potential cell-cell interactions between two cell types and their ligand-receptor pairs for different disease states |
| Ligand | Receptor | LRpair | Pathway | Tissue | Disease Stage |
| Page: 1 |
Top |
Single-cell gene regulatory network inference analysis |
| Find out the significant the regulons (TFs) and the target genes of each regulon across cell types for different disease states |
| TF | Cell Type | Tissue | Disease Stage | Target Gene | RSS | Regulon Activity |
| ∗The dot plots of a searched regulon are shown for all cell subpopulations in each disease state of each tissue based on the regulon specific score inferred using pySCENIC and by calculating the average expression. |
| Page: 1 |
Top |
Somatic mutation of malignant transformation related genes |
| Annotation of somatic variants for genes involved in malignant transformation |
| Hugo Symbol | Variant Class | Variant Classification | dbSNP RS | HGVSc | HGVSp | HGVSp Short | SWISSPROT | BIOTYPE | SIFT | PolyPhen | Tumor Sample Barcode | Tissue | Histology | Sex | Age | Stage | Therapy Types | Drugs | Outcome |
| SNRPB2 | SNV | Missense_Mutation | c.25A>T | p.Ile9Phe | p.I9F | P08579 | protein_coding | deleterious(0) | possibly_damaging(0.544) | TCGA-CK-5913-01 | Colorectum | colon adenocarcinoma | Female | <65 | I/II | Unknown | Unknown | SD | |
| SNRPB2 | SNV | Missense_Mutation | c.377N>T | p.Gln126Leu | p.Q126L | P08579 | protein_coding | tolerated(0.31) | benign(0) | TCGA-D5-6540-01 | Colorectum | colon adenocarcinoma | Male | >=65 | I/II | Unknown | Unknown | SD | |
| SNRPB2 | SNV | Missense_Mutation | novel | c.46G>T | p.Asp16Tyr | p.D16Y | P08579 | protein_coding | deleterious(0) | possibly_damaging(0.702) | TCGA-EI-6917-01 | Colorectum | rectum adenocarcinoma | Male | <65 | III/IV | Chemotherapy | 5fluorouracil+oxaciplatina+l-folinian | SD |
| SNRPB2 | SNV | Missense_Mutation | novel | c.79N>A | p.Leu27Ile | p.L27I | P08579 | protein_coding | deleterious(0.03) | probably_damaging(1) | TCGA-A5-A1OF-01 | Endometrium | uterine corpus endometrioid carcinoma | Female | <65 | I/II | Unknown | Unknown | SD |
| SNRPB2 | SNV | Missense_Mutation | novel | c.498N>T | p.Met166Ile | p.M166I | P08579 | protein_coding | deleterious(0.01) | probably_damaging(0.944) | TCGA-AJ-A3IA-01 | Endometrium | uterine corpus endometrioid carcinoma | Female | >=65 | I/II | Unknown | Unknown | SD |
| SNRPB2 | SNV | Missense_Mutation | rs760943329 | c.182N>T | p.Ser61Leu | p.S61L | P08579 | protein_coding | deleterious(0) | probably_damaging(0.996) | TCGA-AX-A05Z-01 | Endometrium | uterine corpus endometrioid carcinoma | Female | <65 | III/IV | Chemotherapy | adriamycin | SD |
| SNRPB2 | SNV | Missense_Mutation | novel | c.471N>A | p.Asn157Lys | p.N157K | P08579 | protein_coding | deleterious(0.02) | possibly_damaging(0.734) | TCGA-AX-A05Z-01 | Endometrium | uterine corpus endometrioid carcinoma | Female | <65 | III/IV | Chemotherapy | adriamycin | SD |
| SNRPB2 | SNV | Missense_Mutation | c.227G>A | p.Gly76Asp | p.G76D | P08579 | protein_coding | tolerated(1) | benign(0.006) | TCGA-BS-A0TC-01 | Endometrium | uterine corpus endometrioid carcinoma | Female | >=65 | I/II | Unknown | Unknown | SD | |
| SNRPB2 | SNV | Missense_Mutation | novel | c.262N>C | p.Ser88Pro | p.S88P | P08579 | protein_coding | deleterious(0) | probably_damaging(0.99) | TCGA-D1-A17Q-01 | Endometrium | uterine corpus endometrioid carcinoma | Female | <65 | I/II | Unknown | Unknown | SD |
| SNRPB2 | SNV | Missense_Mutation | novel | c.217C>T | p.Pro73Ser | p.P73S | P08579 | protein_coding | deleterious(0.02) | probably_damaging(0.999) | TCGA-E6-A1LX-01 | Endometrium | uterine corpus endometrioid carcinoma | Female | <65 | I/II | Unknown | Unknown | SD |
| Page: 1 2 |
Top |
Related drugs of malignant transformation related genes |
| Identification of chemicals and drugs interact with genes involved in malignant transfromation |
| (DGIdb 4.0) |
| Entrez ID | Symbol | Category | Interaction Types | Drug Claim Name | Drug Name | PMIDs |
| Page: 1 |

Copyright 2023-Present -The University of Texas Health Science Center at Houston |