
|
|||||
|
 | |
| |
| |
| |
| |
| |
|
Gene: SNRNP25 |
Gene summary for SNRNP25 |
| Gene information | Species | Human | Gene symbol | SNRNP25 | Gene ID | 79622 |
| Gene name | small nuclear ribonucleoprotein U11/U12 subunit 25 | |
| Gene Alias | C16orf33 | |
| Cytomap | 16p13.3 | |
| Gene Type | protein-coding | GO ID | GO:0000375 | UniProtAcc | Q9BV90 |
Top |
Malignant transformation analysis |
| Identification of the aberrant gene expression in precancerous and cancerous lesions by comparing the gene expression of stem-like cells in diseased tissues with normal stem cells |
| Entrez ID | Symbol | Replicates | Species | Organ | Tissue | Adj P-value | Log2FC | Malignancy |
| 79622 | SNRNP25 | GSM4909281 | Human | Breast | IDC | 4.11e-03 | 2.23e-01 | 0.21 |
| 79622 | SNRNP25 | GSM4909282 | Human | Breast | IDC | 2.79e-02 | 2.86e-01 | -0.0288 |
| 79622 | SNRNP25 | GSM4909290 | Human | Breast | IDC | 8.40e-08 | 3.37e-01 | 0.2096 |
| 79622 | SNRNP25 | GSM4909291 | Human | Breast | IDC | 1.44e-20 | 6.90e-01 | 0.1753 |
| 79622 | SNRNP25 | GSM4909293 | Human | Breast | IDC | 2.90e-02 | 1.89e-01 | 0.1581 |
| 79622 | SNRNP25 | GSM4909301 | Human | Breast | IDC | 1.95e-07 | 3.51e-01 | 0.1577 |
| 79622 | SNRNP25 | GSM4909304 | Human | Breast | IDC | 1.02e-05 | 3.02e-01 | 0.1636 |
| 79622 | SNRNP25 | GSM4909305 | Human | Breast | IDC | 3.20e-03 | 2.70e-01 | 0.0436 |
| 79622 | SNRNP25 | GSM4909306 | Human | Breast | IDC | 1.84e-36 | 7.69e-01 | 0.1564 |
| 79622 | SNRNP25 | GSM4909307 | Human | Breast | IDC | 1.59e-14 | 4.91e-01 | 0.1569 |
| 79622 | SNRNP25 | GSM4909308 | Human | Breast | IDC | 1.55e-38 | 6.78e-01 | 0.158 |
| 79622 | SNRNP25 | GSM4909319 | Human | Breast | IDC | 1.47e-07 | 1.45e-01 | 0.1563 |
| 79622 | SNRNP25 | M2 | Human | Breast | IDC | 2.27e-02 | 4.37e-01 | 0.21 |
| 79622 | SNRNP25 | DCIS2 | Human | Breast | DCIS | 1.49e-21 | -7.75e-05 | 0.0085 |
| 79622 | SNRNP25 | LZE2T | Human | Esophagus | ESCC | 9.19e-06 | 8.02e-01 | 0.082 |
| 79622 | SNRNP25 | LZE4T | Human | Esophagus | ESCC | 2.49e-07 | 2.07e-01 | 0.0811 |
| 79622 | SNRNP25 | LZE7T | Human | Esophagus | ESCC | 4.90e-08 | 6.32e-01 | 0.0667 |
| 79622 | SNRNP25 | LZE22D1 | Human | Esophagus | HGIN | 2.68e-02 | 1.65e-01 | 0.0595 |
| 79622 | SNRNP25 | LZE24T | Human | Esophagus | ESCC | 3.32e-12 | 4.91e-01 | 0.0596 |
| 79622 | SNRNP25 | LZE6T | Human | Esophagus | ESCC | 4.77e-07 | 4.10e-01 | 0.0845 |
| Page: 1 2 3 4 5 6 7 |
| Tissue | Expression Dynamics | Abbreviation |
| Breast | 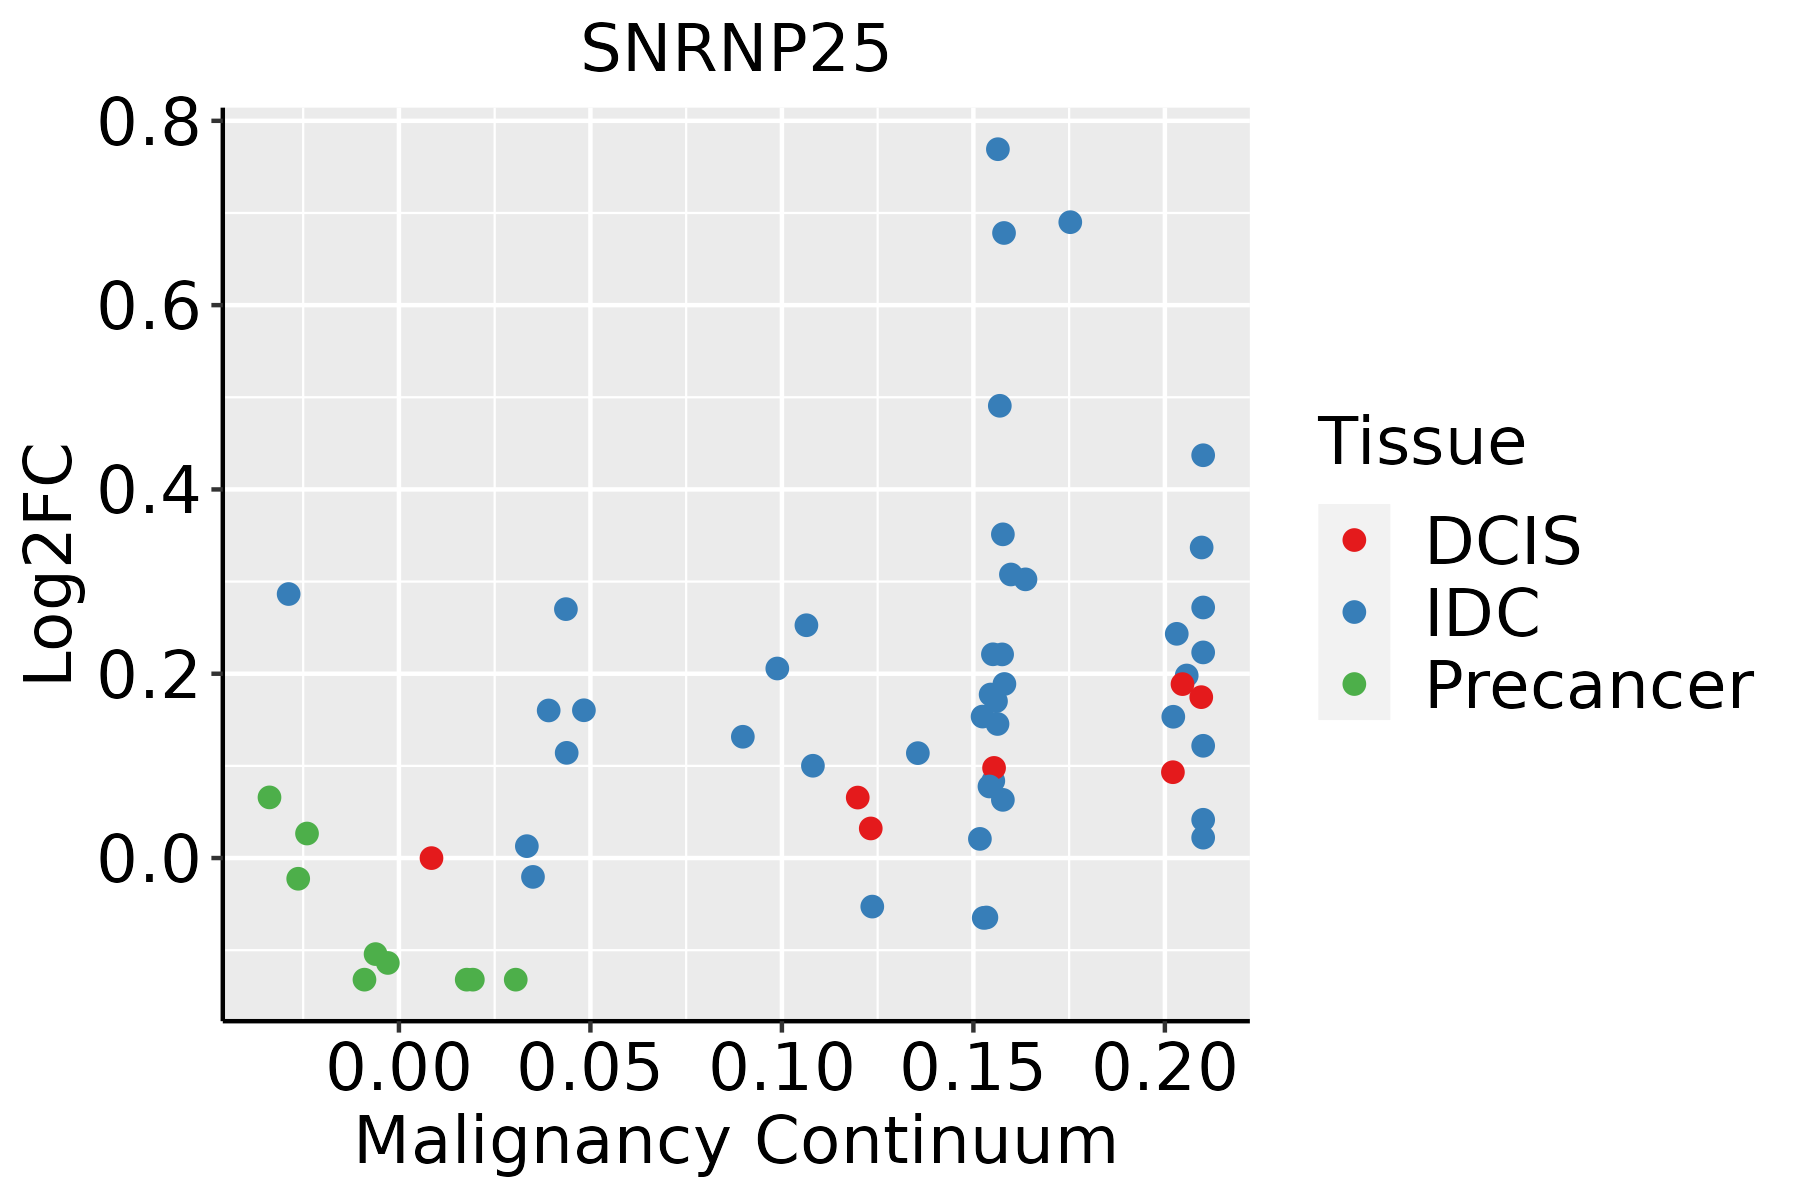 | IDC: Invasive ductal carcinoma |
| DCIS: Ductal carcinoma in situ | ||
| Precancer(BRCA1-mut): Precancerous lesion from BRCA1 mutation carriers | ||
| Esophagus | 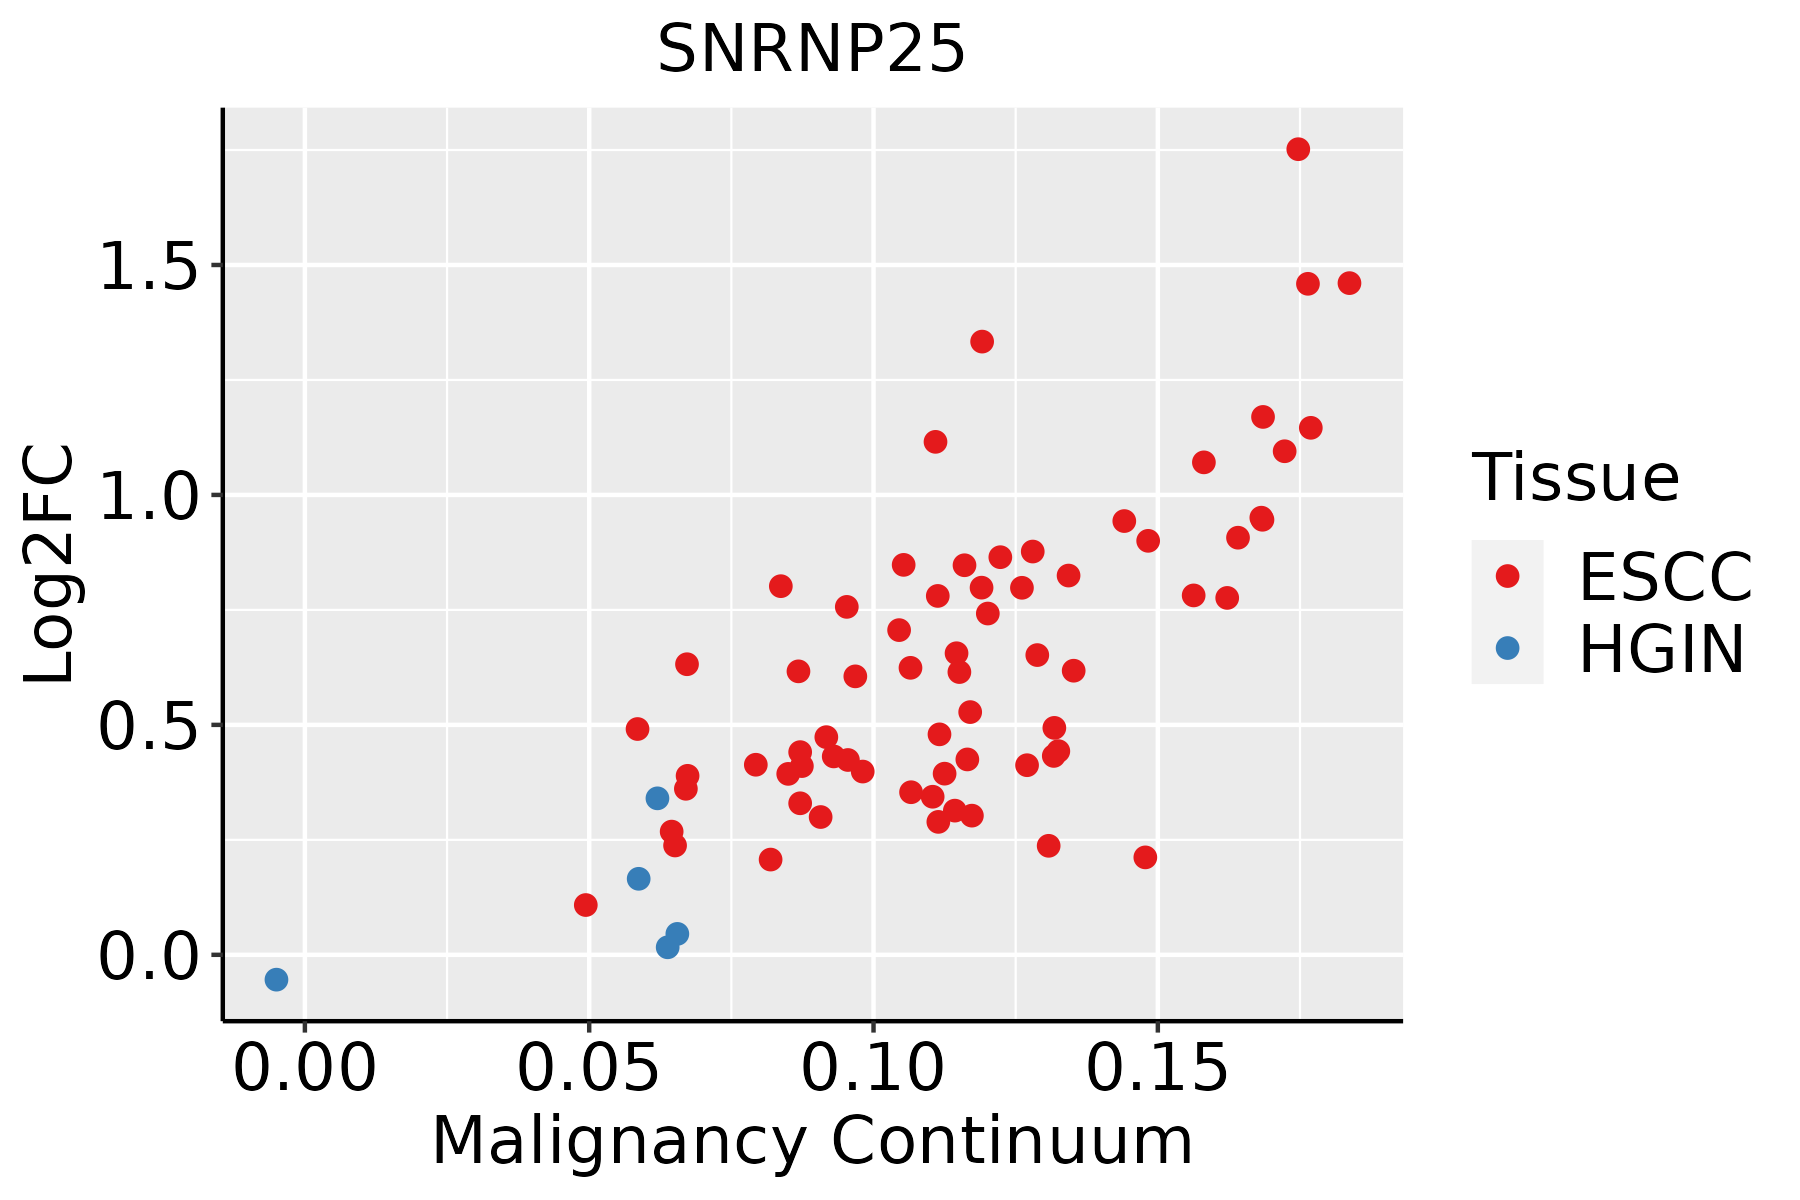 | ESCC: Esophageal squamous cell carcinoma |
| HGIN: High-grade intraepithelial neoplasias | ||
| LGIN: Low-grade intraepithelial neoplasias | ||
| Liver | 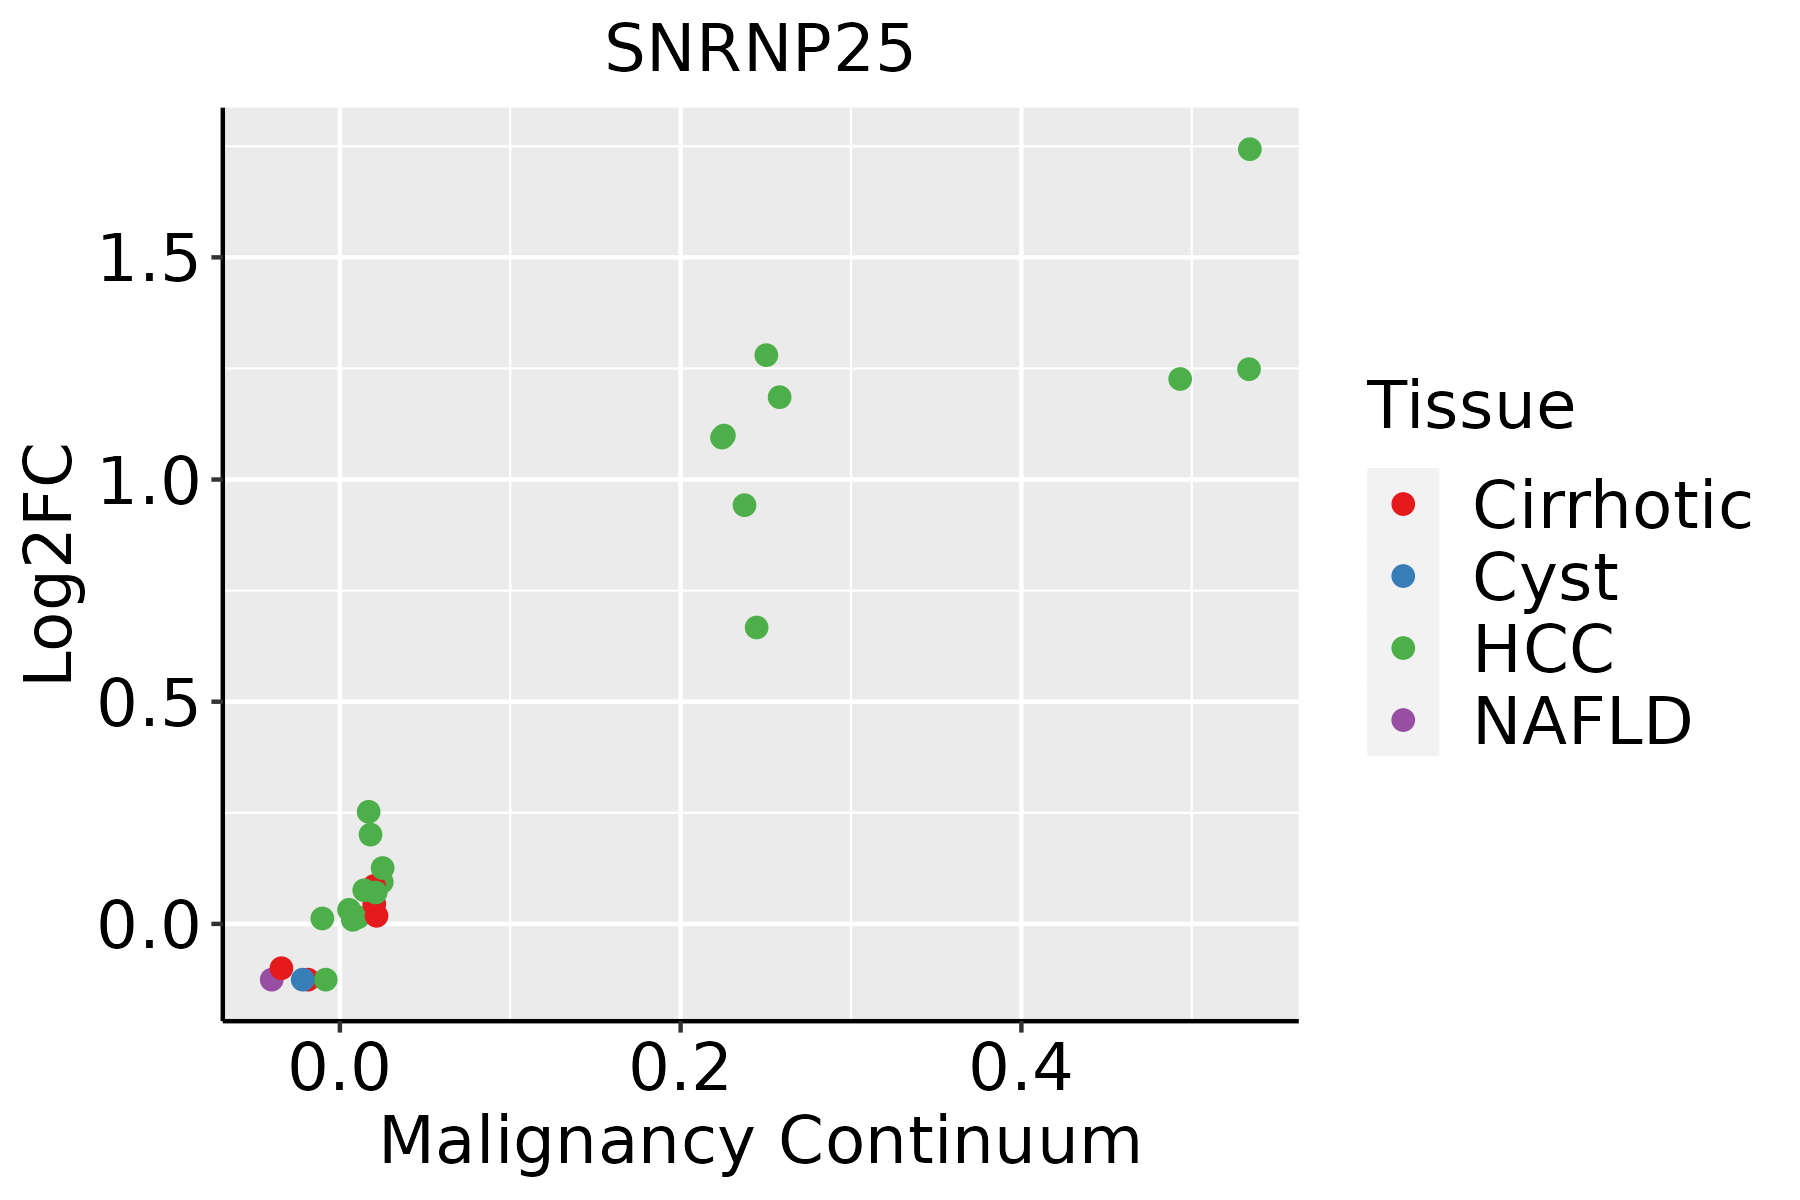 | HCC: Hepatocellular carcinoma |
| NAFLD: Non-alcoholic fatty liver disease | ||
| Oral Cavity | 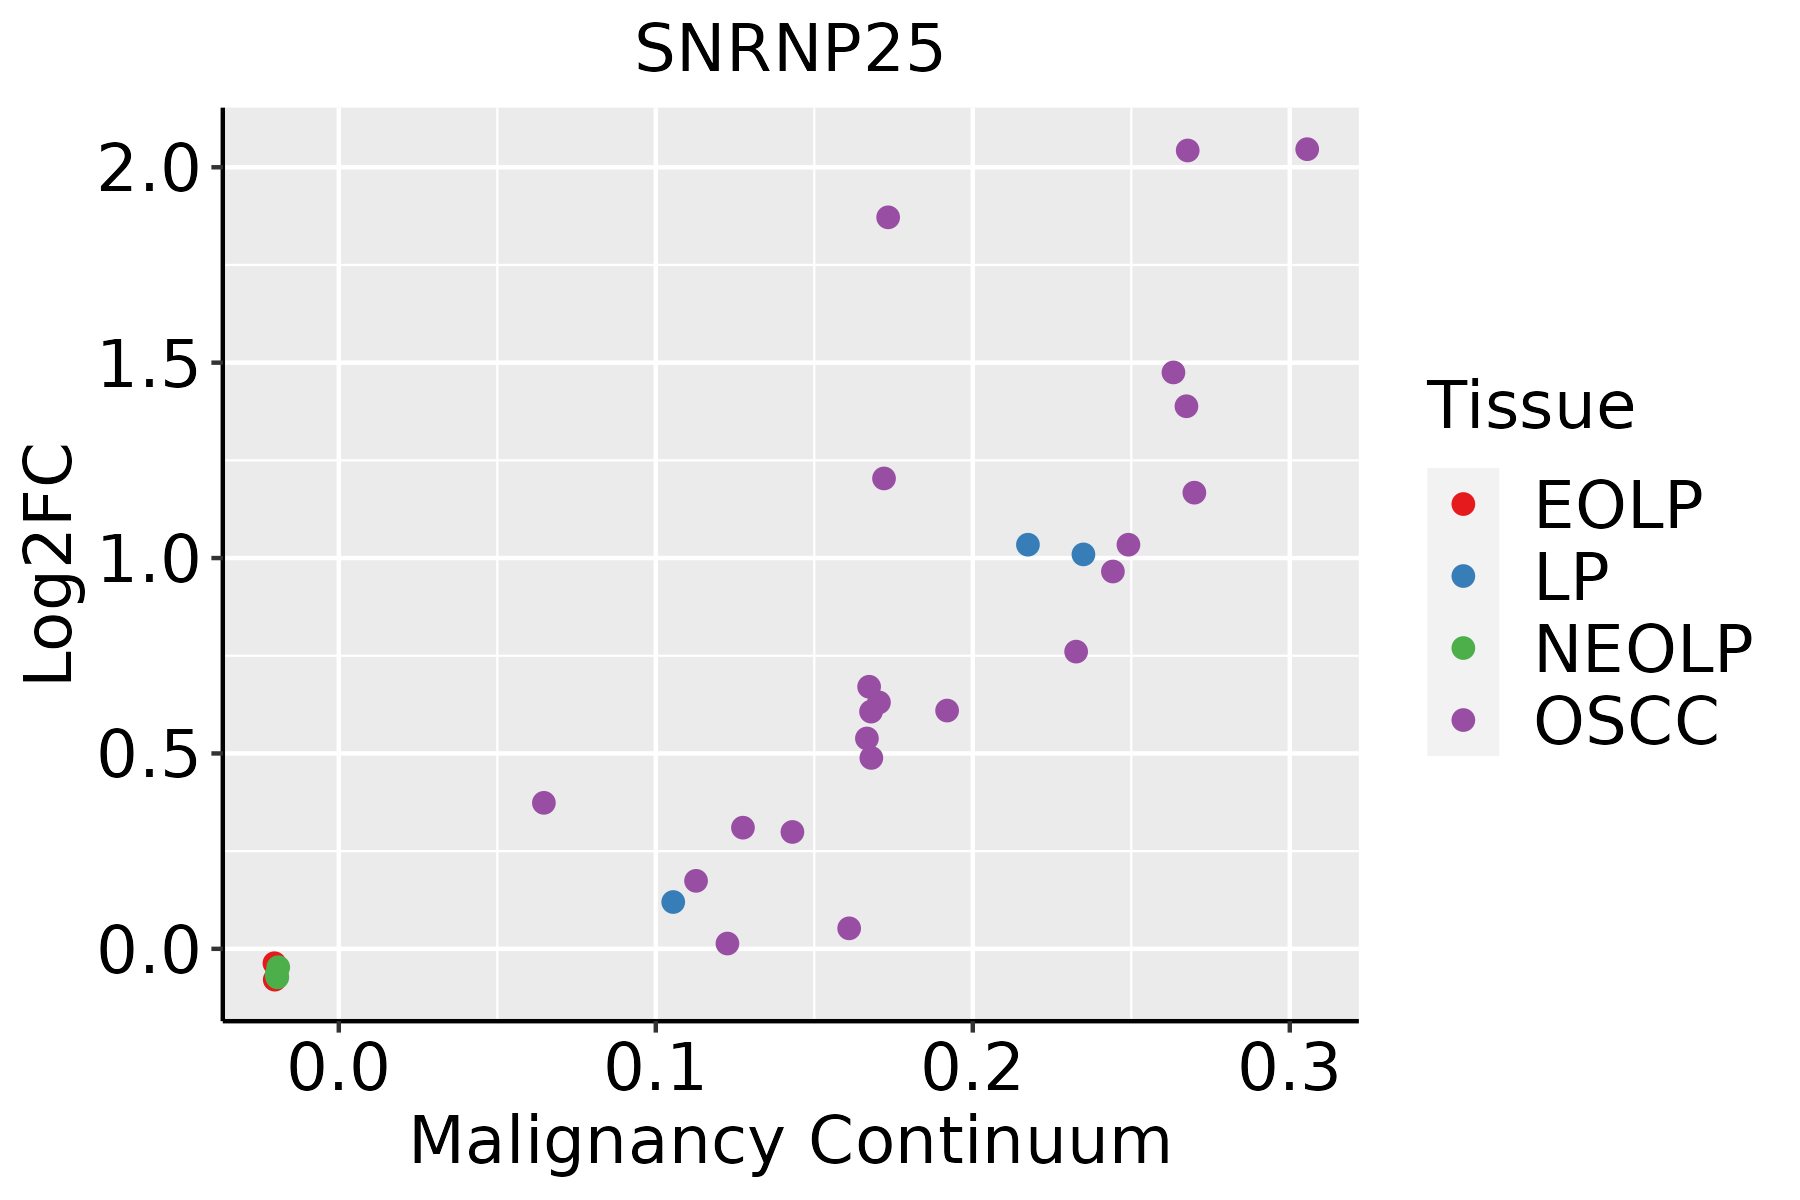 | EOLP: Erosive Oral lichen planus |
| LP: leukoplakia | ||
| NEOLP: Non-erosive oral lichen planus | ||
| OSCC: Oral squamous cell carcinoma | ||
| Skin | 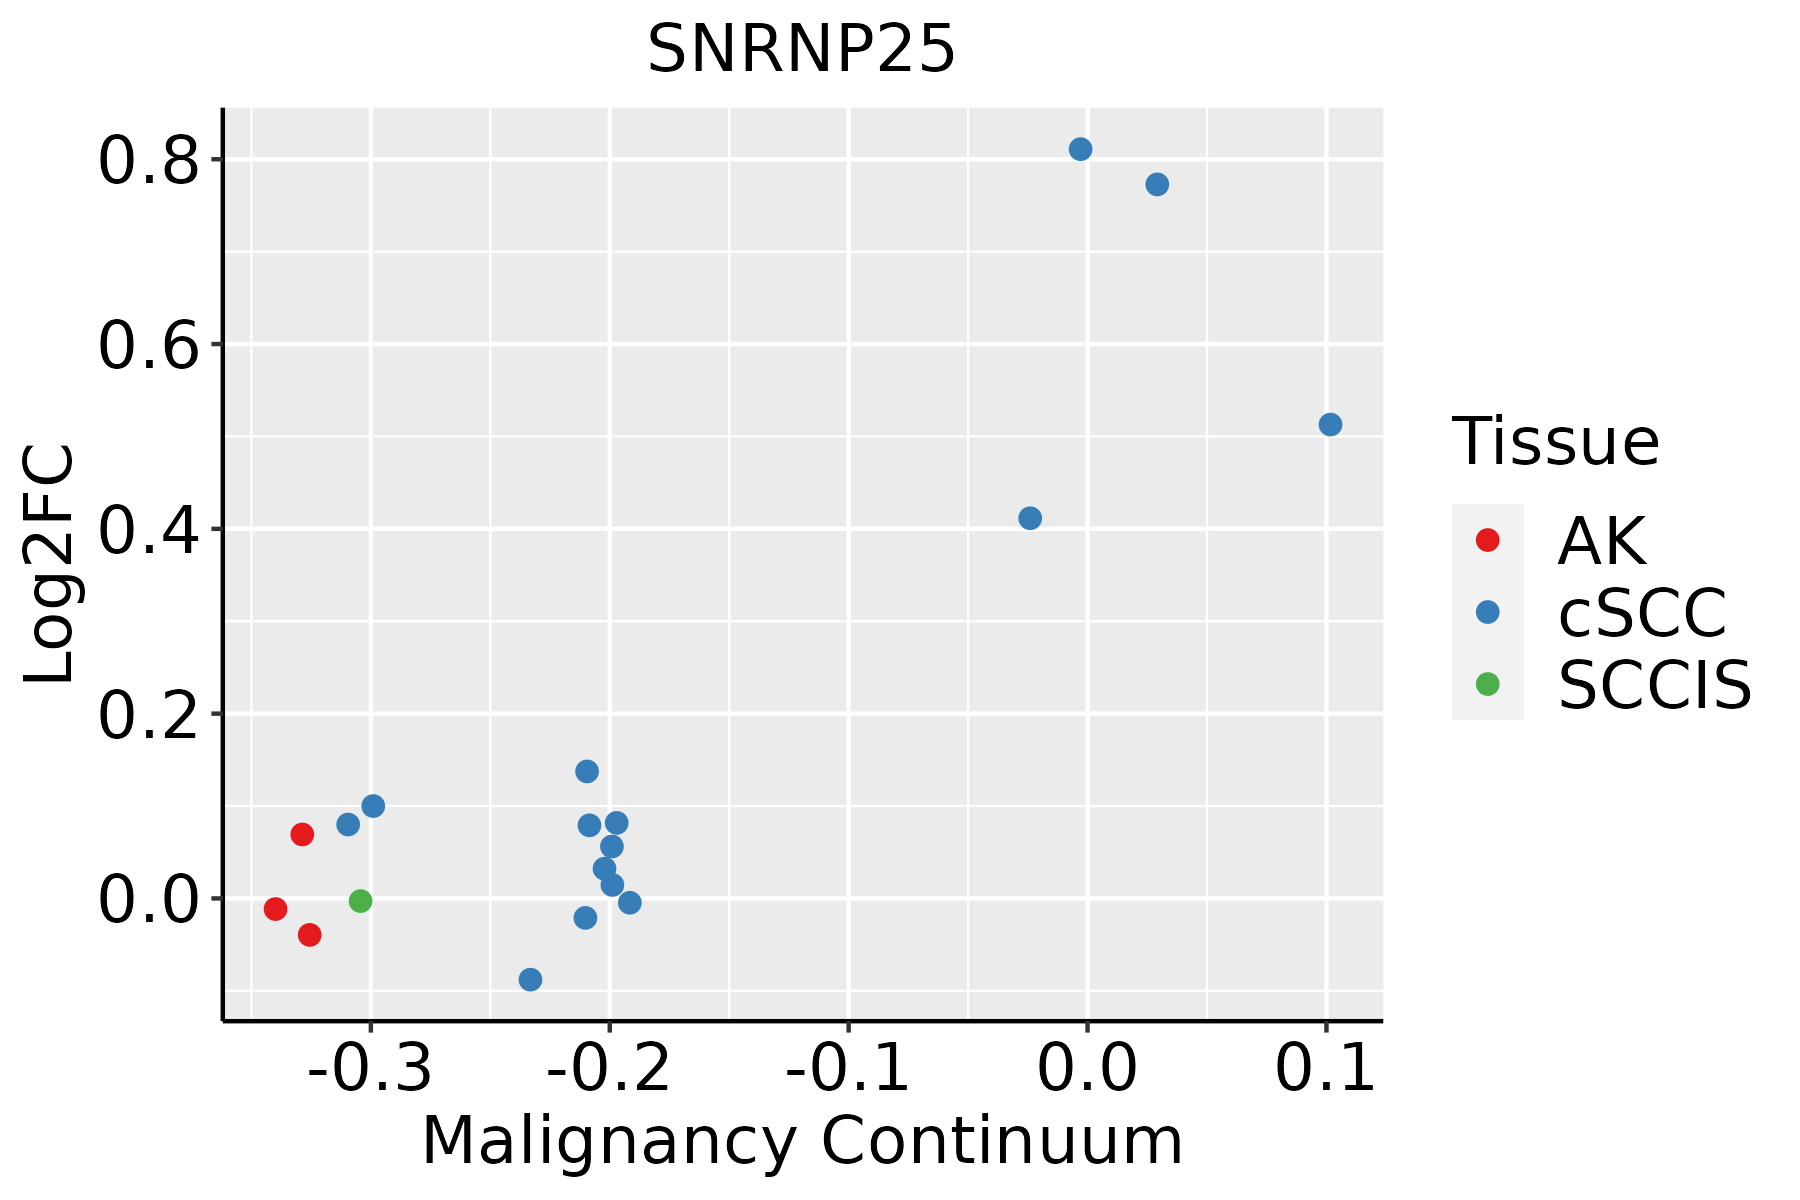 | AK: Actinic keratosis |
| cSCC: Cutaneous squamous cell carcinoma | ||
| SCCIS:squamous cell carcinoma in situ | ||
| Thyroid | 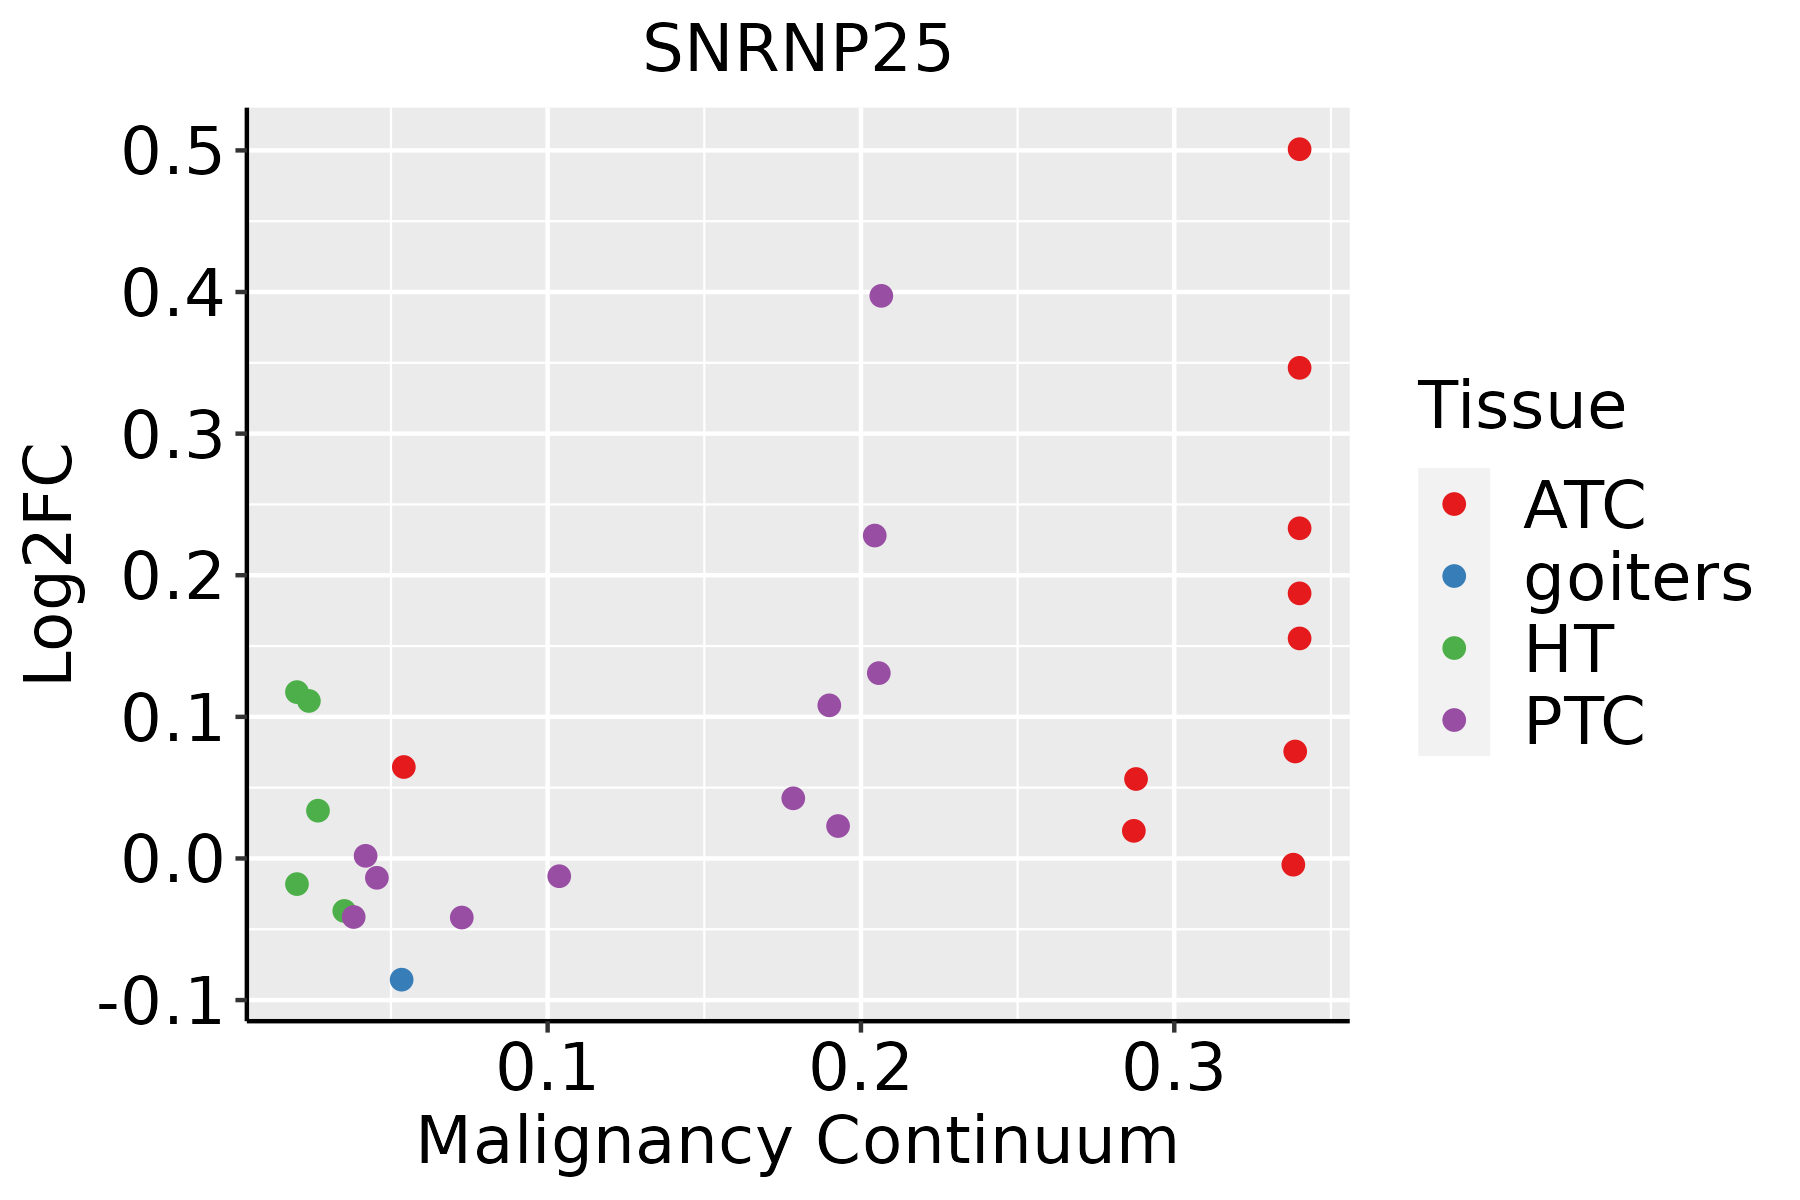 | ATC: Anaplastic thyroid cancer |
| HT: Hashimoto's thyroiditis | ||
| PTC: Papillary thyroid cancer |
| ∗log2FC in expression of this searched gene in stem-like cells from each diseased tissue sample relative to stem-like cells in normal samples in each tissue plotted against the malignancy continuum. Samples are colored based on if they are from different disease stage. |
Top |
Malignant transformation related pathway analysis |
| Find out the enriched GO biological processes and KEGG pathways involved in transition from healthy to precancer to cancer |
| Tissue | Disease Stage | Enriched GO biological Processes |
| Colorectum | AD |  |
| Colorectum | SER |  |
| Colorectum | MSS |  |
| Colorectum | MSI-H |  |
| Colorectum | FAP |  |
| ∗Top 15 enriched GO BP terms are showed in the bar plot of each disease state in each tissue. Each row represents a significant GO biological process which is colored according to the -log10(p.adjust). |
| Page: 1 2 3 4 5 6 7 8 9 |
| GO ID | Tissue | Disease Stage | Description | Gene Ratio | Bg Ratio | pvalue | p.adjust | Count |
| GO:000838014 | Breast | IDC | RNA splicing | 73/1434 | 434/18723 | 1.27e-10 | 1.57e-08 | 73 |
| GO:000037514 | Breast | IDC | RNA splicing, via transesterification reactions | 58/1434 | 324/18723 | 9.44e-10 | 9.58e-08 | 58 |
| GO:000037714 | Breast | IDC | RNA splicing, via transesterification reactions with bulged adenosine as nucleophile | 57/1434 | 320/18723 | 1.60e-09 | 1.49e-07 | 57 |
| GO:000039814 | Breast | IDC | mRNA splicing, via spliceosome | 57/1434 | 320/18723 | 1.60e-09 | 1.49e-07 | 57 |
| GO:000838024 | Breast | DCIS | RNA splicing | 73/1390 | 434/18723 | 3.05e-11 | 5.08e-09 | 73 |
| GO:000037524 | Breast | DCIS | RNA splicing, via transesterification reactions | 58/1390 | 324/18723 | 2.89e-10 | 3.34e-08 | 58 |
| GO:000037724 | Breast | DCIS | RNA splicing, via transesterification reactions with bulged adenosine as nucleophile | 57/1390 | 320/18723 | 5.01e-10 | 5.35e-08 | 57 |
| GO:000039824 | Breast | DCIS | mRNA splicing, via spliceosome | 57/1390 | 320/18723 | 5.01e-10 | 5.35e-08 | 57 |
| GO:000838026 | Esophagus | HGIN | RNA splicing | 160/2587 | 434/18723 | 3.74e-34 | 1.12e-30 | 160 |
| GO:000037520 | Esophagus | HGIN | RNA splicing, via transesterification reactions | 115/2587 | 324/18723 | 3.16e-23 | 3.80e-20 | 115 |
| GO:000037720 | Esophagus | HGIN | RNA splicing, via transesterification reactions with bulged adenosine as nucleophile | 113/2587 | 320/18723 | 1.24e-22 | 9.26e-20 | 113 |
| GO:000039820 | Esophagus | HGIN | mRNA splicing, via spliceosome | 113/2587 | 320/18723 | 1.24e-22 | 9.26e-20 | 113 |
| GO:0008380111 | Esophagus | ESCC | RNA splicing | 336/8552 | 434/18723 | 1.74e-42 | 3.67e-39 | 336 |
| GO:0000375111 | Esophagus | ESCC | RNA splicing, via transesterification reactions | 248/8552 | 324/18723 | 3.05e-30 | 1.49e-27 | 248 |
| GO:0000377111 | Esophagus | ESCC | RNA splicing, via transesterification reactions with bulged adenosine as nucleophile | 244/8552 | 320/18723 | 2.52e-29 | 1.07e-26 | 244 |
| GO:0000398111 | Esophagus | ESCC | mRNA splicing, via spliceosome | 244/8552 | 320/18723 | 2.52e-29 | 1.07e-26 | 244 |
| GO:000838012 | Liver | Cirrhotic | RNA splicing | 229/4634 | 434/18723 | 9.13e-37 | 2.86e-33 | 229 |
| GO:000037512 | Liver | Cirrhotic | RNA splicing, via transesterification reactions | 175/4634 | 324/18723 | 5.95e-30 | 7.47e-27 | 175 |
| GO:000037712 | Liver | Cirrhotic | RNA splicing, via transesterification reactions with bulged adenosine as nucleophile | 172/4634 | 320/18723 | 4.02e-29 | 3.60e-26 | 172 |
| GO:000039812 | Liver | Cirrhotic | mRNA splicing, via spliceosome | 172/4634 | 320/18723 | 4.02e-29 | 3.60e-26 | 172 |
| Page: 1 2 3 |
| Pathway ID | Tissue | Disease Stage | Description | Gene Ratio | Bg Ratio | pvalue | p.adjust | qvalue | Count |
| Page: 1 |
Top |
Cell-cell communication analysis |
| Identification of potential cell-cell interactions between two cell types and their ligand-receptor pairs for different disease states |
| Ligand | Receptor | LRpair | Pathway | Tissue | Disease Stage |
| Page: 1 |
Top |
Single-cell gene regulatory network inference analysis |
| Find out the significant the regulons (TFs) and the target genes of each regulon across cell types for different disease states |
| TF | Cell Type | Tissue | Disease Stage | Target Gene | RSS | Regulon Activity |
| ∗The dot plots of a searched regulon are shown for all cell subpopulations in each disease state of each tissue based on the regulon specific score inferred using pySCENIC and by calculating the average expression. |
| Page: 1 |
Top |
Somatic mutation of malignant transformation related genes |
| Annotation of somatic variants for genes involved in malignant transformation |
| Hugo Symbol | Variant Class | Variant Classification | dbSNP RS | HGVSc | HGVSp | HGVSp Short | SWISSPROT | BIOTYPE | SIFT | PolyPhen | Tumor Sample Barcode | Tissue | Histology | Sex | Age | Stage | Therapy Types | Drugs | Outcome |
| SNRNP25 | SNV | Missense_Mutation | novel | c.241G>A | p.Glu81Lys | p.E81K | Q9BV90 | protein_coding | tolerated(0.15) | benign(0.164) | TCGA-MU-A8JM-01 | Cervix | cervical & endocervical cancer | Female | <65 | I/II | Unknown | Unknown | SD |
| SNRNP25 | SNV | Missense_Mutation | rs747117068 | c.112G>A | p.Gly38Ser | p.G38S | Q9BV90 | protein_coding | deleterious(0) | probably_damaging(0.997) | TCGA-AZ-6601-01 | Colorectum | colon adenocarcinoma | Male | >=65 | I/II | Unknown | Unknown | PD |
| SNRNP25 | SNV | Missense_Mutation | c.239G>A | p.Arg80His | p.R80H | Q9BV90 | protein_coding | deleterious(0) | probably_damaging(0.982) | TCGA-CM-4746-01 | Colorectum | colon adenocarcinoma | Male | <65 | I/II | Unknown | Unknown | SD | |
| SNRNP25 | SNV | Missense_Mutation | c.201N>T | p.Lys67Asn | p.K67N | Q9BV90 | protein_coding | deleterious(0) | probably_damaging(0.981) | TCGA-AP-A0LM-01 | Endometrium | uterine corpus endometrioid carcinoma | Female | <65 | III/IV | Chemotherapy | cisplatin | SD | |
| SNRNP25 | SNV | Missense_Mutation | rs770187197 | c.364N>A | p.Glu122Lys | p.E122K | Q9BV90 | protein_coding | tolerated(0.19) | benign(0.308) | TCGA-AX-A2HC-01 | Endometrium | uterine corpus endometrioid carcinoma | Female | <65 | III/IV | Chemotherapy | paclitaxel | PD |
| SNRNP25 | SNV | Missense_Mutation | rs779593421 | c.287N>G | p.Tyr96Cys | p.Y96C | Q9BV90 | protein_coding | deleterious(0) | probably_damaging(0.944) | TCGA-BG-A222-01 | Endometrium | uterine corpus endometrioid carcinoma | Female | <65 | I/II | Unknown | Unknown | SD |
| SNRNP25 | SNV | Missense_Mutation | novel | c.4N>A | p.Asp2Asn | p.D2N | Q9BV90 | protein_coding | tolerated(0.13) | benign(0.007) | TCGA-EO-A3KX-01 | Endometrium | uterine corpus endometrioid carcinoma | Female | >=65 | I/II | Unknown | Unknown | SD |
| SNRNP25 | SNV | Missense_Mutation | novel | c.141N>C | p.Lys47Asn | p.K47N | Q9BV90 | protein_coding | deleterious(0) | possibly_damaging(0.787) | TCGA-33-A5GW-01 | Lung | lung squamous cell carcinoma | Male | >=65 | I/II | Unknown | Unknown | SD |
| SNRNP25 | SNV | Missense_Mutation | rs761819954 | c.56N>G | p.Asp19Gly | p.D19G | Q9BV90 | protein_coding | tolerated(0.23) | benign(0.245) | TCGA-CR-7377-01 | Oral cavity | head & neck squamous cell carcinoma | Male | <65 | I/II | Unknown | Unknown | SD |
| SNRNP25 | SNV | Missense_Mutation | rs762979091 | c.373N>C | p.Phe125Leu | p.F125L | Q9BV90 | protein_coding | deleterious(0.04) | probably_damaging(0.963) | TCGA-MT-A51W-01 | Oral cavity | head & neck squamous cell carcinoma | Female | <65 | I/II | Unknown | Unknown | SD |
| Page: 1 |
Top |
Related drugs of malignant transformation related genes |
| Identification of chemicals and drugs interact with genes involved in malignant transfromation |
| (DGIdb 4.0) |
| Entrez ID | Symbol | Category | Interaction Types | Drug Claim Name | Drug Name | PMIDs |
| Page: 1 |

Copyright 2023-Present -The University of Texas Health Science Center at Houston |