
|
|||||
|
 | |
| |
| |
| |
| |
| |
|
Gene: SNRK |
Gene summary for SNRK |
| Gene information | Species | Human | Gene symbol | SNRK | Gene ID | 54861 |
| Gene name | SNF related kinase | |
| Gene Alias | HSNFRK | |
| Cytomap | 3p22.1 | |
| Gene Type | protein-coding | GO ID | GO:0002376 | UniProtAcc | A0A024R2Y6 |
Top |
Malignant transformation analysis |
| Identification of the aberrant gene expression in precancerous and cancerous lesions by comparing the gene expression of stem-like cells in diseased tissues with normal stem cells |
| Entrez ID | Symbol | Replicates | Species | Organ | Tissue | Adj P-value | Log2FC | Malignancy |
| 54861 | SNRK | S43 | Human | Liver | Cirrhotic | 3.14e-05 | -1.30e-01 | -0.0187 |
| 54861 | SNRK | HCC1_Meng | Human | Liver | HCC | 9.18e-28 | -1.74e-01 | 0.0246 |
| 54861 | SNRK | HCC2_Meng | Human | Liver | HCC | 1.30e-03 | -1.55e-01 | 0.0107 |
| 54861 | SNRK | S027 | Human | Liver | HCC | 1.12e-02 | 4.15e-01 | 0.2446 |
| 54861 | SNRK | S028 | Human | Liver | HCC | 1.20e-09 | 5.02e-01 | 0.2503 |
| 54861 | SNRK | S029 | Human | Liver | HCC | 9.34e-07 | 5.50e-01 | 0.2581 |
| 54861 | SNRK | P2_S3_AK | Human | Skin | AK | 4.08e-03 | 1.65e-01 | -0.3287 |
| 54861 | SNRK | P2_S4_SCCIS | Human | Skin | SCCIS | 9.82e-09 | 3.50e-01 | -0.3043 |
| 54861 | SNRK | P3_S6_AK | Human | Skin | AK | 7.31e-04 | 2.17e-01 | -0.3256 |
| 54861 | SNRK | P4_S8_cSCC | Human | Skin | cSCC | 1.08e-18 | 4.66e-01 | -0.3095 |
| 54861 | SNRK | P5_S10_cSCC | Human | Skin | cSCC | 6.37e-03 | 1.68e-01 | -0.299 |
| 54861 | SNRK | P1_cSCC | Human | Skin | cSCC | 4.27e-04 | 2.88e-01 | 0.0292 |
| 54861 | SNRK | P4_cSCC | Human | Skin | cSCC | 3.86e-02 | 1.69e-01 | -0.00290000000000005 |
| 54861 | SNRK | cSCC_p10 | Human | Skin | cSCC | 8.87e-03 | 1.72e-01 | -0.2095 |
| 54861 | SNRK | cSCC_p11 | Human | Skin | cSCC | 1.98e-06 | 2.27e-01 | -0.2102 |
| 54861 | SNRK | cSCC_p8 | Human | Skin | cSCC | 2.01e-03 | 1.39e-01 | -0.1971 |
| 54861 | SNRK | cSCC_p9 | Human | Skin | cSCC | 2.27e-02 | 1.93e-01 | -0.1991 |
| Page: 1 |
| Tissue | Expression Dynamics | Abbreviation |
| Liver | 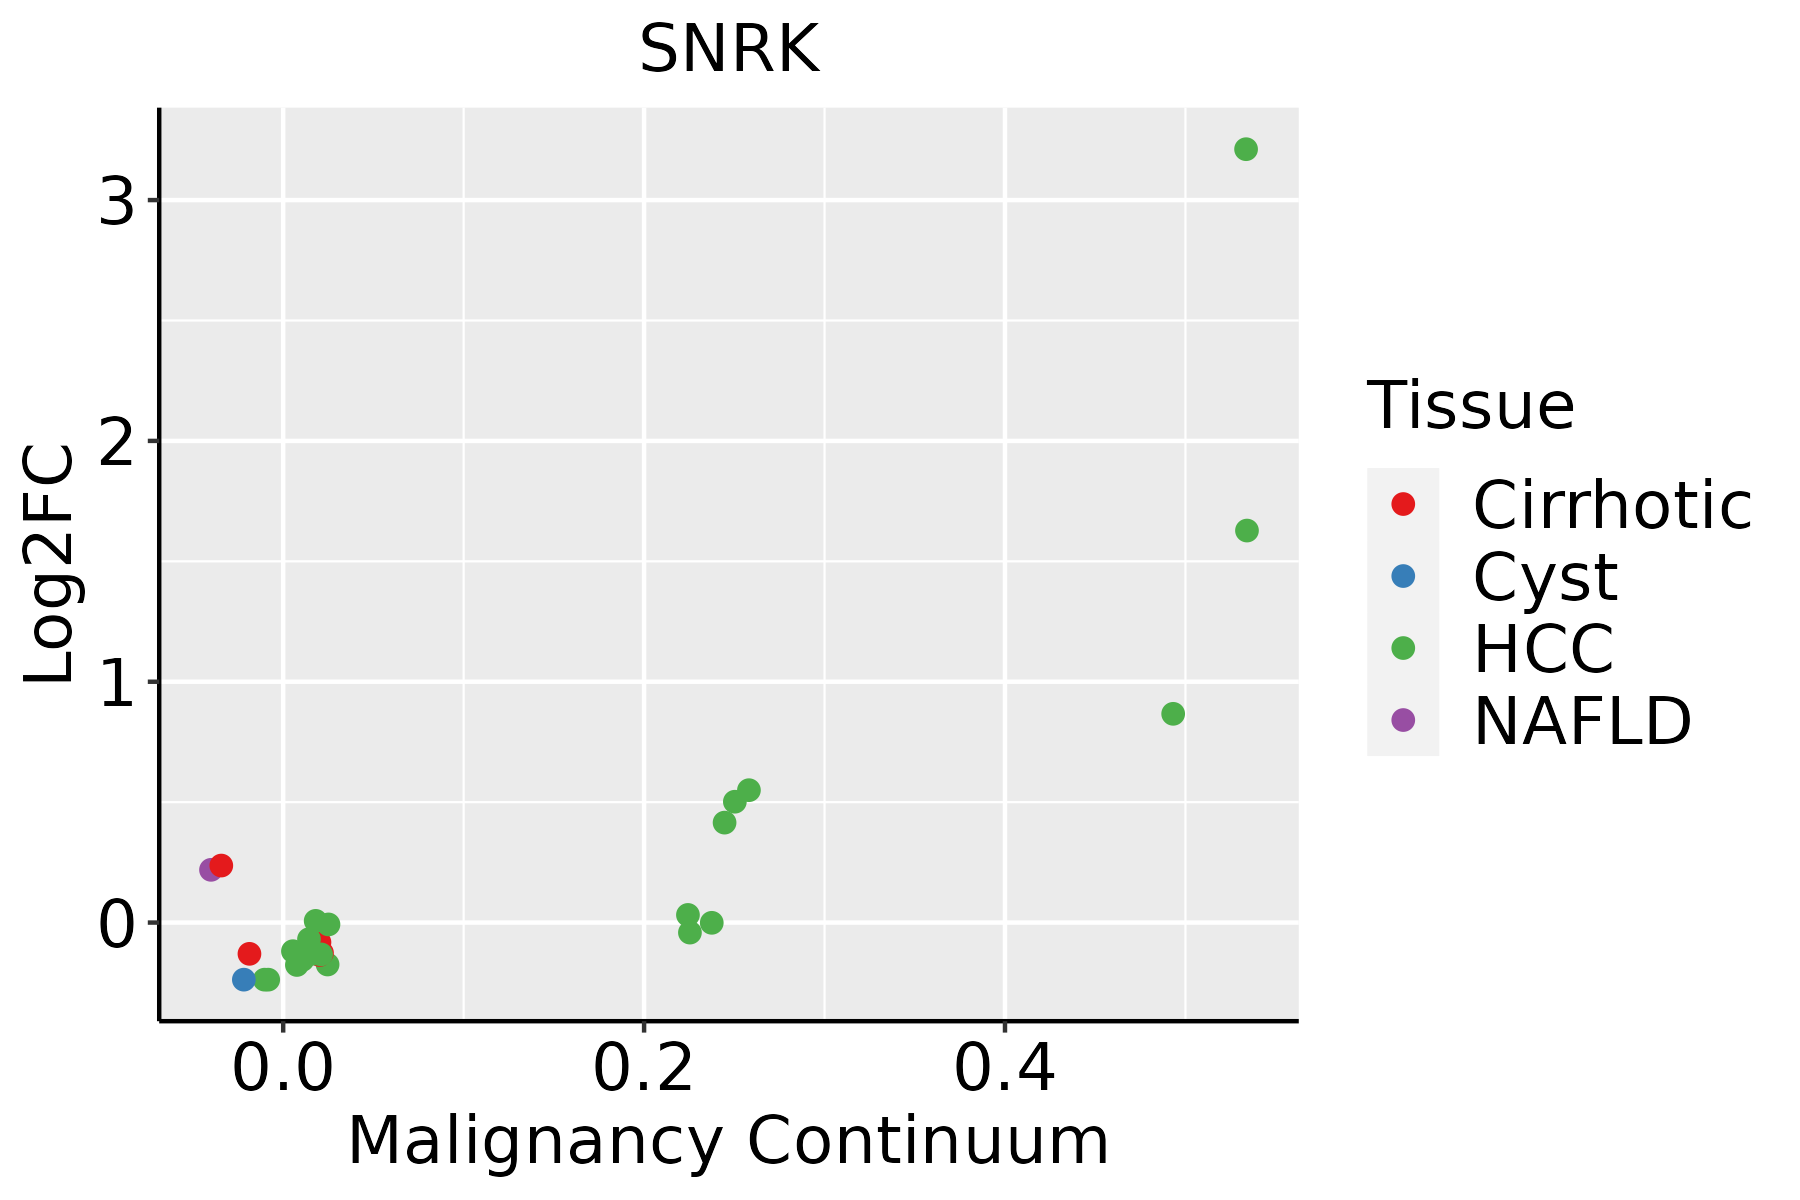 | HCC: Hepatocellular carcinoma |
| NAFLD: Non-alcoholic fatty liver disease | ||
| Skin | 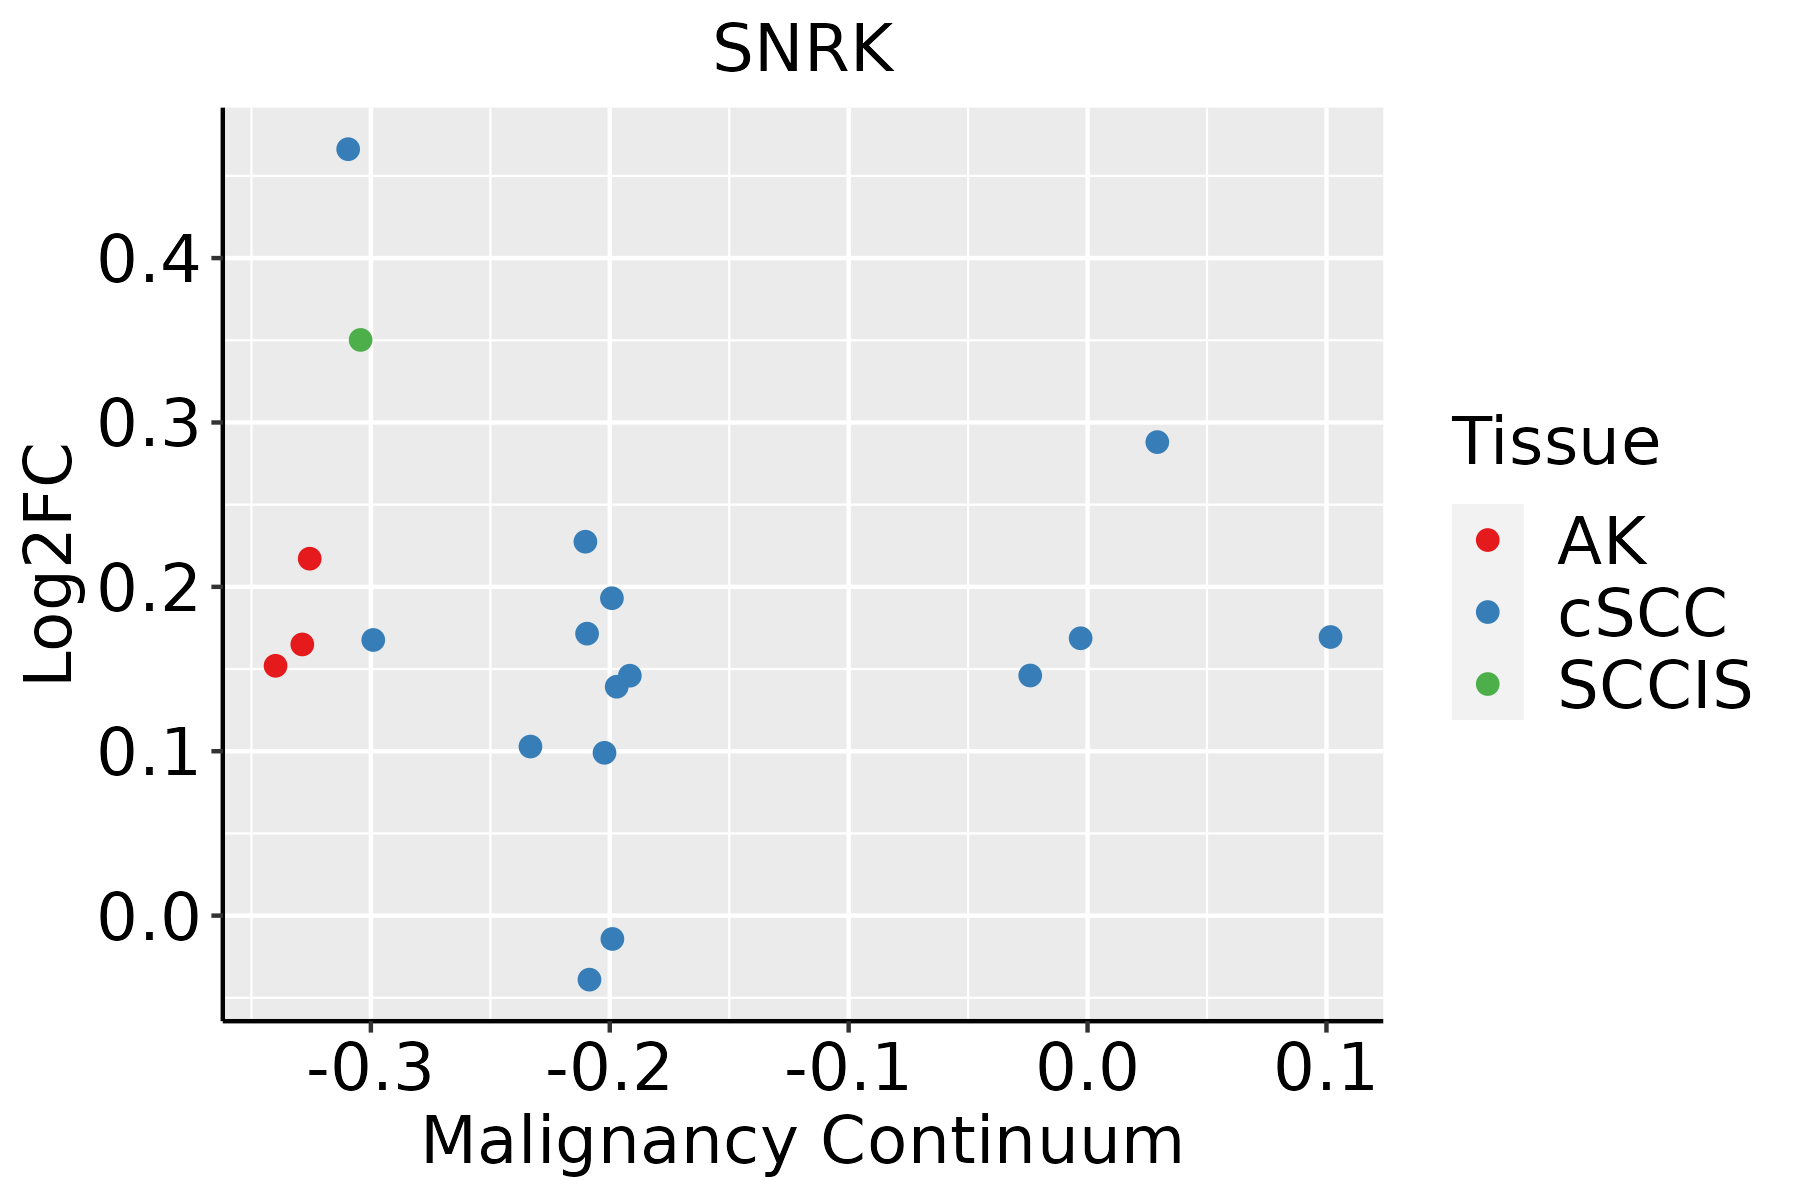 | AK: Actinic keratosis |
| cSCC: Cutaneous squamous cell carcinoma | ||
| SCCIS:squamous cell carcinoma in situ |
| ∗log2FC in expression of this searched gene in stem-like cells from each diseased tissue sample relative to stem-like cells in normal samples in each tissue plotted against the malignancy continuum. Samples are colored based on if they are from different disease stage. |
Top |
Malignant transformation related pathway analysis |
| Find out the enriched GO biological processes and KEGG pathways involved in transition from healthy to precancer to cancer |
| Tissue | Disease Stage | Enriched GO biological Processes |
| Colorectum | AD |  |
| Colorectum | SER |  |
| Colorectum | MSS |  |
| Colorectum | MSI-H |  |
| Colorectum | FAP |  |
| ∗Top 15 enriched GO BP terms are showed in the bar plot of each disease state in each tissue. Each row represents a significant GO biological process which is colored according to the -log10(p.adjust). |
| Page: 1 2 3 4 5 6 7 8 9 |
| GO ID | Tissue | Disease Stage | Description | Gene Ratio | Bg Ratio | pvalue | p.adjust | Count |
| GO:003009912 | Liver | Cirrhotic | myeloid cell differentiation | 135/4634 | 381/18723 | 1.69e-06 | 3.22e-05 | 135 |
| GO:003009922 | Liver | HCC | myeloid cell differentiation | 200/7958 | 381/18723 | 4.64e-05 | 4.49e-04 | 200 |
| GO:003009928 | Skin | AK | myeloid cell differentiation | 72/1910 | 381/18723 | 1.76e-07 | 7.28e-06 | 72 |
| GO:0030099112 | Skin | SCCIS | myeloid cell differentiation | 41/919 | 381/18723 | 2.11e-06 | 1.09e-04 | 41 |
| GO:003009929 | Skin | cSCC | myeloid cell differentiation | 146/4864 | 381/18723 | 6.38e-08 | 1.61e-06 | 146 |
| Page: 1 |
| Pathway ID | Tissue | Disease Stage | Description | Gene Ratio | Bg Ratio | pvalue | p.adjust | qvalue | Count |
| Page: 1 |
Top |
Cell-cell communication analysis |
| Identification of potential cell-cell interactions between two cell types and their ligand-receptor pairs for different disease states |
| Ligand | Receptor | LRpair | Pathway | Tissue | Disease Stage |
| Page: 1 |
Top |
Single-cell gene regulatory network inference analysis |
| Find out the significant the regulons (TFs) and the target genes of each regulon across cell types for different disease states |
| TF | Cell Type | Tissue | Disease Stage | Target Gene | RSS | Regulon Activity |
| ∗The dot plots of a searched regulon are shown for all cell subpopulations in each disease state of each tissue based on the regulon specific score inferred using pySCENIC and by calculating the average expression. |
| Page: 1 |
Top |
Somatic mutation of malignant transformation related genes |
| Annotation of somatic variants for genes involved in malignant transformation |
| Hugo Symbol | Variant Class | Variant Classification | dbSNP RS | HGVSc | HGVSp | HGVSp Short | SWISSPROT | BIOTYPE | SIFT | PolyPhen | Tumor Sample Barcode | Tissue | Histology | Sex | Age | Stage | Therapy Types | Drugs | Outcome |
| SNRK | SNV | Missense_Mutation | c.1000G>C | p.Glu334Gln | p.E334Q | Q9NRH2 | protein_coding | deleterious(0.01) | probably_damaging(0.982) | TCGA-A2-A0YK-01 | Breast | breast invasive carcinoma | Female | <65 | I/II | Chemotherapy | cytoxan | SD | |
| SNRK | SNV | Missense_Mutation | c.2098G>C | p.Ala700Pro | p.A700P | Q9NRH2 | protein_coding | tolerated_low_confidence(0.24) | benign(0) | TCGA-BH-A1EN-01 | Breast | breast invasive carcinoma | Female | >=65 | I/II | Unknown | Unknown | SD | |
| SNRK | SNV | Missense_Mutation | c.1128C>G | p.Asp376Glu | p.D376E | Q9NRH2 | protein_coding | tolerated(0.29) | benign(0.007) | TCGA-D8-A1JJ-01 | Breast | breast invasive carcinoma | Female | <65 | I/II | Chemotherapy | doxorubicine | SD | |
| SNRK | SNV | Missense_Mutation | c.1402N>T | p.Arg468Cys | p.R468C | Q9NRH2 | protein_coding | deleterious(0) | probably_damaging(0.925) | TCGA-E2-A14S-01 | Breast | breast invasive carcinoma | Female | >=65 | I/II | Chemotherapy | cytoxan | SD | |
| SNRK | insertion | In_Frame_Ins | novel | c.994_995insTCACTTATTATCTTA | p.Leu332_Ala333insThrTyrTyrLeuMet | p.L332_A333insTYYLM | Q9NRH2 | protein_coding | TCGA-A8-A07U-01 | Breast | breast invasive carcinoma | Female | >=65 | III/IV | Chemotherapy | 5-fluorouracil | SD | ||
| SNRK | insertion | In_Frame_Ins | novel | c.996_997insTGTCTAAAACTGACGTCTAACTCAGCT | p.Leu332_Ala333insCysLeuLysLeuThrSerAsnSerAla | p.L332_A333insCLKLTSNSA | Q9NRH2 | protein_coding | TCGA-A8-A07U-01 | Breast | breast invasive carcinoma | Female | >=65 | III/IV | Chemotherapy | 5-fluorouracil | SD | ||
| SNRK | insertion | Frame_Shift_Ins | novel | c.1426_1427insTCTGTTACATA | p.Arg476LeufsTer6 | p.R476Lfs*6 | Q9NRH2 | protein_coding | TCGA-BH-A0BM-01 | Breast | breast invasive carcinoma | Female | <65 | I/II | Chemotherapy | adriamycin | SD | ||
| SNRK | deletion | Frame_Shift_Del | c.165_169delAGCTA | p.Ala56TrpfsTer17 | p.A56Wfs*17 | Q9NRH2 | protein_coding | TCGA-EW-A1OY-01 | Breast | breast invasive carcinoma | Female | <65 | I/II | Chemotherapy | doxorubicin | SD | |||
| SNRK | SNV | Missense_Mutation | c.491A>G | p.Lys164Arg | p.K164R | Q9NRH2 | protein_coding | tolerated(0.54) | benign(0.066) | TCGA-2W-A8YY-01 | Cervix | cervical & endocervical cancer | Female | <65 | I/II | Chemotherapy | cisplatin | CR | |
| SNRK | SNV | Missense_Mutation | novel | c.689G>A | p.Cys230Tyr | p.C230Y | Q9NRH2 | protein_coding | deleterious(0) | probably_damaging(0.998) | TCGA-2W-A8YY-01 | Cervix | cervical & endocervical cancer | Female | <65 | I/II | Chemotherapy | cisplatin | CR |
| Page: 1 2 3 4 5 6 7 8 |
Top |
Related drugs of malignant transformation related genes |
| Identification of chemicals and drugs interact with genes involved in malignant transfromation |
| (DGIdb 4.0) |
| Entrez ID | Symbol | Category | Interaction Types | Drug Claim Name | Drug Name | PMIDs |
| Page: 1 |

Copyright 2023-Present -The University of Texas Health Science Center at Houston |