
|
|||||
|
 | |
| |
| |
| |
| |
| |
|
Gene: SNCG |
Gene summary for SNCG |
| Gene information | Species | Human | Gene symbol | SNCG | Gene ID | 6623 |
| Gene name | synuclein gamma | |
| Gene Alias | BCSG1 | |
| Cytomap | 10q23.2 | |
| Gene Type | protein-coding | GO ID | GO:0001505 | UniProtAcc | F8W754 |
Top |
Malignant transformation analysis |
| Identification of the aberrant gene expression in precancerous and cancerous lesions by comparing the gene expression of stem-like cells in diseased tissues with normal stem cells |
| Entrez ID | Symbol | Replicates | Species | Organ | Tissue | Adj P-value | Log2FC | Malignancy |
| 6623 | SNCG | LZE8T | Human | Esophagus | ESCC | 2.87e-05 | 3.65e-01 | 0.067 |
| 6623 | SNCG | LZE22T | Human | Esophagus | ESCC | 3.38e-04 | 1.18e+00 | 0.068 |
| 6623 | SNCG | P2T-E | Human | Esophagus | ESCC | 1.31e-24 | 6.41e-01 | 0.1177 |
| 6623 | SNCG | P4T-E | Human | Esophagus | ESCC | 2.58e-06 | 1.43e-01 | 0.1323 |
| 6623 | SNCG | P5T-E | Human | Esophagus | ESCC | 5.47e-04 | 5.99e-02 | 0.1327 |
| 6623 | SNCG | P8T-E | Human | Esophagus | ESCC | 1.37e-43 | 1.40e+00 | 0.0889 |
| 6623 | SNCG | P11T-E | Human | Esophagus | ESCC | 1.60e-05 | 5.22e-01 | 0.1426 |
| 6623 | SNCG | P12T-E | Human | Esophagus | ESCC | 1.36e-04 | 1.91e-01 | 0.1122 |
| 6623 | SNCG | P16T-E | Human | Esophagus | ESCC | 4.22e-07 | 1.84e-01 | 0.1153 |
| 6623 | SNCG | P17T-E | Human | Esophagus | ESCC | 1.11e-04 | 3.89e-01 | 0.1278 |
| 6623 | SNCG | P20T-E | Human | Esophagus | ESCC | 5.07e-04 | 1.74e-01 | 0.1124 |
| 6623 | SNCG | P21T-E | Human | Esophagus | ESCC | 3.59e-21 | 4.03e-01 | 0.1617 |
| 6623 | SNCG | P22T-E | Human | Esophagus | ESCC | 1.66e-08 | 2.32e-01 | 0.1236 |
| 6623 | SNCG | P24T-E | Human | Esophagus | ESCC | 2.15e-29 | 9.71e-01 | 0.1287 |
| 6623 | SNCG | P30T-E | Human | Esophagus | ESCC | 4.48e-08 | 5.39e-01 | 0.137 |
| 6623 | SNCG | P31T-E | Human | Esophagus | ESCC | 3.59e-14 | 3.66e-01 | 0.1251 |
| 6623 | SNCG | P36T-E | Human | Esophagus | ESCC | 6.53e-05 | 3.66e-01 | 0.1187 |
| 6623 | SNCG | P37T-E | Human | Esophagus | ESCC | 2.33e-07 | 2.11e-01 | 0.1371 |
| 6623 | SNCG | P38T-E | Human | Esophagus | ESCC | 5.85e-23 | 1.07e+00 | 0.127 |
| 6623 | SNCG | P40T-E | Human | Esophagus | ESCC | 3.64e-06 | 4.90e-01 | 0.109 |
| Page: 1 2 3 |
| Tissue | Expression Dynamics | Abbreviation |
| Esophagus |  | ESCC: Esophageal squamous cell carcinoma |
| HGIN: High-grade intraepithelial neoplasias | ||
| LGIN: Low-grade intraepithelial neoplasias | ||
| Liver | 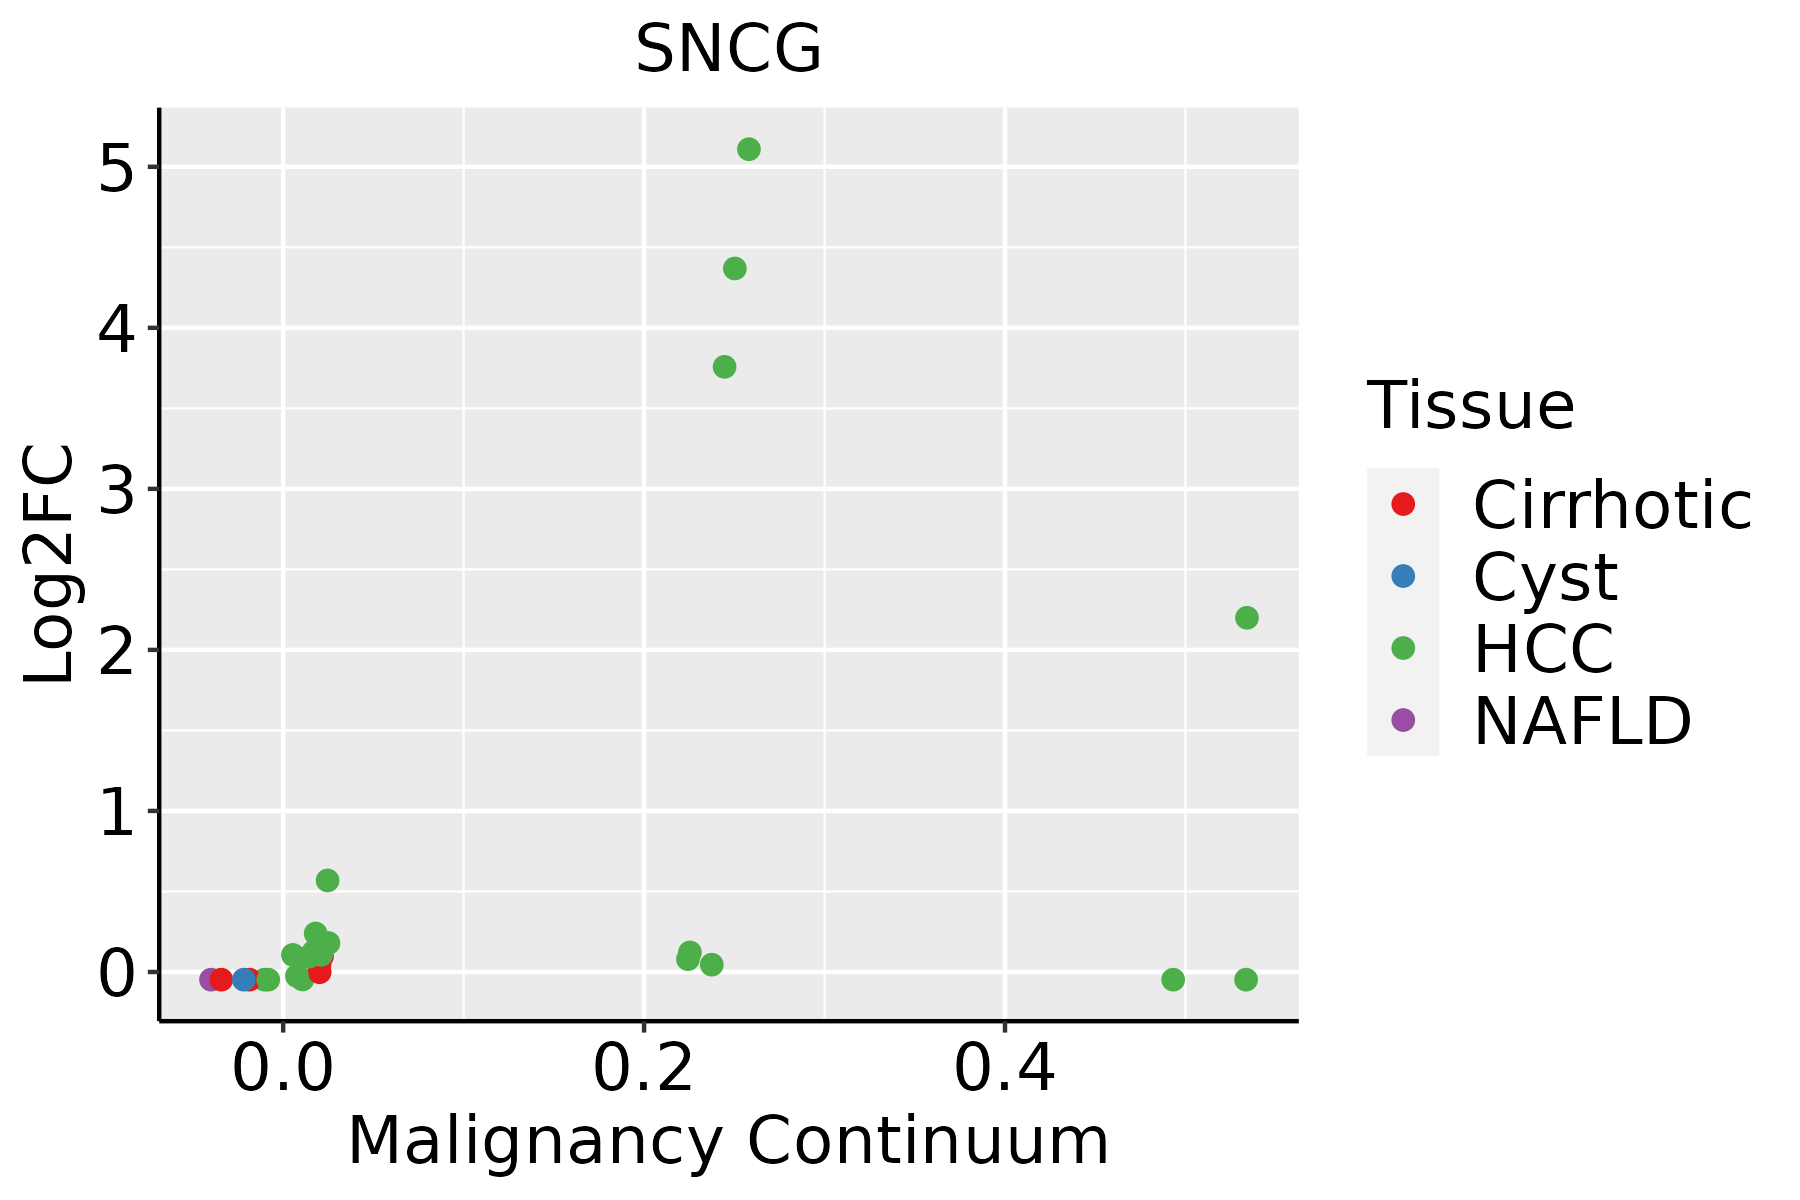 | HCC: Hepatocellular carcinoma |
| NAFLD: Non-alcoholic fatty liver disease | ||
| Oral Cavity | 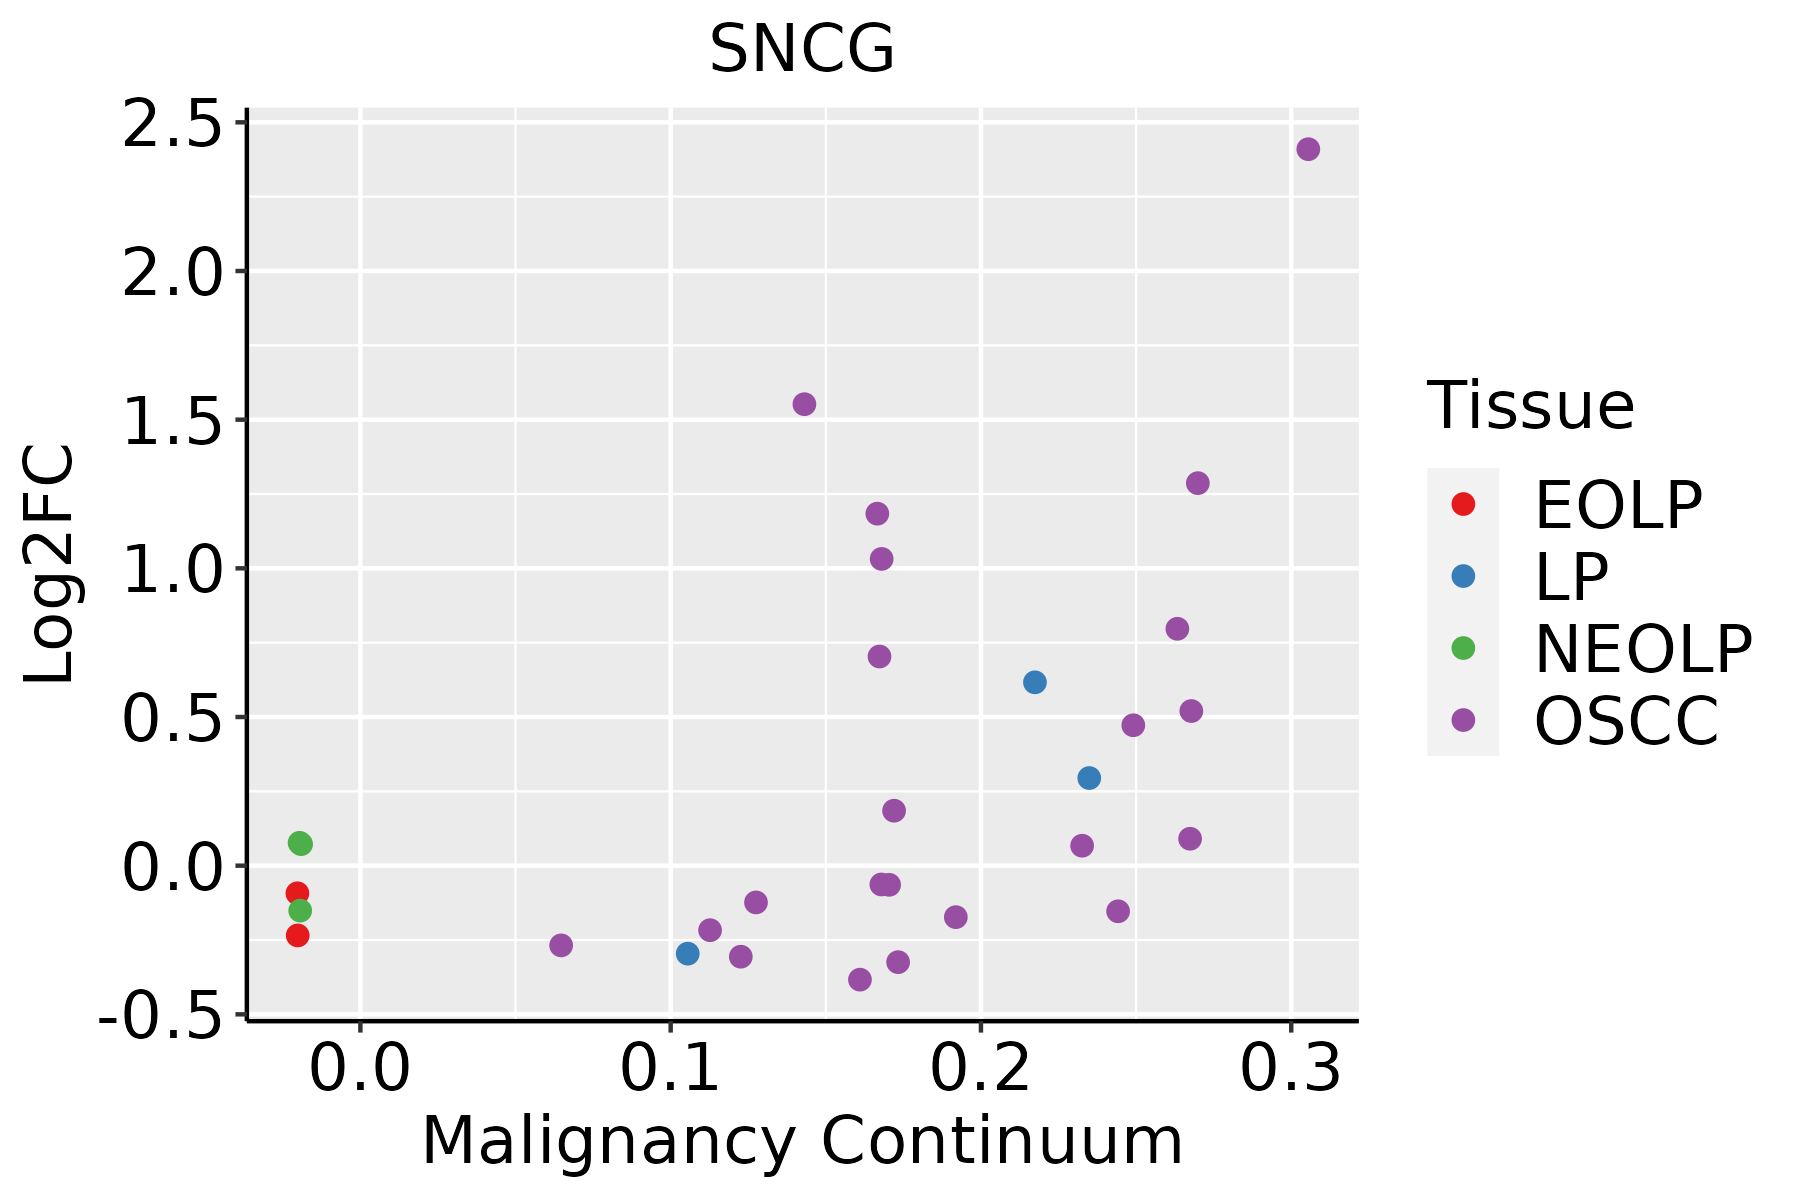 | EOLP: Erosive Oral lichen planus |
| LP: leukoplakia | ||
| NEOLP: Non-erosive oral lichen planus | ||
| OSCC: Oral squamous cell carcinoma |
| ∗log2FC in expression of this searched gene in stem-like cells from each diseased tissue sample relative to stem-like cells in normal samples in each tissue plotted against the malignancy continuum. Samples are colored based on if they are from different disease stage. |
Top |
Malignant transformation related pathway analysis |
| Find out the enriched GO biological processes and KEGG pathways involved in transition from healthy to precancer to cancer |
| Tissue | Disease Stage | Enriched GO biological Processes |
| Colorectum | AD |  |
| Colorectum | SER |  |
| Colorectum | MSS |  |
| Colorectum | MSI-H |  |
| Colorectum | FAP |  |
| ∗Top 15 enriched GO BP terms are showed in the bar plot of each disease state in each tissue. Each row represents a significant GO biological process which is colored according to the -log10(p.adjust). |
| Page: 1 2 3 4 5 6 7 8 9 |
| GO ID | Tissue | Disease Stage | Description | Gene Ratio | Bg Ratio | pvalue | p.adjust | Count |
| GO:0070997111 | Esophagus | ESCC | neuron death | 216/8552 | 361/18723 | 3.49e-08 | 6.45e-07 | 216 |
| GO:1901214111 | Esophagus | ESCC | regulation of neuron death | 186/8552 | 319/18723 | 3.35e-06 | 3.73e-05 | 186 |
| GO:000930617 | Esophagus | ESCC | protein secretion | 190/8552 | 359/18723 | 3.22e-03 | 1.34e-02 | 190 |
| GO:003559217 | Esophagus | ESCC | establishment of protein localization to extracellular region | 190/8552 | 360/18723 | 3.77e-03 | 1.53e-02 | 190 |
| GO:007169210 | Esophagus | ESCC | protein localization to extracellular region | 193/8552 | 368/18723 | 5.01e-03 | 1.92e-02 | 193 |
| GO:007099722 | Liver | HCC | neuron death | 202/7958 | 361/18723 | 1.44e-07 | 2.70e-06 | 202 |
| GO:190121412 | Liver | HCC | regulation of neuron death | 179/7958 | 319/18723 | 5.65e-07 | 9.01e-06 | 179 |
| GO:003559212 | Liver | HCC | establishment of protein localization to extracellular region | 176/7958 | 360/18723 | 7.96e-03 | 3.15e-02 | 176 |
| GO:000930612 | Liver | HCC | protein secretion | 175/7958 | 359/18723 | 9.32e-03 | 3.57e-02 | 175 |
| GO:007099720 | Oral cavity | OSCC | neuron death | 202/7305 | 361/18723 | 3.75e-11 | 1.23e-09 | 202 |
| GO:190121420 | Oral cavity | OSCC | regulation of neuron death | 174/7305 | 319/18723 | 1.09e-08 | 2.23e-07 | 174 |
| GO:000930610 | Oral cavity | OSCC | protein secretion | 169/7305 | 359/18723 | 1.04e-03 | 5.34e-03 | 169 |
| GO:003559210 | Oral cavity | OSCC | establishment of protein localization to extracellular region | 169/7305 | 360/18723 | 1.21e-03 | 6.08e-03 | 169 |
| GO:00716929 | Oral cavity | OSCC | protein localization to extracellular region | 172/7305 | 368/18723 | 1.40e-03 | 6.79e-03 | 172 |
| GO:007099726 | Oral cavity | EOLP | neuron death | 70/2218 | 361/18723 | 2.01e-05 | 3.18e-04 | 70 |
| GO:190121423 | Oral cavity | EOLP | regulation of neuron death | 60/2218 | 319/18723 | 1.83e-04 | 1.87e-03 | 60 |
| GO:00990035 | Oral cavity | EOLP | vesicle-mediated transport in synapse | 39/2218 | 200/18723 | 1.14e-03 | 8.29e-03 | 39 |
| GO:00995044 | Oral cavity | EOLP | synaptic vesicle cycle | 34/2218 | 181/18723 | 4.25e-03 | 2.33e-02 | 34 |
| GO:00484885 | Oral cavity | EOLP | synaptic vesicle endocytosis | 15/2218 | 62/18723 | 5.00e-03 | 2.64e-02 | 15 |
| GO:01402385 | Oral cavity | EOLP | presynaptic endocytosis | 15/2218 | 62/18723 | 5.00e-03 | 2.64e-02 | 15 |
| Page: 1 2 |
| Pathway ID | Tissue | Disease Stage | Description | Gene Ratio | Bg Ratio | pvalue | p.adjust | qvalue | Count |
| Page: 1 |
Top |
Cell-cell communication analysis |
| Identification of potential cell-cell interactions between two cell types and their ligand-receptor pairs for different disease states |
| Ligand | Receptor | LRpair | Pathway | Tissue | Disease Stage |
| Page: 1 |
Top |
Single-cell gene regulatory network inference analysis |
| Find out the significant the regulons (TFs) and the target genes of each regulon across cell types for different disease states |
| TF | Cell Type | Tissue | Disease Stage | Target Gene | RSS | Regulon Activity |
| ∗The dot plots of a searched regulon are shown for all cell subpopulations in each disease state of each tissue based on the regulon specific score inferred using pySCENIC and by calculating the average expression. |
| Page: 1 |
Top |
Somatic mutation of malignant transformation related genes |
| Annotation of somatic variants for genes involved in malignant transformation |
| Hugo Symbol | Variant Class | Variant Classification | dbSNP RS | HGVSc | HGVSp | HGVSp Short | SWISSPROT | BIOTYPE | SIFT | PolyPhen | Tumor Sample Barcode | Tissue | Histology | Sex | Age | Stage | Therapy Types | Drugs | Outcome |
| SNCG | SNV | Missense_Mutation | c.187N>A | p.Ala63Thr | p.A63T | O76070 | protein_coding | tolerated(0.1) | possibly_damaging(0.545) | TCGA-A6-4107-01 | Colorectum | colon adenocarcinoma | Female | <65 | III/IV | Chemotherapy | 5 | SD | |
| SNCG | SNV | Missense_Mutation | novel | c.227N>G | p.Thr76Ser | p.T76S | O76070 | protein_coding | tolerated(0.2) | benign(0.092) | TCGA-CA-6717-01 | Colorectum | colon adenocarcinoma | Male | <65 | I/II | Chemotherapy | oxaliplatin | CR |
| SNCG | SNV | Missense_Mutation | novel | c.44T>C | p.Val15Ala | p.V15A | O76070 | protein_coding | deleterious(0.03) | probably_damaging(0.994) | TCGA-AJ-A23O-01 | Endometrium | uterine corpus endometrioid carcinoma | Female | >=65 | I/II | Unknown | Unknown | SD |
| SNCG | SNV | Missense_Mutation | rs267602604 | c.325N>A | p.Gly109Ser | p.G109S | O76070 | protein_coding | deleterious(0.05) | benign(0.028) | TCGA-AP-A059-01 | Endometrium | uterine corpus endometrioid carcinoma | Female | >=65 | I/II | Unknown | Unknown | SD |
| SNCG | SNV | Missense_Mutation | novel | c.150G>T | p.Gln50His | p.Q50H | O76070 | protein_coding | tolerated(0.36) | benign(0.003) | TCGA-AP-A1DV-01 | Endometrium | uterine corpus endometrioid carcinoma | Female | <65 | I/II | Unknown | Unknown | SD |
| SNCG | SNV | Missense_Mutation | c.304N>A | p.Pro102Thr | p.P102T | O76070 | protein_coding | tolerated(0.1) | benign(0.096) | TCGA-B5-A11V-01 | Endometrium | uterine corpus endometrioid carcinoma | Female | <65 | I/II | Unknown | Unknown | SD | |
| SNCG | SNV | Missense_Mutation | rs529452849 | c.59A>G | p.Glu20Gly | p.E20G | O76070 | protein_coding | deleterious(0.04) | probably_damaging(0.998) | TCGA-BS-A0UF-01 | Endometrium | uterine corpus endometrioid carcinoma | Female | >=65 | I/II | Unknown | Unknown | SD |
| SNCG | SNV | Missense_Mutation | c.116N>G | p.Tyr39Cys | p.Y39C | O76070 | protein_coding | tolerated(0.06) | probably_damaging(0.999) | TCGA-D1-A15X-01 | Endometrium | uterine corpus endometrioid carcinoma | Female | <65 | I/II | Unknown | Unknown | SD | |
| SNCG | SNV | Missense_Mutation | novel | c.63G>T | p.Lys21Asn | p.K21N | O76070 | protein_coding | deleterious(0) | probably_damaging(0.998) | TCGA-EO-A3B0-01 | Endometrium | uterine corpus endometrioid carcinoma | Female | <65 | III/IV | Unknown | Unknown | SD |
| SNCG | deletion | Frame_Shift_Del | novel | c.72delN | p.Val26Ter | p.V26* | O76070 | protein_coding | TCGA-AP-A05N-01 | Endometrium | uterine corpus endometrioid carcinoma | Female | <65 | I/II | Unknown | Unknown | SD |
| Page: 1 2 |
Top |
Related drugs of malignant transformation related genes |
| Identification of chemicals and drugs interact with genes involved in malignant transfromation |
| (DGIdb 4.0) |
| Entrez ID | Symbol | Category | Interaction Types | Drug Claim Name | Drug Name | PMIDs |
| Page: 1 |

Copyright 2023-Present -The University of Texas Health Science Center at Houston |