
|
|||||
|
 | |
| |
| |
| |
| |
| |
|
Gene: SNAPIN |
Gene summary for SNAPIN |
| Gene information | Species | Human | Gene symbol | SNAPIN | Gene ID | 23557 |
| Gene name | SNAP associated protein | |
| Gene Alias | BLOC1S7 | |
| Cytomap | 1q21.3 | |
| Gene Type | protein-coding | GO ID | GO:0001505 | UniProtAcc | O95295 |
Top |
Malignant transformation analysis |
| Identification of the aberrant gene expression in precancerous and cancerous lesions by comparing the gene expression of stem-like cells in diseased tissues with normal stem cells |
| Entrez ID | Symbol | Replicates | Species | Organ | Tissue | Adj P-value | Log2FC | Malignancy |
| 23557 | SNAPIN | LZE2T | Human | Esophagus | ESCC | 3.19e-05 | 7.49e-01 | 0.082 |
| 23557 | SNAPIN | LZE4T | Human | Esophagus | ESCC | 2.96e-19 | 5.60e-01 | 0.0811 |
| 23557 | SNAPIN | LZE5T | Human | Esophagus | ESCC | 6.03e-06 | 3.09e-01 | 0.0514 |
| 23557 | SNAPIN | LZE7T | Human | Esophagus | ESCC | 7.21e-12 | 7.51e-01 | 0.0667 |
| 23557 | SNAPIN | LZE8T | Human | Esophagus | ESCC | 1.50e-09 | 3.28e-01 | 0.067 |
| 23557 | SNAPIN | LZE20T | Human | Esophagus | ESCC | 4.13e-09 | 2.65e-01 | 0.0662 |
| 23557 | SNAPIN | LZE22T | Human | Esophagus | ESCC | 4.64e-09 | 7.30e-01 | 0.068 |
| 23557 | SNAPIN | LZE24T | Human | Esophagus | ESCC | 1.33e-30 | 6.54e-01 | 0.0596 |
| 23557 | SNAPIN | LZE21T | Human | Esophagus | ESCC | 2.01e-02 | 3.63e-01 | 0.0655 |
| 23557 | SNAPIN | LZE6T | Human | Esophagus | ESCC | 4.47e-19 | 8.19e-01 | 0.0845 |
| 23557 | SNAPIN | P1T-E | Human | Esophagus | ESCC | 5.64e-12 | 6.04e-01 | 0.0875 |
| 23557 | SNAPIN | P2T-E | Human | Esophagus | ESCC | 5.81e-48 | 9.30e-01 | 0.1177 |
| 23557 | SNAPIN | P4T-E | Human | Esophagus | ESCC | 4.19e-52 | 1.14e+00 | 0.1323 |
| 23557 | SNAPIN | P5T-E | Human | Esophagus | ESCC | 3.79e-35 | 6.55e-01 | 0.1327 |
| 23557 | SNAPIN | P8T-E | Human | Esophagus | ESCC | 1.02e-39 | 7.00e-01 | 0.0889 |
| 23557 | SNAPIN | P9T-E | Human | Esophagus | ESCC | 1.06e-40 | 9.60e-01 | 0.1131 |
| 23557 | SNAPIN | P10T-E | Human | Esophagus | ESCC | 1.55e-37 | 7.05e-01 | 0.116 |
| 23557 | SNAPIN | P11T-E | Human | Esophagus | ESCC | 5.95e-27 | 8.32e-01 | 0.1426 |
| 23557 | SNAPIN | P12T-E | Human | Esophagus | ESCC | 2.22e-34 | 5.88e-01 | 0.1122 |
| 23557 | SNAPIN | P15T-E | Human | Esophagus | ESCC | 1.98e-46 | 9.53e-01 | 0.1149 |
| Page: 1 2 3 4 5 6 |
| Tissue | Expression Dynamics | Abbreviation |
| Esophagus |  | ESCC: Esophageal squamous cell carcinoma |
| HGIN: High-grade intraepithelial neoplasias | ||
| LGIN: Low-grade intraepithelial neoplasias | ||
| Liver |  | HCC: Hepatocellular carcinoma |
| NAFLD: Non-alcoholic fatty liver disease | ||
| Oral Cavity | 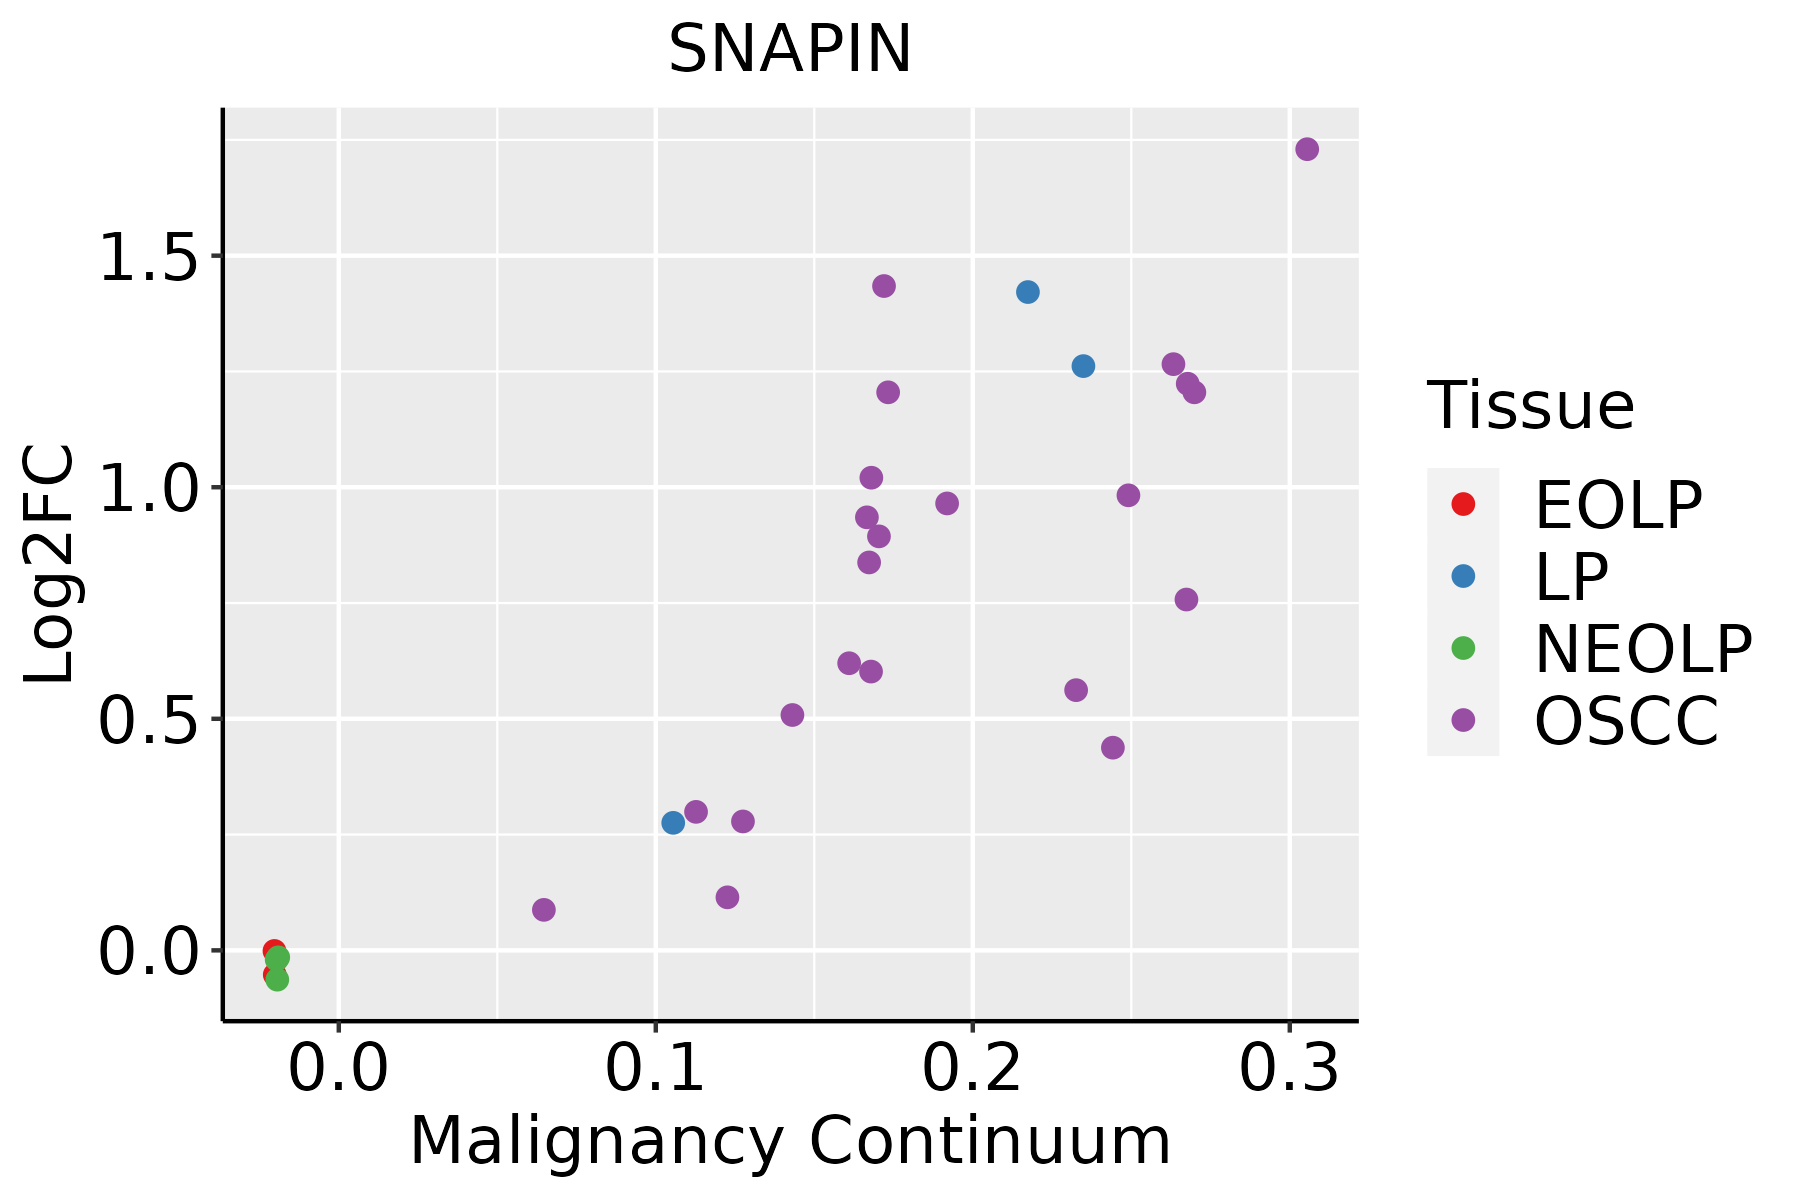 | EOLP: Erosive Oral lichen planus |
| LP: leukoplakia | ||
| NEOLP: Non-erosive oral lichen planus | ||
| OSCC: Oral squamous cell carcinoma | ||
| Skin | 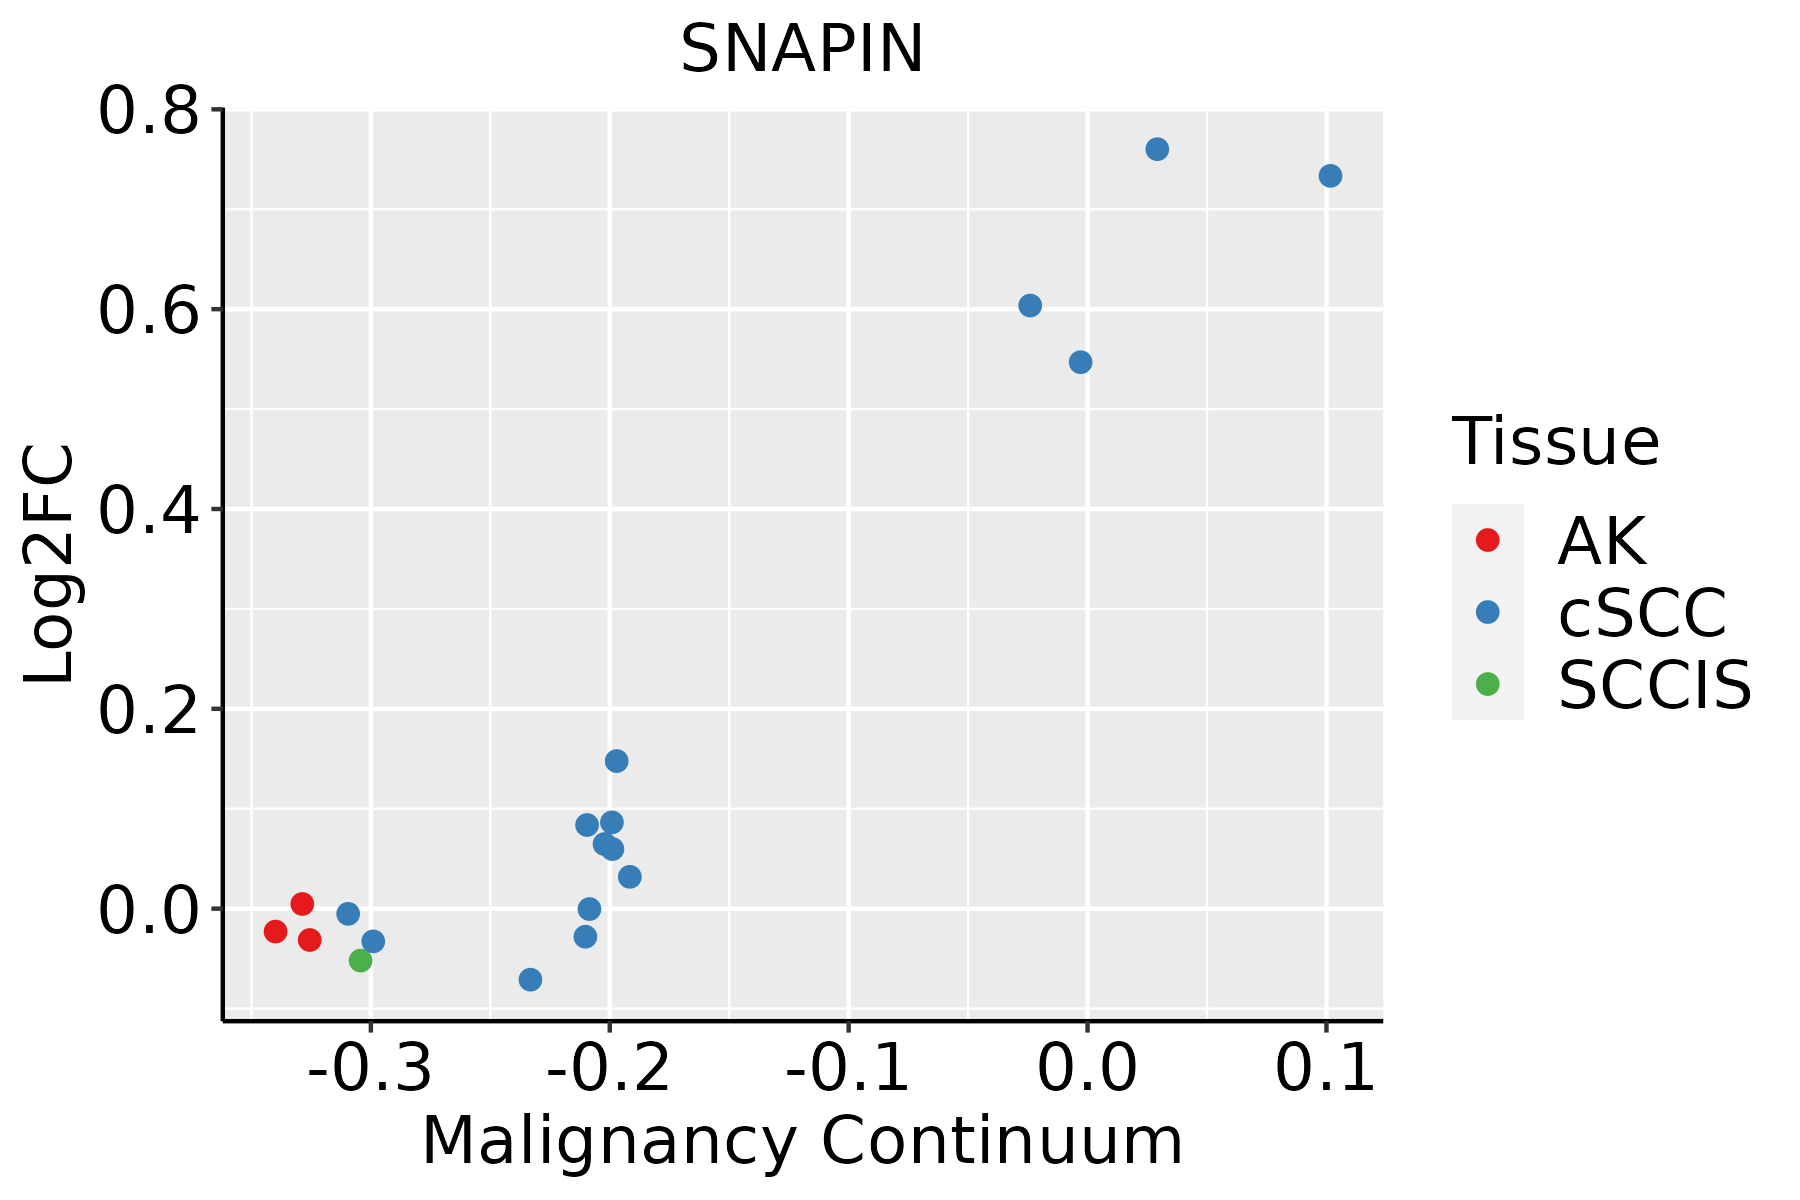 | AK: Actinic keratosis |
| cSCC: Cutaneous squamous cell carcinoma | ||
| SCCIS:squamous cell carcinoma in situ |
| ∗log2FC in expression of this searched gene in stem-like cells from each diseased tissue sample relative to stem-like cells in normal samples in each tissue plotted against the malignancy continuum. Samples are colored based on if they are from different disease stage. |
Top |
Malignant transformation related pathway analysis |
| Find out the enriched GO biological processes and KEGG pathways involved in transition from healthy to precancer to cancer |
| Tissue | Disease Stage | Enriched GO biological Processes |
| Colorectum | AD |  |
| Colorectum | SER |  |
| Colorectum | MSS |  |
| Colorectum | MSI-H |  |
| Colorectum | FAP |  |
| ∗Top 15 enriched GO BP terms are showed in the bar plot of each disease state in each tissue. Each row represents a significant GO biological process which is colored according to the -log10(p.adjust). |
| Page: 1 2 3 4 5 6 7 8 9 |
| GO ID | Tissue | Disease Stage | Description | Gene Ratio | Bg Ratio | pvalue | p.adjust | Count |
| GO:001623617 | Esophagus | ESCC | macroautophagy | 216/8552 | 291/18723 | 1.94e-23 | 4.57e-21 | 216 |
| GO:0022411111 | Esophagus | ESCC | cellular component disassembly | 305/8552 | 443/18723 | 1.94e-23 | 4.57e-21 | 305 |
| GO:005165617 | Esophagus | ESCC | establishment of organelle localization | 273/8552 | 390/18723 | 9.13e-23 | 1.81e-20 | 273 |
| GO:0051098111 | Esophagus | ESCC | regulation of binding | 251/8552 | 363/18723 | 6.73e-20 | 8.46e-18 | 251 |
| GO:001605014 | Esophagus | ESCC | vesicle organization | 211/8552 | 300/18723 | 2.85e-18 | 2.87e-16 | 211 |
| GO:000703417 | Esophagus | ESCC | vacuolar transport | 119/8552 | 157/18723 | 1.16e-14 | 6.30e-13 | 119 |
| GO:000703314 | Esophagus | ESCC | vacuole organization | 127/8552 | 180/18723 | 1.04e-11 | 3.85e-10 | 127 |
| GO:003298416 | Esophagus | ESCC | protein-containing complex disassembly | 151/8552 | 224/18723 | 3.45e-11 | 1.15e-09 | 151 |
| GO:004339320 | Esophagus | ESCC | regulation of protein binding | 135/8552 | 196/18723 | 3.69e-11 | 1.22e-09 | 135 |
| GO:005160418 | Esophagus | ESCC | protein maturation | 189/8552 | 294/18723 | 7.64e-11 | 2.39e-09 | 189 |
| GO:005165016 | Esophagus | ESCC | establishment of vesicle localization | 114/8552 | 161/18723 | 8.20e-11 | 2.53e-09 | 114 |
| GO:003070518 | Esophagus | ESCC | cytoskeleton-dependent intracellular transport | 133/8552 | 195/18723 | 1.48e-10 | 4.27e-09 | 133 |
| GO:001097013 | Esophagus | ESCC | transport along microtubule | 107/8552 | 155/18723 | 3.17e-09 | 6.80e-08 | 107 |
| GO:00070419 | Esophagus | ESCC | lysosomal transport | 83/8552 | 114/18723 | 3.52e-09 | 7.41e-08 | 83 |
| GO:005164815 | Esophagus | ESCC | vesicle localization | 119/8552 | 177/18723 | 5.16e-09 | 1.08e-07 | 119 |
| GO:00723846 | Esophagus | ESCC | organelle transport along microtubule | 65/8552 | 85/18723 | 6.61e-09 | 1.35e-07 | 65 |
| GO:000808810 | Esophagus | ESCC | axo-dendritic transport | 58/8552 | 75/18723 | 2.09e-08 | 4.02e-07 | 58 |
| GO:003150314 | Esophagus | ESCC | protein-containing complex localization | 139/8552 | 220/18723 | 1.14e-07 | 1.85e-06 | 139 |
| GO:00482844 | Esophagus | ESCC | organelle fusion | 94/8552 | 141/18723 | 3.72e-07 | 5.16e-06 | 94 |
| GO:00989304 | Esophagus | ESCC | axonal transport | 49/8552 | 64/18723 | 4.54e-07 | 6.15e-06 | 49 |
| Page: 1 2 3 4 5 6 7 8 9 10 11 |
| Pathway ID | Tissue | Disease Stage | Description | Gene Ratio | Bg Ratio | pvalue | p.adjust | qvalue | Count |
| Page: 1 |
Top |
Cell-cell communication analysis |
| Identification of potential cell-cell interactions between two cell types and their ligand-receptor pairs for different disease states |
| Ligand | Receptor | LRpair | Pathway | Tissue | Disease Stage |
| Page: 1 |
Top |
Single-cell gene regulatory network inference analysis |
| Find out the significant the regulons (TFs) and the target genes of each regulon across cell types for different disease states |
| TF | Cell Type | Tissue | Disease Stage | Target Gene | RSS | Regulon Activity |
| ∗The dot plots of a searched regulon are shown for all cell subpopulations in each disease state of each tissue based on the regulon specific score inferred using pySCENIC and by calculating the average expression. |
| Page: 1 |
Top |
Somatic mutation of malignant transformation related genes |
| Annotation of somatic variants for genes involved in malignant transformation |
| Hugo Symbol | Variant Class | Variant Classification | dbSNP RS | HGVSc | HGVSp | HGVSp Short | SWISSPROT | BIOTYPE | SIFT | PolyPhen | Tumor Sample Barcode | Tissue | Histology | Sex | Age | Stage | Therapy Types | Drugs | Outcome |
| SNAPIN | SNV | Missense_Mutation | novel | c.242N>G | p.Tyr81Cys | p.Y81C | O95295 | protein_coding | deleterious(0) | probably_damaging(0.923) | TCGA-B6-A0IB-01 | Breast | breast invasive carcinoma | Female | <65 | III/IV | Unknown | Unknown | PD |
| SNAPIN | SNV | Missense_Mutation | novel | c.365N>T | p.Ala122Val | p.A122V | O95295 | protein_coding | tolerated(0.09) | benign(0.375) | TCGA-PE-A5DC-01 | Breast | breast invasive carcinoma | Female | >=65 | III/IV | Unknown | Unknown | SD |
| SNAPIN | insertion | Frame_Shift_Ins | novel | c.252_253insTT | p.Leu85PhefsTer23 | p.L85Ffs*23 | O95295 | protein_coding | TCGA-AO-A0JB-01 | Breast | breast invasive carcinoma | Female | <65 | III/IV | Chemotherapy | cyclophosphamide | SD | ||
| SNAPIN | insertion | In_Frame_Ins | novel | c.254_255insGGCTGGGAGTGGGCATAAATTTAGGAAACTGATTCG | p.Leu85_Leu86insAlaGlySerGlyHisLysPheArgLysLeuIleArg | p.L85_L86insAGSGHKFRKLIR | O95295 | protein_coding | TCGA-AO-A0JB-01 | Breast | breast invasive carcinoma | Female | <65 | III/IV | Chemotherapy | cyclophosphamide | SD | ||
| SNAPIN | insertion | Frame_Shift_Ins | novel | c.386_387insC | p.Gly132TrpfsTer32 | p.G132Wfs*32 | O95295 | protein_coding | TCGA-AA-3672-01 | Colorectum | colon adenocarcinoma | Female | >=65 | III/IV | Unknown | Unknown | SD | ||
| SNAPIN | insertion | Frame_Shift_Ins | novel | c.316_317insT | p.Arg107GlufsTer57 | p.R107Efs*57 | O95295 | protein_coding | TCGA-AG-A015-01 | Colorectum | rectum adenocarcinoma | Female | <65 | I/II | Unknown | Unknown | PD | ||
| SNAPIN | SNV | Missense_Mutation | c.290A>G | p.Asn97Ser | p.N97S | O95295 | protein_coding | tolerated(0.08) | benign(0.162) | TCGA-B5-A0JY-01 | Endometrium | uterine corpus endometrioid carcinoma | Female | <65 | III/IV | Chemotherapy | doxorubicin | SD | |
| SNAPIN | SNV | Missense_Mutation | c.314G>A | p.Arg105Gln | p.R105Q | O95295 | protein_coding | deleterious(0) | probably_damaging(0.992) | TCGA-B5-A0JY-01 | Endometrium | uterine corpus endometrioid carcinoma | Female | <65 | III/IV | Chemotherapy | doxorubicin | SD | |
| SNAPIN | SNV | Missense_Mutation | rs759411679 | c.256N>T | p.Leu86Phe | p.L86F | O95295 | protein_coding | tolerated(0.16) | benign(0.017) | TCGA-B5-A3FA-01 | Endometrium | uterine corpus endometrioid carcinoma | Female | >=65 | I/II | Unknown | Unknown | SD |
| SNAPIN | deletion | Frame_Shift_Del | novel | c.387delN | p.Pro131LeufsTer9 | p.P131Lfs*9 | O95295 | protein_coding | TCGA-A5-A7WJ-01 | Endometrium | uterine corpus endometrioid carcinoma | Female | <65 | I/II | Unknown | Unknown | SD |
| Page: 1 2 |
Top |
Related drugs of malignant transformation related genes |
| Identification of chemicals and drugs interact with genes involved in malignant transfromation |
| (DGIdb 4.0) |
| Entrez ID | Symbol | Category | Interaction Types | Drug Claim Name | Drug Name | PMIDs |
| Page: 1 |

Copyright 2023-Present -The University of Texas Health Science Center at Houston |