
|
|||||
|
 | |
| |
| |
| |
| |
| |
|
Gene: SNAPC5 |
Gene summary for SNAPC5 |
| Gene information | Species | Human | Gene symbol | SNAPC5 | Gene ID | 10302 |
| Gene name | small nuclear RNA activating complex polypeptide 5 | |
| Gene Alias | SNAP19 | |
| Cytomap | 15q22.31 | |
| Gene Type | protein-coding | GO ID | GO:0006139 | UniProtAcc | O75971 |
Top |
Malignant transformation analysis |
| Identification of the aberrant gene expression in precancerous and cancerous lesions by comparing the gene expression of stem-like cells in diseased tissues with normal stem cells |
| Entrez ID | Symbol | Replicates | Species | Organ | Tissue | Adj P-value | Log2FC | Malignancy |
| 10302 | SNAPC5 | LZE4T | Human | Esophagus | ESCC | 1.29e-11 | 3.26e-01 | 0.0811 |
| 10302 | SNAPC5 | LZE5T | Human | Esophagus | ESCC | 1.79e-02 | 1.68e-01 | 0.0514 |
| 10302 | SNAPC5 | LZE7T | Human | Esophagus | ESCC | 1.09e-08 | 4.07e-01 | 0.0667 |
| 10302 | SNAPC5 | LZE8T | Human | Esophagus | ESCC | 9.19e-06 | 1.68e-01 | 0.067 |
| 10302 | SNAPC5 | LZE22T | Human | Esophagus | ESCC | 3.81e-05 | 2.81e-01 | 0.068 |
| 10302 | SNAPC5 | LZE24T | Human | Esophagus | ESCC | 1.42e-13 | 3.06e-01 | 0.0596 |
| 10302 | SNAPC5 | LZE21T | Human | Esophagus | ESCC | 2.67e-07 | 3.54e-01 | 0.0655 |
| 10302 | SNAPC5 | LZE6T | Human | Esophagus | ESCC | 5.78e-08 | 4.10e-01 | 0.0845 |
| 10302 | SNAPC5 | P1T-E | Human | Esophagus | ESCC | 8.97e-16 | 6.15e-01 | 0.0875 |
| 10302 | SNAPC5 | P2T-E | Human | Esophagus | ESCC | 9.02e-28 | 4.59e-01 | 0.1177 |
| 10302 | SNAPC5 | P4T-E | Human | Esophagus | ESCC | 3.79e-34 | 7.27e-01 | 0.1323 |
| 10302 | SNAPC5 | P5T-E | Human | Esophagus | ESCC | 2.53e-26 | 5.76e-01 | 0.1327 |
| 10302 | SNAPC5 | P8T-E | Human | Esophagus | ESCC | 5.22e-19 | 3.85e-01 | 0.0889 |
| 10302 | SNAPC5 | P9T-E | Human | Esophagus | ESCC | 4.65e-23 | 5.08e-01 | 0.1131 |
| 10302 | SNAPC5 | P10T-E | Human | Esophagus | ESCC | 7.76e-03 | 9.22e-02 | 0.116 |
| 10302 | SNAPC5 | P11T-E | Human | Esophagus | ESCC | 2.07e-15 | 5.07e-01 | 0.1426 |
| 10302 | SNAPC5 | P12T-E | Human | Esophagus | ESCC | 2.04e-19 | 4.11e-01 | 0.1122 |
| 10302 | SNAPC5 | P15T-E | Human | Esophagus | ESCC | 5.19e-32 | 6.24e-01 | 0.1149 |
| 10302 | SNAPC5 | P16T-E | Human | Esophagus | ESCC | 2.58e-41 | 7.44e-01 | 0.1153 |
| 10302 | SNAPC5 | P17T-E | Human | Esophagus | ESCC | 1.91e-06 | 1.99e-01 | 0.1278 |
| Page: 1 2 3 4 5 |
| Tissue | Expression Dynamics | Abbreviation |
| Esophagus | 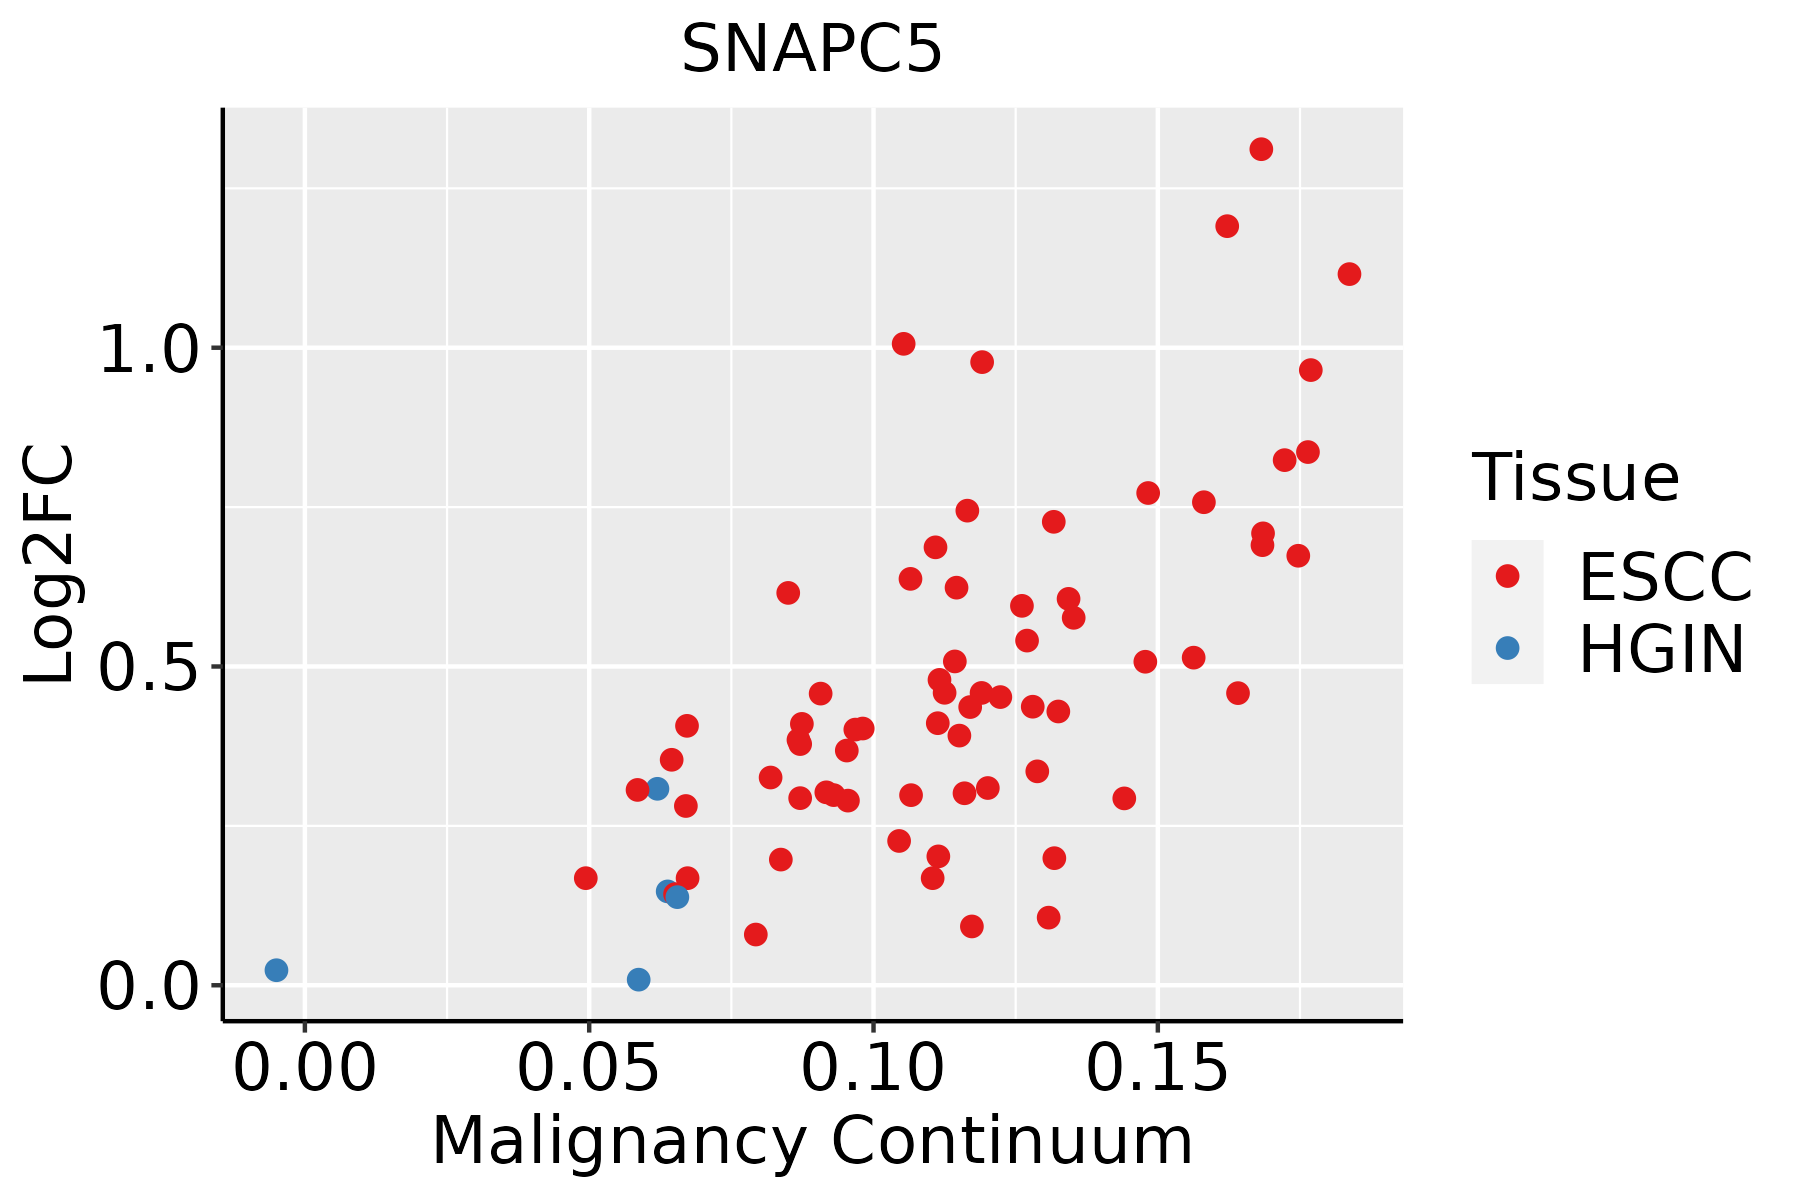 | ESCC: Esophageal squamous cell carcinoma |
| HGIN: High-grade intraepithelial neoplasias | ||
| LGIN: Low-grade intraepithelial neoplasias | ||
| Liver | 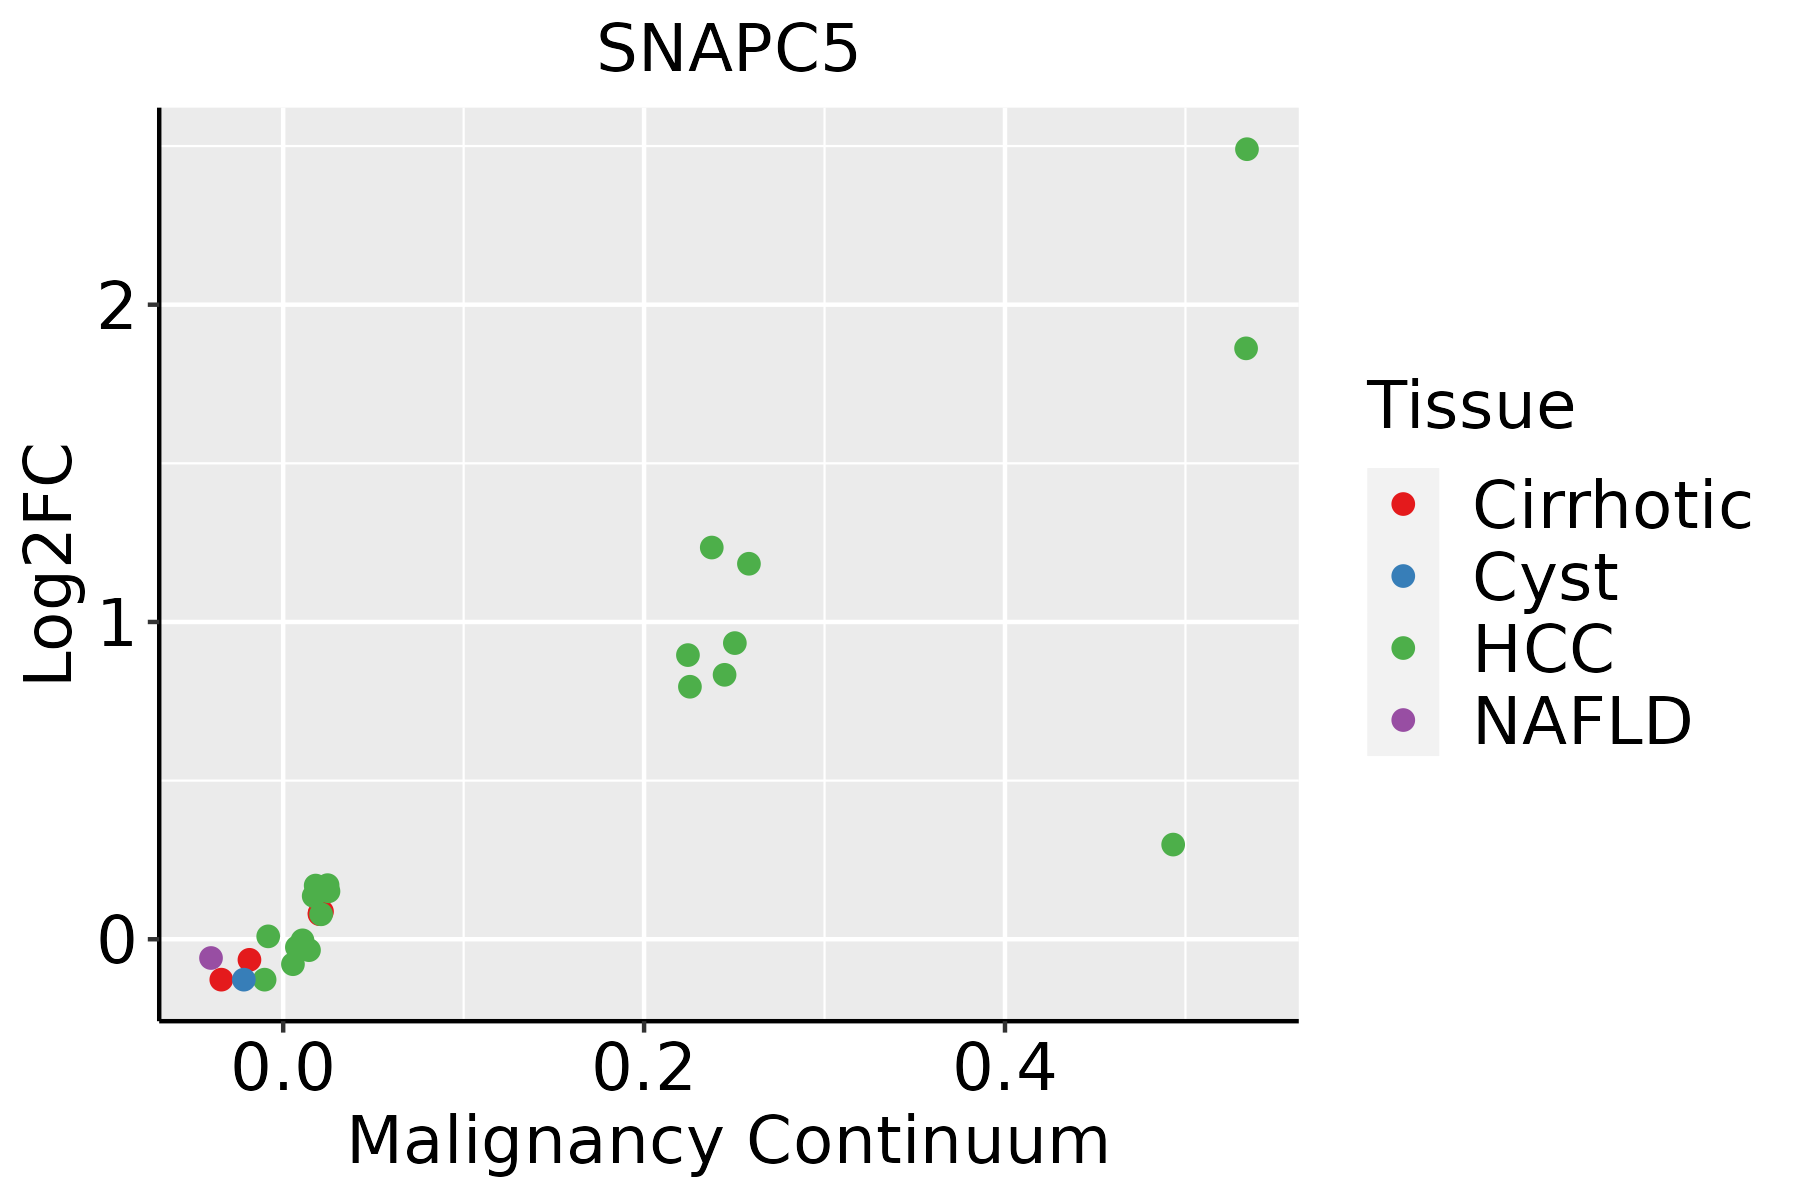 | HCC: Hepatocellular carcinoma |
| NAFLD: Non-alcoholic fatty liver disease | ||
| Oral Cavity |  | EOLP: Erosive Oral lichen planus |
| LP: leukoplakia | ||
| NEOLP: Non-erosive oral lichen planus | ||
| OSCC: Oral squamous cell carcinoma | ||
| Skin |  | AK: Actinic keratosis |
| cSCC: Cutaneous squamous cell carcinoma | ||
| SCCIS:squamous cell carcinoma in situ |
| ∗log2FC in expression of this searched gene in stem-like cells from each diseased tissue sample relative to stem-like cells in normal samples in each tissue plotted against the malignancy continuum. Samples are colored based on if they are from different disease stage. |
Top |
Malignant transformation related pathway analysis |
| Find out the enriched GO biological processes and KEGG pathways involved in transition from healthy to precancer to cancer |
| Tissue | Disease Stage | Enriched GO biological Processes |
| Colorectum | AD |  |
| Colorectum | SER |  |
| Colorectum | MSS |  |
| Colorectum | MSI-H |  |
| Colorectum | FAP |  |
| ∗Top 15 enriched GO BP terms are showed in the bar plot of each disease state in each tissue. Each row represents a significant GO biological process which is colored according to the -log10(p.adjust). |
| Page: 1 2 3 4 5 6 7 8 9 |
| GO ID | Tissue | Disease Stage | Description | Gene Ratio | Bg Ratio | pvalue | p.adjust | Count |
| GO:00063833 | Esophagus | ESCC | transcription by RNA polymerase III | 41/8552 | 46/18723 | 7.69e-10 | 1.90e-08 | 41 |
| GO:00987812 | Esophagus | ESCC | ncRNA transcription | 45/8552 | 56/18723 | 1.05e-07 | 1.72e-06 | 45 |
| GO:000635211 | Esophagus | ESCC | DNA-templated transcription, initiation | 86/8552 | 130/18723 | 1.88e-06 | 2.19e-05 | 86 |
| GO:00093011 | Esophagus | ESCC | snRNA transcription | 16/8552 | 19/18723 | 6.45e-04 | 3.43e-03 | 16 |
| GO:00427951 | Esophagus | ESCC | snRNA transcription by RNA polymerase II | 13/8552 | 16/18723 | 4.05e-03 | 1.62e-02 | 13 |
| GO:0006352 | Liver | HCC | DNA-templated transcription, initiation | 78/7958 | 130/18723 | 4.19e-05 | 4.11e-04 | 78 |
| GO:0006383 | Liver | HCC | transcription by RNA polymerase III | 31/7958 | 46/18723 | 5.67e-04 | 3.61e-03 | 31 |
| GO:0098781 | Liver | HCC | ncRNA transcription | 33/7958 | 56/18723 | 9.64e-03 | 3.63e-02 | 33 |
| GO:00063832 | Oral cavity | OSCC | transcription by RNA polymerase III | 34/7305 | 46/18723 | 1.61e-06 | 2.11e-05 | 34 |
| GO:00987811 | Oral cavity | OSCC | ncRNA transcription | 38/7305 | 56/18723 | 1.15e-05 | 1.18e-04 | 38 |
| GO:00063522 | Oral cavity | OSCC | DNA-templated transcription, initiation | 74/7305 | 130/18723 | 2.56e-05 | 2.39e-04 | 74 |
| GO:0009301 | Oral cavity | OSCC | snRNA transcription | 13/7305 | 19/18723 | 9.07e-03 | 3.26e-02 | 13 |
| GO:0042795 | Oral cavity | OSCC | snRNA transcription by RNA polymerase II | 11/7305 | 16/18723 | 1.56e-02 | 4.99e-02 | 11 |
| GO:00063831 | Oral cavity | LP | transcription by RNA polymerase III | 20/4623 | 46/18723 | 4.03e-03 | 2.61e-02 | 20 |
| GO:00063521 | Oral cavity | LP | DNA-templated transcription, initiation | 45/4623 | 130/18723 | 7.03e-03 | 3.96e-02 | 45 |
| GO:000635212 | Skin | cSCC | DNA-templated transcription, initiation | 57/4864 | 130/18723 | 7.28e-06 | 1.01e-04 | 57 |
| GO:00987813 | Skin | cSCC | ncRNA transcription | 28/4864 | 56/18723 | 9.93e-05 | 9.22e-04 | 28 |
| GO:00063834 | Skin | cSCC | transcription by RNA polymerase III | 20/4864 | 46/18723 | 7.44e-03 | 3.50e-02 | 20 |
| Page: 1 |
| Pathway ID | Tissue | Disease Stage | Description | Gene Ratio | Bg Ratio | pvalue | p.adjust | qvalue | Count |
| Page: 1 |
Top |
Cell-cell communication analysis |
| Identification of potential cell-cell interactions between two cell types and their ligand-receptor pairs for different disease states |
| Ligand | Receptor | LRpair | Pathway | Tissue | Disease Stage |
| Page: 1 |
Top |
Single-cell gene regulatory network inference analysis |
| Find out the significant the regulons (TFs) and the target genes of each regulon across cell types for different disease states |
| TF | Cell Type | Tissue | Disease Stage | Target Gene | RSS | Regulon Activity |
| ∗The dot plots of a searched regulon are shown for all cell subpopulations in each disease state of each tissue based on the regulon specific score inferred using pySCENIC and by calculating the average expression. |
| Page: 1 |
Top |
Somatic mutation of malignant transformation related genes |
| Annotation of somatic variants for genes involved in malignant transformation |
| Hugo Symbol | Variant Class | Variant Classification | dbSNP RS | HGVSc | HGVSp | HGVSp Short | SWISSPROT | BIOTYPE | SIFT | PolyPhen | Tumor Sample Barcode | Tissue | Histology | Sex | Age | Stage | Therapy Types | Drugs | Outcome |
| SNAPC5 | SNV | Missense_Mutation | c.31N>A | p.Glu11Lys | p.E11K | O75971 | protein_coding | deleterious(0) | probably_damaging(0.99) | TCGA-JX-A3Q0-01 | Cervix | cervical & endocervical cancer | Female | <65 | III/IV | Unknown | Unknown | SD | |
| SNAPC5 | insertion | Frame_Shift_Ins | novel | c.16_17insTCGGG | p.Gln6LeufsTer15 | p.Q6Lfs*15 | O75971 | protein_coding | TCGA-AM-5820-01 | Colorectum | colon adenocarcinoma | Female | <65 | I/II | Unknown | Unknown | SD | ||
| SNAPC5 | SNV | Missense_Mutation | rs144538572 | c.254N>T | p.Thr85Met | p.T85M | O75971 | protein_coding | tolerated_low_confidence(0.13) | benign(0) | TCGA-AJ-A3EK-01 | Endometrium | uterine corpus endometrioid carcinoma | Female | <65 | I/II | Chemotherapy | carboplatin | CR |
| SNAPC5 | SNV | Missense_Mutation | novel | c.145N>A | p.Leu49Met | p.L49M | O75971 | protein_coding | tolerated_low_confidence(0.23) | benign(0.206) | TCGA-AJ-A3EK-01 | Endometrium | uterine corpus endometrioid carcinoma | Female | <65 | I/II | Chemotherapy | carboplatin | CR |
| SNAPC5 | SNV | Missense_Mutation | rs775846694 | c.160N>A | p.Val54Ile | p.V54I | O75971 | protein_coding | tolerated_low_confidence(0.11) | benign(0.015) | TCGA-AP-A1DK-01 | Endometrium | uterine corpus endometrioid carcinoma | Female | <65 | I/II | Unknown | Unknown | SD |
| SNAPC5 | SNV | Missense_Mutation | c.117G>T | p.Met39Ile | p.M39I | O75971 | protein_coding | tolerated_low_confidence(0.35) | benign(0) | TCGA-BS-A0UF-01 | Endometrium | uterine corpus endometrioid carcinoma | Female | >=65 | I/II | Unknown | Unknown | SD | |
| SNAPC5 | SNV | Missense_Mutation | rs370969546 | c.131G>A | p.Arg44Lys | p.R44K | O75971 | protein_coding | tolerated_low_confidence(0.41) | benign(0) | TCGA-CV-7568-01 | Oral cavity | head & neck squamous cell carcinoma | Female | <65 | I/II | Unknown | Unknown | SD |
| Page: 1 |
Top |
Related drugs of malignant transformation related genes |
| Identification of chemicals and drugs interact with genes involved in malignant transfromation |
| (DGIdb 4.0) |
| Entrez ID | Symbol | Category | Interaction Types | Drug Claim Name | Drug Name | PMIDs |
| Page: 1 |

Copyright 2023-Present -The University of Texas Health Science Center at Houston |