
|
|||||
|
 | |
| |
| |
| |
| |
| |
|
Gene: SNAPC3 |
Gene summary for SNAPC3 |
| Gene information | Species | Human | Gene symbol | SNAPC3 | Gene ID | 6619 |
| Gene name | small nuclear RNA activating complex polypeptide 3 | |
| Gene Alias | PTFbeta | |
| Cytomap | 9p22.3 | |
| Gene Type | protein-coding | GO ID | GO:0006139 | UniProtAcc | Q92966 |
Top |
Malignant transformation analysis |
| Identification of the aberrant gene expression in precancerous and cancerous lesions by comparing the gene expression of stem-like cells in diseased tissues with normal stem cells |
| Entrez ID | Symbol | Replicates | Species | Organ | Tissue | Adj P-value | Log2FC | Malignancy |
| 6619 | SNAPC3 | HTA11_3410_2000001011 | Human | Colorectum | AD | 3.94e-06 | -3.75e-01 | 0.0155 |
| 6619 | SNAPC3 | HTA11_3361_2000001011 | Human | Colorectum | AD | 2.01e-02 | -3.93e-01 | -0.1207 |
| 6619 | SNAPC3 | HTA11_99999974143_84620 | Human | Colorectum | MSS | 4.44e-11 | -4.55e-01 | 0.3005 |
| 6619 | SNAPC3 | F007 | Human | Colorectum | FAP | 3.54e-02 | -3.41e-01 | 0.1176 |
| 6619 | SNAPC3 | A001-C-207 | Human | Colorectum | FAP | 3.40e-05 | -3.45e-01 | 0.1278 |
| 6619 | SNAPC3 | A015-C-203 | Human | Colorectum | FAP | 5.94e-28 | -4.65e-01 | -0.1294 |
| 6619 | SNAPC3 | A015-C-204 | Human | Colorectum | FAP | 5.74e-07 | -4.16e-01 | -0.0228 |
| 6619 | SNAPC3 | A014-C-040 | Human | Colorectum | FAP | 3.88e-03 | -4.31e-01 | -0.1184 |
| 6619 | SNAPC3 | A002-C-201 | Human | Colorectum | FAP | 1.70e-12 | -4.06e-01 | 0.0324 |
| 6619 | SNAPC3 | A002-C-203 | Human | Colorectum | FAP | 2.55e-05 | -2.78e-01 | 0.2786 |
| 6619 | SNAPC3 | A001-C-119 | Human | Colorectum | FAP | 7.45e-09 | -4.63e-01 | -0.1557 |
| 6619 | SNAPC3 | A001-C-108 | Human | Colorectum | FAP | 1.05e-15 | -3.46e-01 | -0.0272 |
| 6619 | SNAPC3 | A002-C-205 | Human | Colorectum | FAP | 1.66e-18 | -4.77e-01 | -0.1236 |
| 6619 | SNAPC3 | A001-C-104 | Human | Colorectum | FAP | 3.35e-10 | -3.75e-01 | 0.0184 |
| 6619 | SNAPC3 | A015-C-005 | Human | Colorectum | FAP | 1.34e-02 | -2.77e-01 | -0.0336 |
| 6619 | SNAPC3 | A015-C-006 | Human | Colorectum | FAP | 3.19e-14 | -4.64e-01 | -0.0994 |
| 6619 | SNAPC3 | A015-C-106 | Human | Colorectum | FAP | 3.86e-16 | -4.40e-01 | -0.0511 |
| 6619 | SNAPC3 | A002-C-114 | Human | Colorectum | FAP | 3.42e-20 | -5.83e-01 | -0.1561 |
| 6619 | SNAPC3 | A015-C-104 | Human | Colorectum | FAP | 1.00e-22 | -4.55e-01 | -0.1899 |
| 6619 | SNAPC3 | A001-C-014 | Human | Colorectum | FAP | 1.84e-16 | -3.72e-01 | 0.0135 |
| Page: 1 2 3 4 5 6 |
| Tissue | Expression Dynamics | Abbreviation |
| Colorectum (GSE201348) |  | FAP: Familial adenomatous polyposis |
| CRC: Colorectal cancer | ||
| Colorectum (HTA11) |  | AD: Adenomas |
| SER: Sessile serrated lesions | ||
| MSI-H: Microsatellite-high colorectal cancer | ||
| MSS: Microsatellite stable colorectal cancer | ||
| Esophagus | 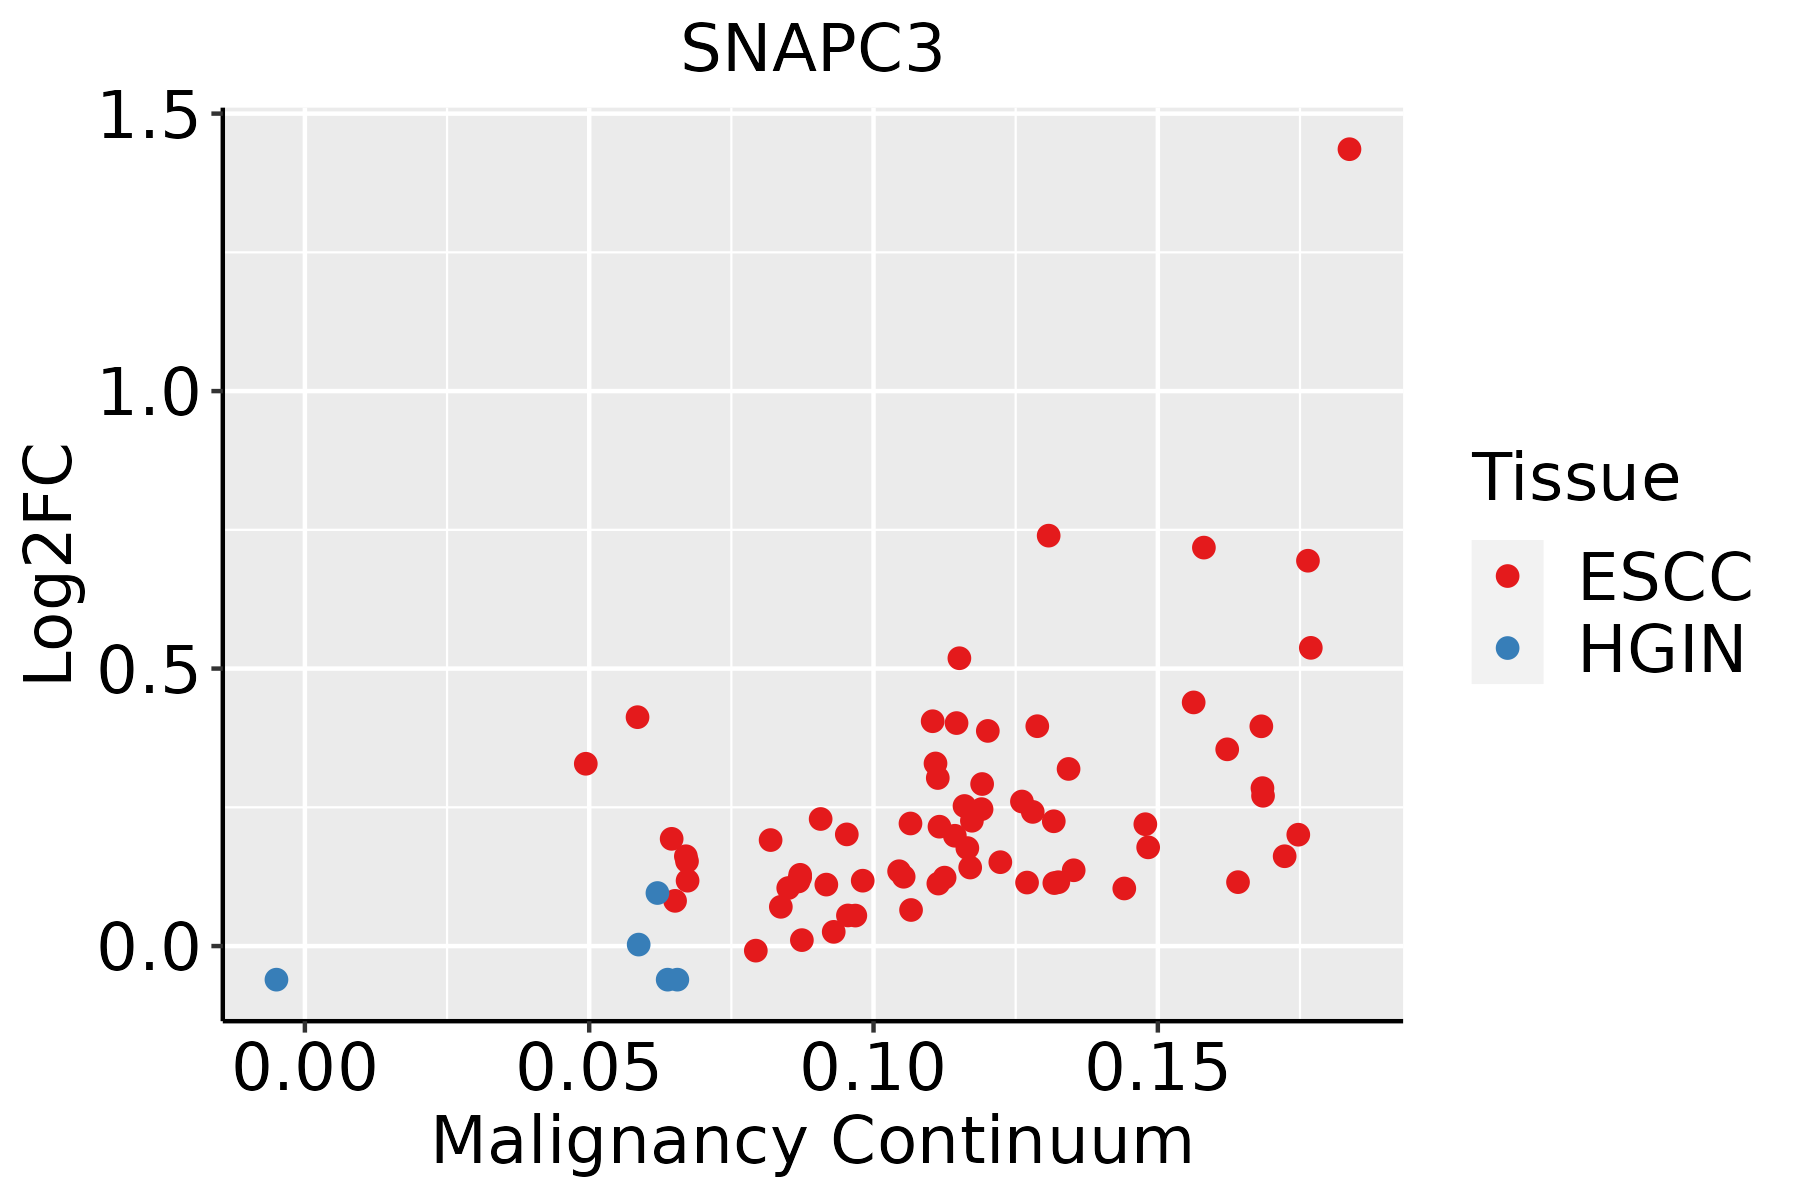 | ESCC: Esophageal squamous cell carcinoma |
| HGIN: High-grade intraepithelial neoplasias | ||
| LGIN: Low-grade intraepithelial neoplasias | ||
| Oral Cavity |  | EOLP: Erosive Oral lichen planus |
| LP: leukoplakia | ||
| NEOLP: Non-erosive oral lichen planus | ||
| OSCC: Oral squamous cell carcinoma | ||
| Thyroid |  | ATC: Anaplastic thyroid cancer |
| HT: Hashimoto's thyroiditis | ||
| PTC: Papillary thyroid cancer |
| ∗log2FC in expression of this searched gene in stem-like cells from each diseased tissue sample relative to stem-like cells in normal samples in each tissue plotted against the malignancy continuum. Samples are colored based on if they are from different disease stage. |
Top |
Malignant transformation related pathway analysis |
| Find out the enriched GO biological processes and KEGG pathways involved in transition from healthy to precancer to cancer |
| Tissue | Disease Stage | Enriched GO biological Processes |
| Colorectum | AD |  |
| Colorectum | SER |  |
| Colorectum | MSS |  |
| Colorectum | MSI-H |  |
| Colorectum | FAP |  |
| ∗Top 15 enriched GO BP terms are showed in the bar plot of each disease state in each tissue. Each row represents a significant GO biological process which is colored according to the -log10(p.adjust). |
| Page: 1 2 3 4 5 6 7 8 9 |
| GO ID | Tissue | Disease Stage | Description | Gene Ratio | Bg Ratio | pvalue | p.adjust | Count |
| GO:00063833 | Esophagus | ESCC | transcription by RNA polymerase III | 41/8552 | 46/18723 | 7.69e-10 | 1.90e-08 | 41 |
| GO:00987812 | Esophagus | ESCC | ncRNA transcription | 45/8552 | 56/18723 | 1.05e-07 | 1.72e-06 | 45 |
| GO:00093011 | Esophagus | ESCC | snRNA transcription | 16/8552 | 19/18723 | 6.45e-04 | 3.43e-03 | 16 |
| GO:00427951 | Esophagus | ESCC | snRNA transcription by RNA polymerase II | 13/8552 | 16/18723 | 4.05e-03 | 1.62e-02 | 13 |
| GO:00063832 | Oral cavity | OSCC | transcription by RNA polymerase III | 34/7305 | 46/18723 | 1.61e-06 | 2.11e-05 | 34 |
| GO:00987811 | Oral cavity | OSCC | ncRNA transcription | 38/7305 | 56/18723 | 1.15e-05 | 1.18e-04 | 38 |
| GO:0009301 | Oral cavity | OSCC | snRNA transcription | 13/7305 | 19/18723 | 9.07e-03 | 3.26e-02 | 13 |
| GO:0042795 | Oral cavity | OSCC | snRNA transcription by RNA polymerase II | 11/7305 | 16/18723 | 1.56e-02 | 4.99e-02 | 11 |
| GO:00987814 | Thyroid | PTC | ncRNA transcription | 27/5968 | 56/18723 | 7.77e-03 | 3.29e-02 | 27 |
| GO:00063835 | Thyroid | PTC | transcription by RNA polymerase III | 23/5968 | 46/18723 | 7.89e-03 | 3.33e-02 | 23 |
| Page: 1 |
| Pathway ID | Tissue | Disease Stage | Description | Gene Ratio | Bg Ratio | pvalue | p.adjust | qvalue | Count |
| Page: 1 |
Top |
Cell-cell communication analysis |
| Identification of potential cell-cell interactions between two cell types and their ligand-receptor pairs for different disease states |
| Ligand | Receptor | LRpair | Pathway | Tissue | Disease Stage |
| Page: 1 |
Top |
Single-cell gene regulatory network inference analysis |
| Find out the significant the regulons (TFs) and the target genes of each regulon across cell types for different disease states |
| TF | Cell Type | Tissue | Disease Stage | Target Gene | RSS | Regulon Activity |
| ∗The dot plots of a searched regulon are shown for all cell subpopulations in each disease state of each tissue based on the regulon specific score inferred using pySCENIC and by calculating the average expression. |
| Page: 1 |
Top |
Somatic mutation of malignant transformation related genes |
| Annotation of somatic variants for genes involved in malignant transformation |
| Hugo Symbol | Variant Class | Variant Classification | dbSNP RS | HGVSc | HGVSp | HGVSp Short | SWISSPROT | BIOTYPE | SIFT | PolyPhen | Tumor Sample Barcode | Tissue | Histology | Sex | Age | Stage | Therapy Types | Drugs | Outcome |
| SNAPC3 | SNV | Missense_Mutation | c.533N>A | p.Gly178Glu | p.G178E | Q92966 | protein_coding | deleterious(0.01) | probably_damaging(0.988) | TCGA-AN-A0FF-01 | Breast | breast invasive carcinoma | Female | <65 | I/II | Unknown | Unknown | SD | |
| SNAPC3 | SNV | Missense_Mutation | rs753910525 | c.784N>G | p.Lys262Glu | p.K262E | Q92966 | protein_coding | tolerated(0.59) | benign(0.082) | TCGA-B6-A0X1-01 | Breast | breast invasive carcinoma | Female | <65 | I/II | Unknown | Unknown | PD |
| SNAPC3 | SNV | Missense_Mutation | novel | c.386N>G | p.Thr129Ser | p.T129S | Q92966 | protein_coding | deleterious(0.03) | probably_damaging(0.997) | TCGA-E2-A2P5-01 | Breast | breast invasive carcinoma | Female | >=65 | III/IV | Hormone Therapy | arimidex | PD |
| SNAPC3 | insertion | In_Frame_Ins | novel | c.896_897insCAGCCTCTGCCTTCCAGTTTCAAGCGATTCTCC | p.Asn299_Asp300insSerLeuCysLeuProValSerSerAspSerPro | p.N299_D300insSLCLPVSSDSP | Q92966 | protein_coding | TCGA-A8-A07U-01 | Breast | breast invasive carcinoma | Female | >=65 | III/IV | Chemotherapy | 5-fluorouracil | SD | ||
| SNAPC3 | SNV | Missense_Mutation | novel | c.1013C>T | p.Thr338Ile | p.T338I | Q92966 | protein_coding | tolerated(0.08) | possibly_damaging(0.596) | TCGA-C5-A2LZ-01 | Cervix | cervical & endocervical cancer | Female | >=65 | III/IV | Unknown | Unknown | PD |
| SNAPC3 | SNV | Missense_Mutation | c.160C>A | p.Arg54Ser | p.R54S | Q92966 | protein_coding | deleterious(0.04) | benign(0.312) | TCGA-Q1-A73O-01 | Cervix | cervical & endocervical cancer | Female | <65 | I/II | Chemotherapy | cisplatin | CR | |
| SNAPC3 | SNV | Missense_Mutation | novel | c.136G>T | p.Ala46Ser | p.A46S | Q92966 | protein_coding | tolerated(0.74) | benign(0.001) | TCGA-AA-3844-01 | Colorectum | colon adenocarcinoma | Female | >=65 | III/IV | Chemotherapy | capecitabine | PD |
| SNAPC3 | SNV | Missense_Mutation | novel | c.1220C>A | p.Pro407His | p.P407H | Q92966 | protein_coding | deleterious(0.01) | probably_damaging(0.983) | TCGA-AA-3950-01 | Colorectum | colon adenocarcinoma | Female | >=65 | I/II | Unknown | Unknown | SD |
| SNAPC3 | SNV | Missense_Mutation | c.463N>C | p.Phe155Leu | p.F155L | Q92966 | protein_coding | tolerated(0.23) | benign(0.001) | TCGA-AA-3966-01 | Colorectum | colon adenocarcinoma | Female | >=65 | I/II | Unknown | Unknown | SD | |
| SNAPC3 | SNV | Missense_Mutation | rs763542697 | c.418N>T | p.Arg140Trp | p.R140W | Q92966 | protein_coding | deleterious(0) | probably_damaging(0.97) | TCGA-CK-4951-01 | Colorectum | colon adenocarcinoma | Female | >=65 | I/II | Unknown | Unknown | PD |
| Page: 1 2 3 4 |
Top |
Related drugs of malignant transformation related genes |
| Identification of chemicals and drugs interact with genes involved in malignant transfromation |
| (DGIdb 4.0) |
| Entrez ID | Symbol | Category | Interaction Types | Drug Claim Name | Drug Name | PMIDs |
| Page: 1 |

Copyright 2023-Present -The University of Texas Health Science Center at Houston |