
|
|||||
|
 | |
| |
| |
| |
| |
| |
|
Gene: SNAPC2 |
Gene summary for SNAPC2 |
| Gene information | Species | Human | Gene symbol | SNAPC2 | Gene ID | 6618 |
| Gene name | small nuclear RNA activating complex polypeptide 2 | |
| Gene Alias | PTFDELTA | |
| Cytomap | 19p13.2 | |
| Gene Type | protein-coding | GO ID | GO:0006139 | UniProtAcc | Q13487 |
Top |
Malignant transformation analysis |
| Identification of the aberrant gene expression in precancerous and cancerous lesions by comparing the gene expression of stem-like cells in diseased tissues with normal stem cells |
| Entrez ID | Symbol | Replicates | Species | Organ | Tissue | Adj P-value | Log2FC | Malignancy |
| 6618 | SNAPC2 | LZE7T | Human | Esophagus | ESCC | 4.19e-02 | 1.36e-01 | 0.0667 |
| 6618 | SNAPC2 | LZE8T | Human | Esophagus | ESCC | 4.33e-04 | 4.80e-02 | 0.067 |
| 6618 | SNAPC2 | LZE24T | Human | Esophagus | ESCC | 6.52e-12 | 2.12e-01 | 0.0596 |
| 6618 | SNAPC2 | P1T-E | Human | Esophagus | ESCC | 1.02e-06 | 1.29e-01 | 0.0875 |
| 6618 | SNAPC2 | P2T-E | Human | Esophagus | ESCC | 1.36e-17 | 1.80e-01 | 0.1177 |
| 6618 | SNAPC2 | P4T-E | Human | Esophagus | ESCC | 3.17e-11 | 4.09e-01 | 0.1323 |
| 6618 | SNAPC2 | P5T-E | Human | Esophagus | ESCC | 2.86e-13 | 1.61e-01 | 0.1327 |
| 6618 | SNAPC2 | P8T-E | Human | Esophagus | ESCC | 2.67e-11 | 1.45e-01 | 0.0889 |
| 6618 | SNAPC2 | P9T-E | Human | Esophagus | ESCC | 1.21e-12 | 3.75e-01 | 0.1131 |
| 6618 | SNAPC2 | P10T-E | Human | Esophagus | ESCC | 2.21e-27 | 4.17e-01 | 0.116 |
| 6618 | SNAPC2 | P11T-E | Human | Esophagus | ESCC | 5.68e-14 | 5.22e-01 | 0.1426 |
| 6618 | SNAPC2 | P12T-E | Human | Esophagus | ESCC | 1.74e-18 | 4.39e-01 | 0.1122 |
| 6618 | SNAPC2 | P15T-E | Human | Esophagus | ESCC | 3.54e-18 | 3.41e-01 | 0.1149 |
| 6618 | SNAPC2 | P16T-E | Human | Esophagus | ESCC | 8.41e-13 | 1.92e-01 | 0.1153 |
| 6618 | SNAPC2 | P17T-E | Human | Esophagus | ESCC | 4.93e-10 | 3.26e-01 | 0.1278 |
| 6618 | SNAPC2 | P19T-E | Human | Esophagus | ESCC | 2.75e-05 | 3.04e-01 | 0.1662 |
| 6618 | SNAPC2 | P20T-E | Human | Esophagus | ESCC | 1.66e-15 | 2.49e-01 | 0.1124 |
| 6618 | SNAPC2 | P21T-E | Human | Esophagus | ESCC | 1.26e-25 | 4.01e-01 | 0.1617 |
| 6618 | SNAPC2 | P22T-E | Human | Esophagus | ESCC | 6.12e-24 | 2.90e-01 | 0.1236 |
| 6618 | SNAPC2 | P23T-E | Human | Esophagus | ESCC | 4.79e-18 | 3.19e-01 | 0.108 |
| Page: 1 2 3 4 5 |
| Tissue | Expression Dynamics | Abbreviation |
| Esophagus | 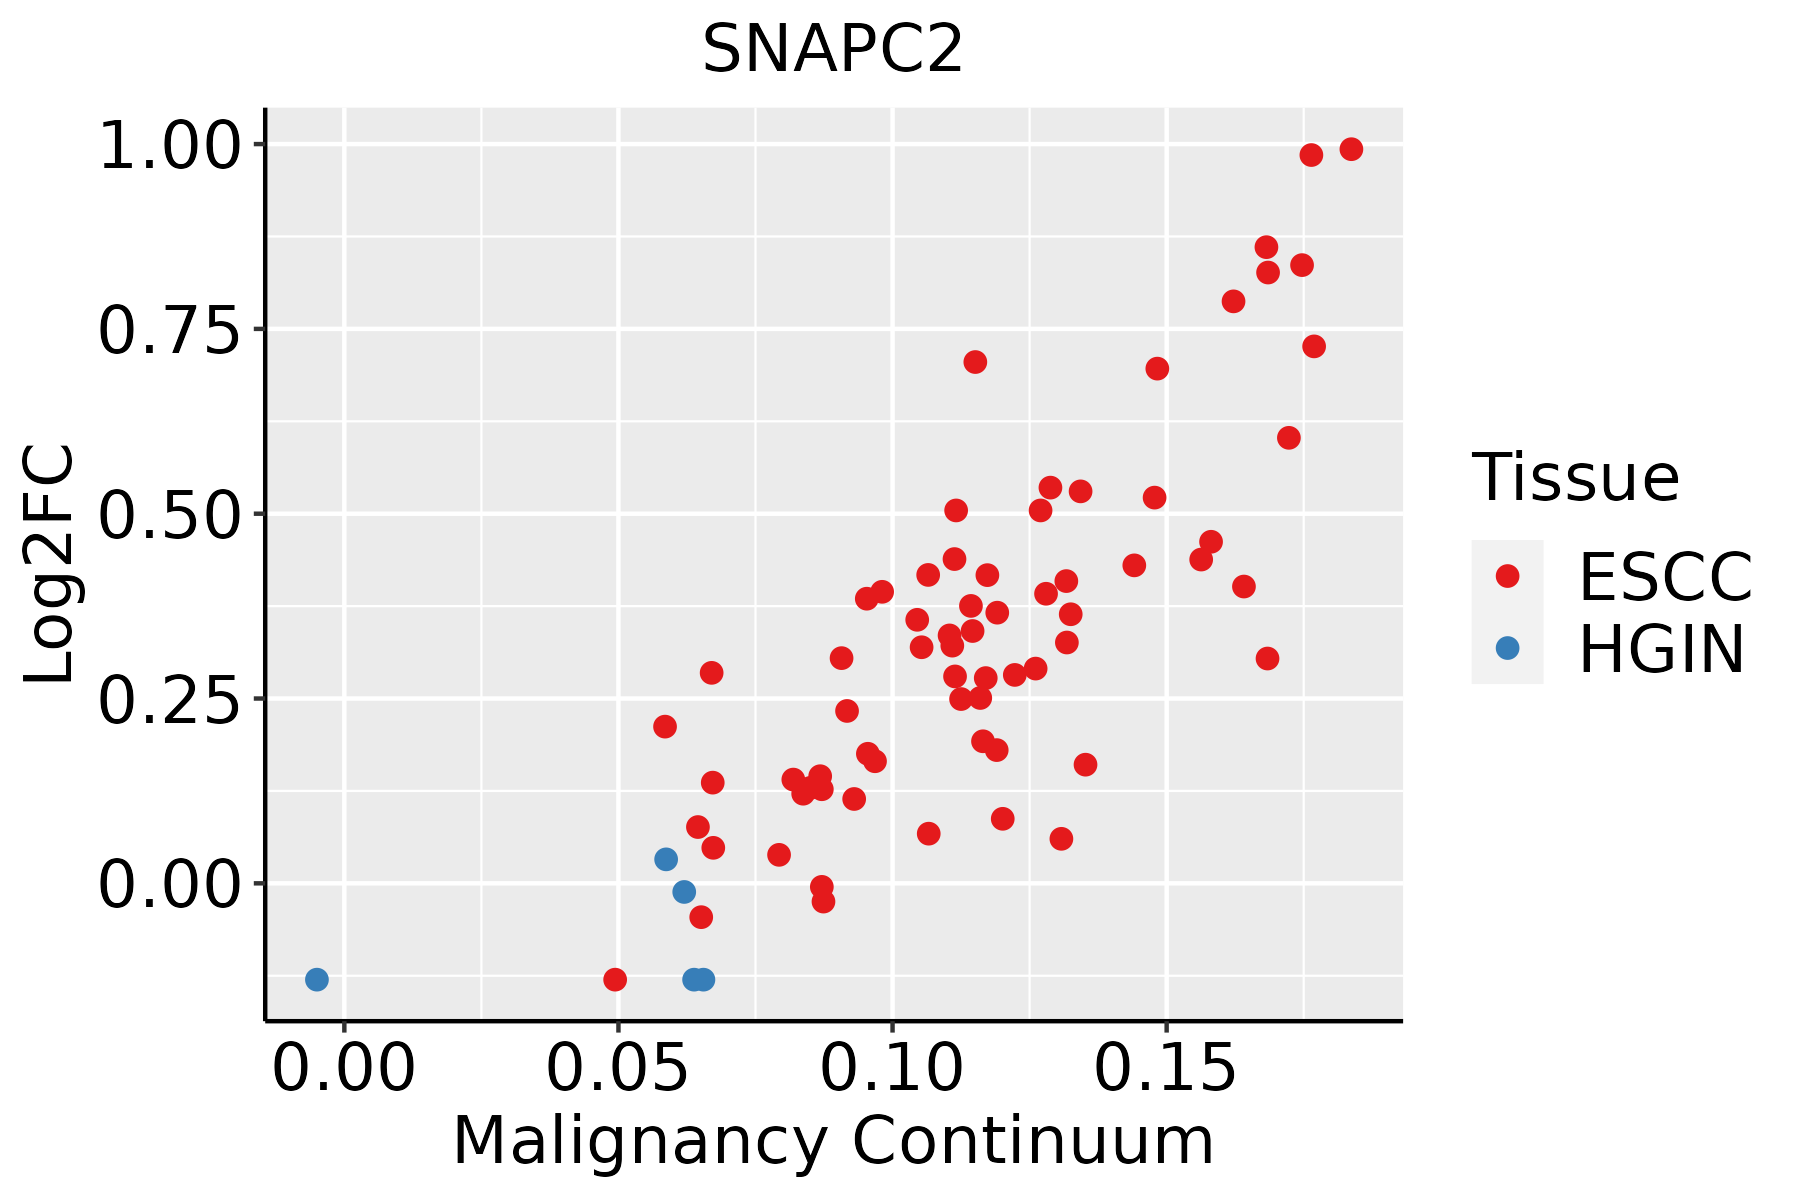 | ESCC: Esophageal squamous cell carcinoma |
| HGIN: High-grade intraepithelial neoplasias | ||
| LGIN: Low-grade intraepithelial neoplasias | ||
| Oral Cavity | 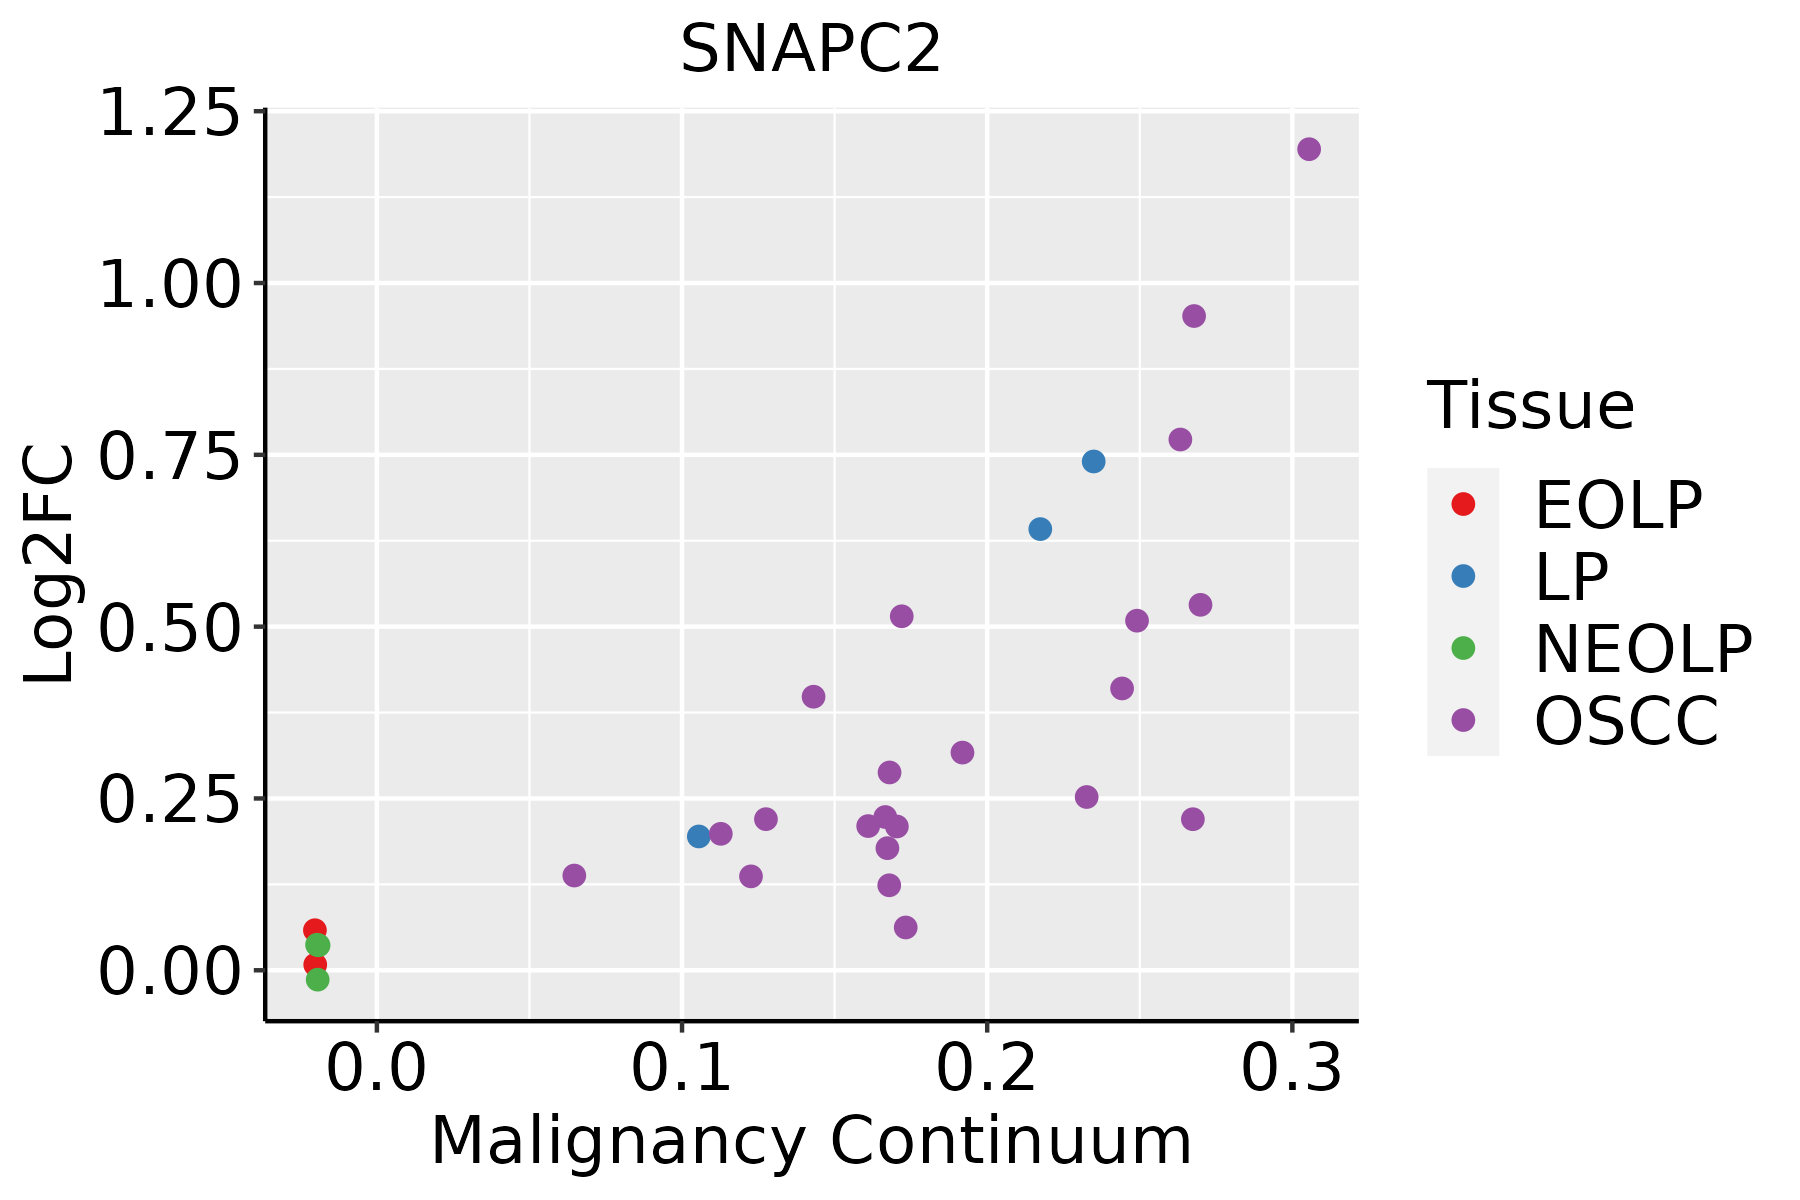 | EOLP: Erosive Oral lichen planus |
| LP: leukoplakia | ||
| NEOLP: Non-erosive oral lichen planus | ||
| OSCC: Oral squamous cell carcinoma | ||
| Thyroid | 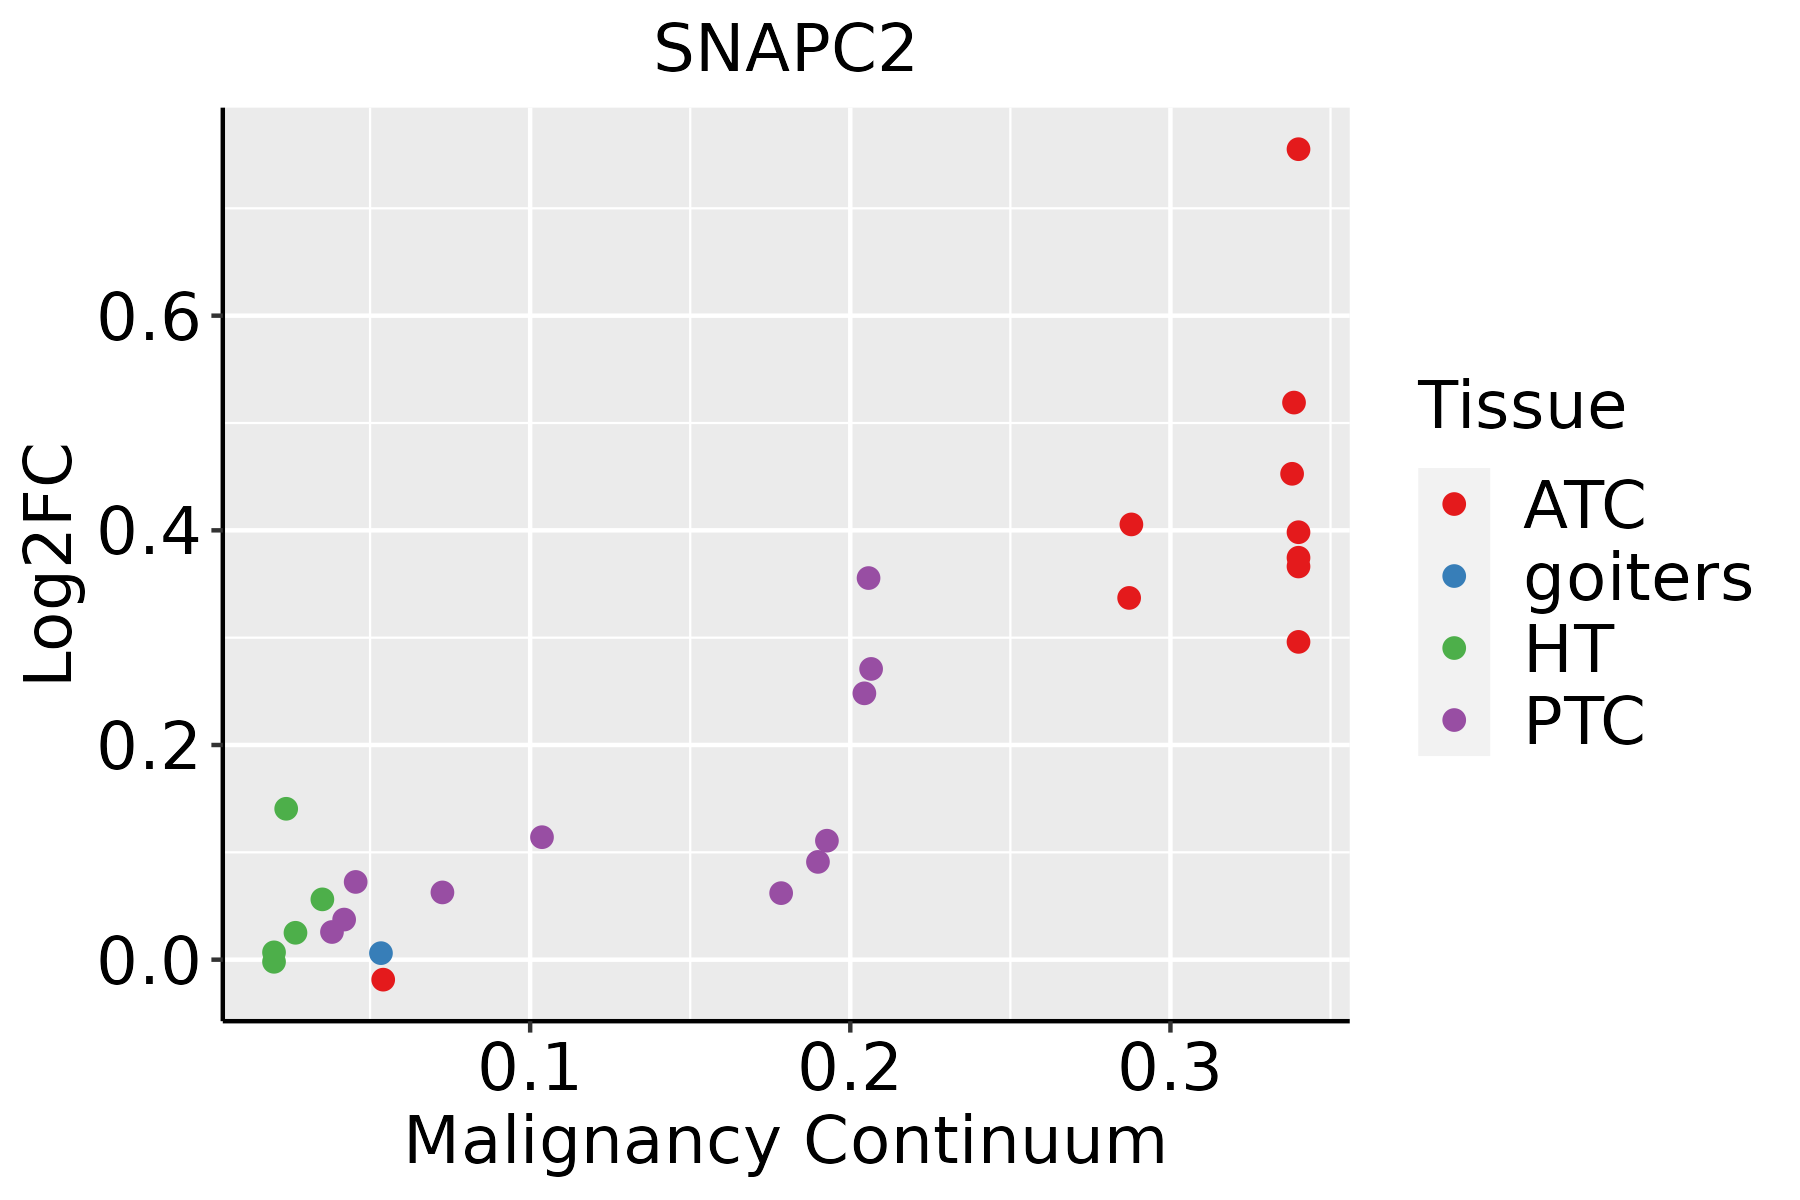 | ATC: Anaplastic thyroid cancer |
| HT: Hashimoto's thyroiditis | ||
| PTC: Papillary thyroid cancer |
| ∗log2FC in expression of this searched gene in stem-like cells from each diseased tissue sample relative to stem-like cells in normal samples in each tissue plotted against the malignancy continuum. Samples are colored based on if they are from different disease stage. |
Top |
Malignant transformation related pathway analysis |
| Find out the enriched GO biological processes and KEGG pathways involved in transition from healthy to precancer to cancer |
| Tissue | Disease Stage | Enriched GO biological Processes |
| Colorectum | AD |  |
| Colorectum | SER |  |
| Colorectum | MSS |  |
| Colorectum | MSI-H |  |
| Colorectum | FAP |  |
| ∗Top 15 enriched GO BP terms are showed in the bar plot of each disease state in each tissue. Each row represents a significant GO biological process which is colored according to the -log10(p.adjust). |
| Page: 1 2 3 4 5 6 7 8 9 |
| GO ID | Tissue | Disease Stage | Description | Gene Ratio | Bg Ratio | pvalue | p.adjust | Count |
| GO:00063833 | Esophagus | ESCC | transcription by RNA polymerase III | 41/8552 | 46/18723 | 7.69e-10 | 1.90e-08 | 41 |
| GO:00987812 | Esophagus | ESCC | ncRNA transcription | 45/8552 | 56/18723 | 1.05e-07 | 1.72e-06 | 45 |
| GO:00093011 | Esophagus | ESCC | snRNA transcription | 16/8552 | 19/18723 | 6.45e-04 | 3.43e-03 | 16 |
| GO:00063832 | Oral cavity | OSCC | transcription by RNA polymerase III | 34/7305 | 46/18723 | 1.61e-06 | 2.11e-05 | 34 |
| GO:00987811 | Oral cavity | OSCC | ncRNA transcription | 38/7305 | 56/18723 | 1.15e-05 | 1.18e-04 | 38 |
| GO:0009301 | Oral cavity | OSCC | snRNA transcription | 13/7305 | 19/18723 | 9.07e-03 | 3.26e-02 | 13 |
| GO:00063831 | Oral cavity | LP | transcription by RNA polymerase III | 20/4623 | 46/18723 | 4.03e-03 | 2.61e-02 | 20 |
| GO:00987814 | Thyroid | PTC | ncRNA transcription | 27/5968 | 56/18723 | 7.77e-03 | 3.29e-02 | 27 |
| GO:00063835 | Thyroid | PTC | transcription by RNA polymerase III | 23/5968 | 46/18723 | 7.89e-03 | 3.33e-02 | 23 |
| Page: 1 |
| Pathway ID | Tissue | Disease Stage | Description | Gene Ratio | Bg Ratio | pvalue | p.adjust | qvalue | Count |
| Page: 1 |
Top |
Cell-cell communication analysis |
| Identification of potential cell-cell interactions between two cell types and their ligand-receptor pairs for different disease states |
| Ligand | Receptor | LRpair | Pathway | Tissue | Disease Stage |
| Page: 1 |
Top |
Single-cell gene regulatory network inference analysis |
| Find out the significant the regulons (TFs) and the target genes of each regulon across cell types for different disease states |
| TF | Cell Type | Tissue | Disease Stage | Target Gene | RSS | Regulon Activity |
| ∗The dot plots of a searched regulon are shown for all cell subpopulations in each disease state of each tissue based on the regulon specific score inferred using pySCENIC and by calculating the average expression. |
| Page: 1 |
Top |
Somatic mutation of malignant transformation related genes |
| Annotation of somatic variants for genes involved in malignant transformation |
| Hugo Symbol | Variant Class | Variant Classification | dbSNP RS | HGVSc | HGVSp | HGVSp Short | SWISSPROT | BIOTYPE | SIFT | PolyPhen | Tumor Sample Barcode | Tissue | Histology | Sex | Age | Stage | Therapy Types | Drugs | Outcome |
| SNAPC2 | SNV | Missense_Mutation | c.905N>A | p.Ser302Asn | p.S302N | Q13487 | protein_coding | tolerated(0.16) | benign(0.062) | TCGA-DS-A0VL-01 | Cervix | cervical & endocervical cancer | Female | <65 | I/II | Unknown | Unknown | SD | |
| SNAPC2 | SNV | Missense_Mutation | rs763108181 | c.677N>T | p.Ser226Leu | p.S226L | Q13487 | protein_coding | deleterious(0) | probably_damaging(0.999) | TCGA-VS-A8EI-01 | Cervix | cervical & endocervical cancer | Female | <65 | I/II | Chemotherapy | cisplatin | CR |
| SNAPC2 | SNV | Missense_Mutation | novel | c.751N>A | p.Ala251Thr | p.A251T | Q13487 | protein_coding | tolerated(0.07) | benign(0.043) | TCGA-ZJ-AAX4-01 | Cervix | cervical & endocervical cancer | Female | >=65 | I/II | Unknown | Unknown | SD |
| SNAPC2 | SNV | Missense_Mutation | c.659G>A | p.Gly220Asp | p.G220D | Q13487 | protein_coding | tolerated(0.35) | probably_damaging(0.977) | TCGA-AA-3977-01 | Colorectum | colon adenocarcinoma | Male | >=65 | I/II | Unknown | Unknown | SD | |
| SNAPC2 | SNV | Missense_Mutation | c.797N>A | p.Pro266His | p.P266H | Q13487 | protein_coding | deleterious(0) | probably_damaging(1) | TCGA-D5-6928-01 | Colorectum | colon adenocarcinoma | Male | >=65 | I/II | Unknown | Unknown | SD | |
| SNAPC2 | SNV | Missense_Mutation | c.934N>C | p.Gly312Arg | p.G312R | Q13487 | protein_coding | deleterious(0) | probably_damaging(0.988) | TCGA-EI-6514-01 | Colorectum | rectum adenocarcinoma | Female | <65 | I/II | Chemotherapy | 5-fu | SD | |
| SNAPC2 | SNV | Missense_Mutation | rs745524032 | c.703G>A | p.Asp235Asn | p.D235N | Q13487 | protein_coding | tolerated(0.1) | benign(0.242) | TCGA-F5-6814-01 | Colorectum | rectum adenocarcinoma | Male | <65 | I/II | Unknown | Unknown | SD |
| SNAPC2 | deletion | Frame_Shift_Del | rs769564442 | c.794delN | p.Gln267SerfsTer38 | p.Q267Sfs*38 | Q13487 | protein_coding | TCGA-AD-6889-01 | Colorectum | colon adenocarcinoma | Male | >=65 | I/II | Chemotherapy | xeloda | PD | ||
| SNAPC2 | SNV | Missense_Mutation | novel | c.621G>T | p.Glu207Asp | p.E207D | Q13487 | protein_coding | tolerated(0.06) | probably_damaging(0.998) | TCGA-A5-A0G2-01 | Endometrium | uterine corpus endometrioid carcinoma | Female | <65 | III/IV | Unknown | Unknown | SD |
| SNAPC2 | SNV | Missense_Mutation | rs768225274 | c.575C>T | p.Ser192Leu | p.S192L | Q13487 | protein_coding | deleterious(0.01) | possibly_damaging(0.448) | TCGA-AJ-A3BH-01 | Endometrium | uterine corpus endometrioid carcinoma | Female | Unknown | I/II | Unknown | Unknown | SD |
| Page: 1 2 3 |
Top |
Related drugs of malignant transformation related genes |
| Identification of chemicals and drugs interact with genes involved in malignant transfromation |
| (DGIdb 4.0) |
| Entrez ID | Symbol | Category | Interaction Types | Drug Claim Name | Drug Name | PMIDs |
| Page: 1 |

Copyright 2023-Present -The University of Texas Health Science Center at Houston |