
|
|||||
|
 | |
| |
| |
| |
| |
| |
|
Gene: SNAPC1 |
Gene summary for SNAPC1 |
| Gene information | Species | Human | Gene symbol | SNAPC1 | Gene ID | 6617 |
| Gene name | small nuclear RNA activating complex polypeptide 1 | |
| Gene Alias | PTFgamma | |
| Cytomap | 14q23.2 | |
| Gene Type | protein-coding | GO ID | GO:0006139 | UniProtAcc | B2RC42 |
Top |
Malignant transformation analysis |
| Identification of the aberrant gene expression in precancerous and cancerous lesions by comparing the gene expression of stem-like cells in diseased tissues with normal stem cells |
| Entrez ID | Symbol | Replicates | Species | Organ | Tissue | Adj P-value | Log2FC | Malignancy |
| 6617 | SNAPC1 | LZE4T | Human | Esophagus | ESCC | 5.27e-15 | 1.04e+00 | 0.0811 |
| 6617 | SNAPC1 | LZE8T | Human | Esophagus | ESCC | 4.48e-03 | 3.24e-01 | 0.067 |
| 6617 | SNAPC1 | LZE22D1 | Human | Esophagus | HGIN | 1.19e-04 | 1.82e-02 | 0.0595 |
| 6617 | SNAPC1 | LZE22T | Human | Esophagus | ESCC | 2.07e-03 | 5.95e-01 | 0.068 |
| 6617 | SNAPC1 | LZE24T | Human | Esophagus | ESCC | 6.77e-05 | 3.95e-01 | 0.0596 |
| 6617 | SNAPC1 | LZE21T | Human | Esophagus | ESCC | 1.79e-03 | 2.26e-01 | 0.0655 |
| 6617 | SNAPC1 | P2T-E | Human | Esophagus | ESCC | 4.93e-20 | 3.74e-01 | 0.1177 |
| 6617 | SNAPC1 | P4T-E | Human | Esophagus | ESCC | 2.40e-32 | 1.17e+00 | 0.1323 |
| 6617 | SNAPC1 | P5T-E | Human | Esophagus | ESCC | 3.27e-20 | 5.70e-01 | 0.1327 |
| 6617 | SNAPC1 | P8T-E | Human | Esophagus | ESCC | 4.68e-16 | 3.48e-01 | 0.0889 |
| 6617 | SNAPC1 | P9T-E | Human | Esophagus | ESCC | 6.75e-14 | 3.75e-01 | 0.1131 |
| 6617 | SNAPC1 | P10T-E | Human | Esophagus | ESCC | 7.36e-38 | 1.02e+00 | 0.116 |
| 6617 | SNAPC1 | P11T-E | Human | Esophagus | ESCC | 6.33e-16 | 1.34e+00 | 0.1426 |
| 6617 | SNAPC1 | P12T-E | Human | Esophagus | ESCC | 4.63e-19 | 6.52e-01 | 0.1122 |
| 6617 | SNAPC1 | P15T-E | Human | Esophagus | ESCC | 5.75e-45 | 1.43e+00 | 0.1149 |
| 6617 | SNAPC1 | P16T-E | Human | Esophagus | ESCC | 1.90e-20 | 2.90e-01 | 0.1153 |
| 6617 | SNAPC1 | P17T-E | Human | Esophagus | ESCC | 4.37e-04 | 3.65e-01 | 0.1278 |
| 6617 | SNAPC1 | P20T-E | Human | Esophagus | ESCC | 9.18e-12 | 4.97e-01 | 0.1124 |
| 6617 | SNAPC1 | P21T-E | Human | Esophagus | ESCC | 5.71e-17 | 5.68e-01 | 0.1617 |
| 6617 | SNAPC1 | P22T-E | Human | Esophagus | ESCC | 1.04e-22 | 5.83e-01 | 0.1236 |
| Page: 1 2 3 4 5 6 |
| Tissue | Expression Dynamics | Abbreviation |
| Esophagus |  | ESCC: Esophageal squamous cell carcinoma |
| HGIN: High-grade intraepithelial neoplasias | ||
| LGIN: Low-grade intraepithelial neoplasias | ||
| Liver | 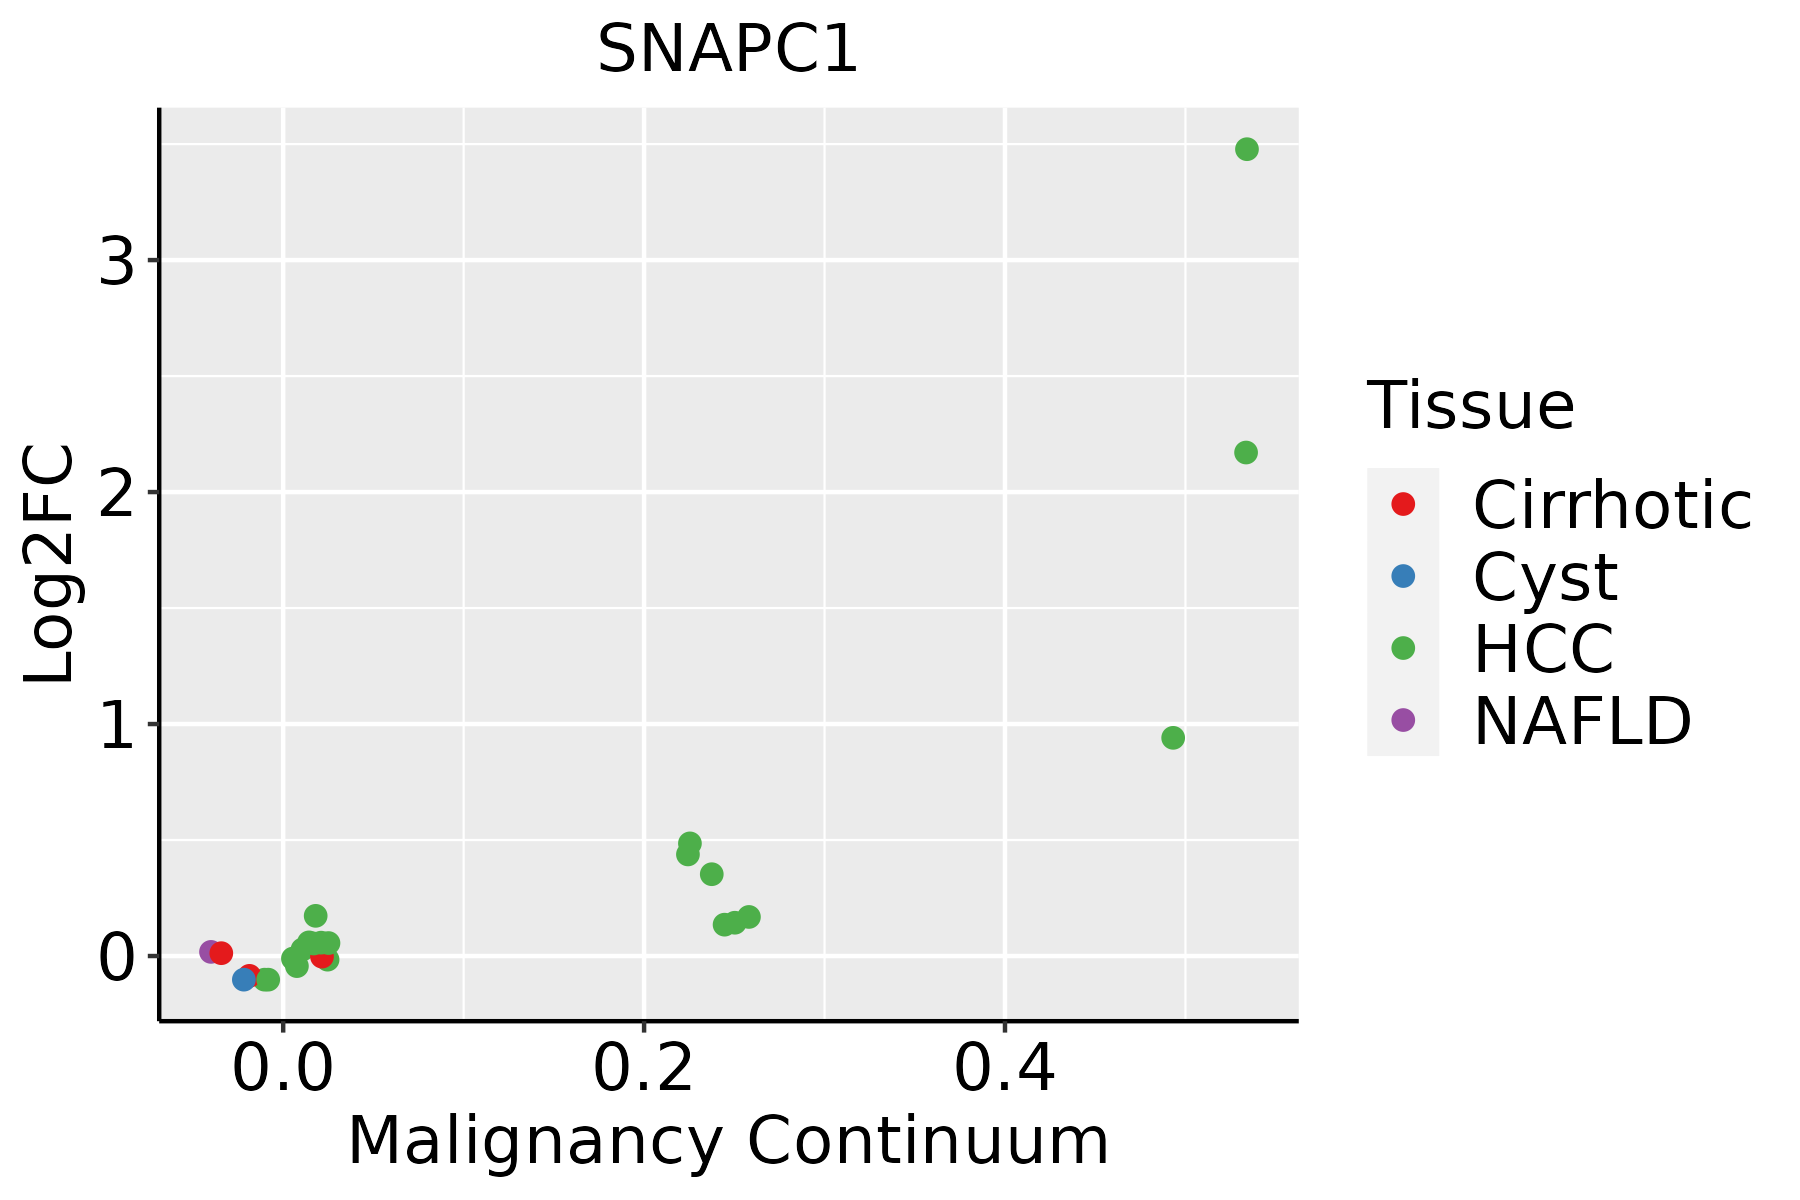 | HCC: Hepatocellular carcinoma |
| NAFLD: Non-alcoholic fatty liver disease | ||
| Lung |  | AAH: Atypical adenomatous hyperplasia |
| AIS: Adenocarcinoma in situ | ||
| IAC: Invasive lung adenocarcinoma | ||
| MIA: Minimally invasive adenocarcinoma | ||
| Oral Cavity | 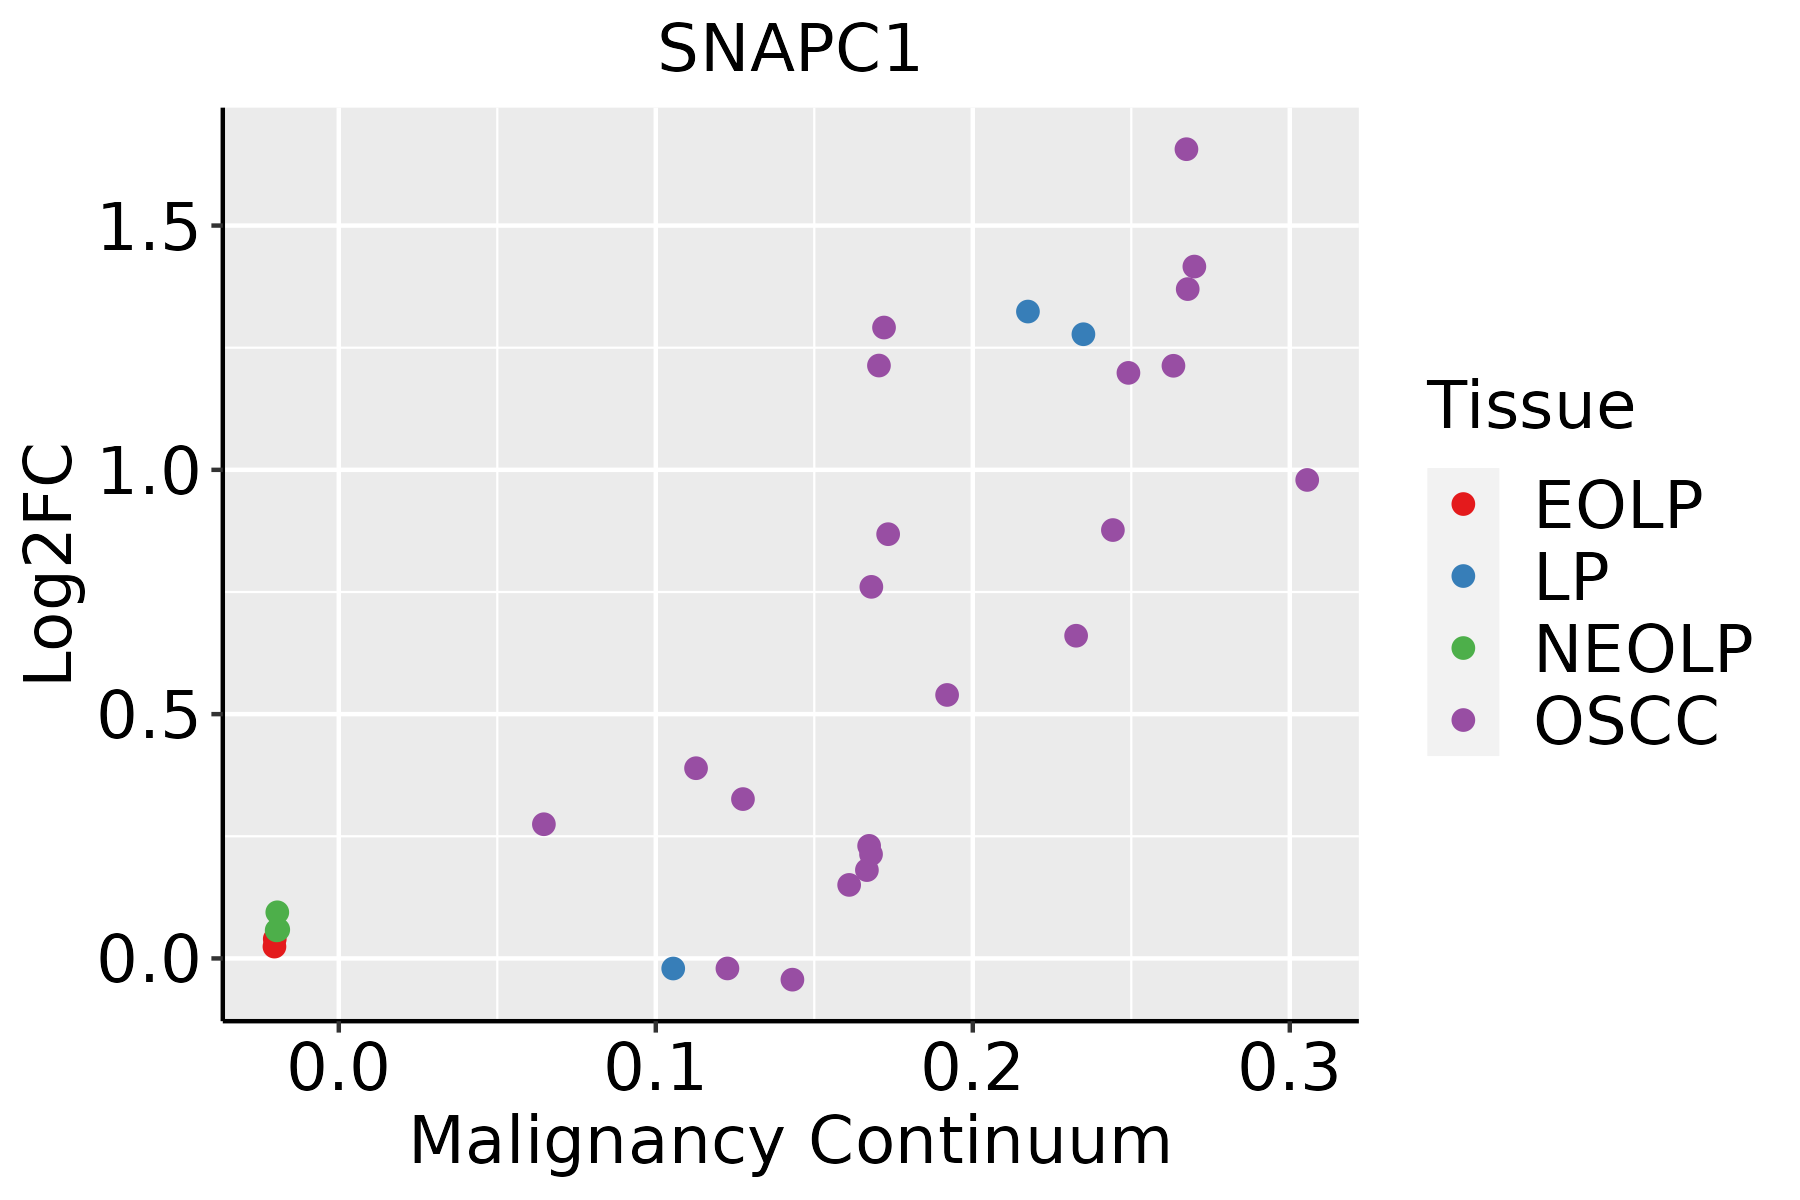 | EOLP: Erosive Oral lichen planus |
| LP: leukoplakia | ||
| NEOLP: Non-erosive oral lichen planus | ||
| OSCC: Oral squamous cell carcinoma | ||
| Skin | 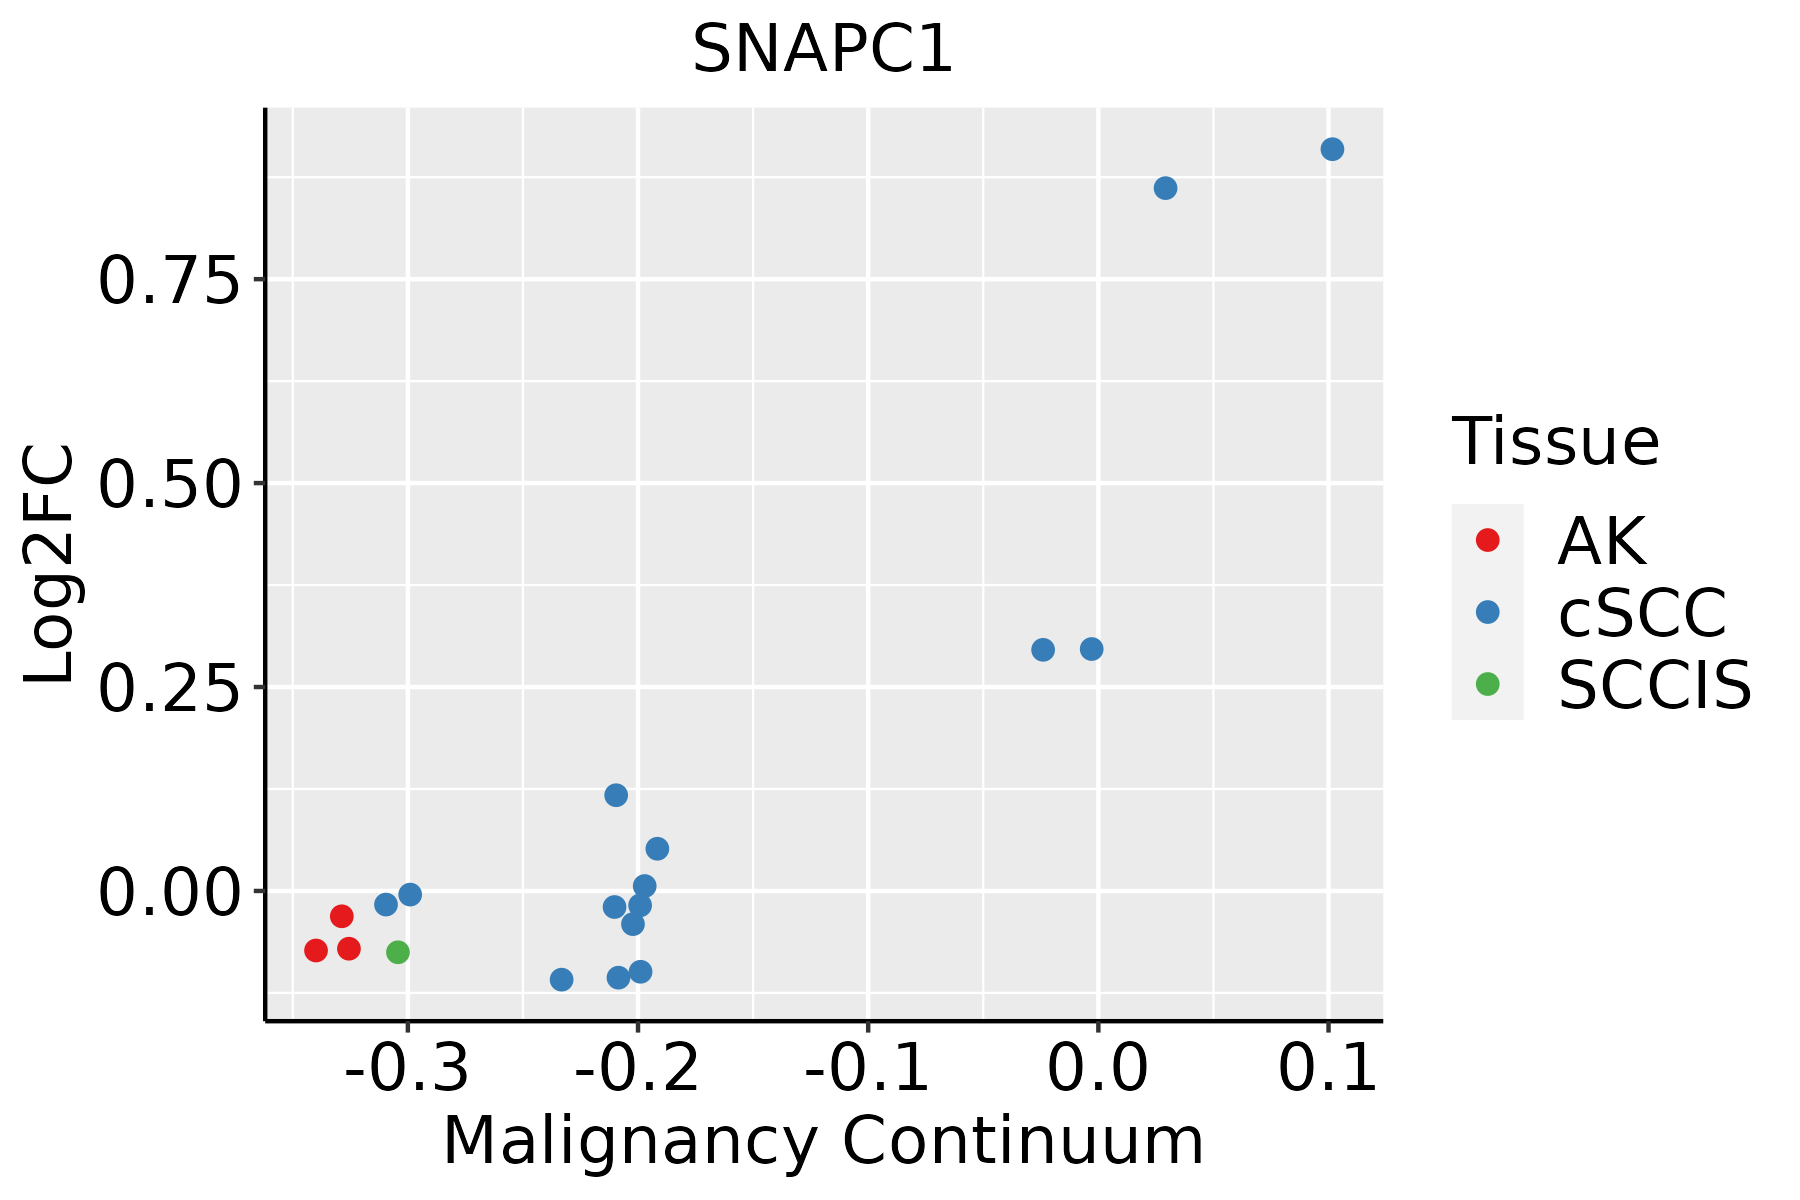 | AK: Actinic keratosis |
| cSCC: Cutaneous squamous cell carcinoma | ||
| SCCIS:squamous cell carcinoma in situ | ||
| Thyroid |  | ATC: Anaplastic thyroid cancer |
| HT: Hashimoto's thyroiditis | ||
| PTC: Papillary thyroid cancer |
| ∗log2FC in expression of this searched gene in stem-like cells from each diseased tissue sample relative to stem-like cells in normal samples in each tissue plotted against the malignancy continuum. Samples are colored based on if they are from different disease stage. |
Top |
Malignant transformation related pathway analysis |
| Find out the enriched GO biological processes and KEGG pathways involved in transition from healthy to precancer to cancer |
| Tissue | Disease Stage | Enriched GO biological Processes |
| Colorectum | AD |  |
| Colorectum | SER |  |
| Colorectum | MSS |  |
| Colorectum | MSI-H |  |
| Colorectum | FAP |  |
| ∗Top 15 enriched GO BP terms are showed in the bar plot of each disease state in each tissue. Each row represents a significant GO biological process which is colored according to the -log10(p.adjust). |
| Page: 1 2 3 4 5 6 7 8 9 |
| GO ID | Tissue | Disease Stage | Description | Gene Ratio | Bg Ratio | pvalue | p.adjust | Count |
| GO:00063833 | Esophagus | ESCC | transcription by RNA polymerase III | 41/8552 | 46/18723 | 7.69e-10 | 1.90e-08 | 41 |
| GO:00987812 | Esophagus | ESCC | ncRNA transcription | 45/8552 | 56/18723 | 1.05e-07 | 1.72e-06 | 45 |
| GO:00093011 | Esophagus | ESCC | snRNA transcription | 16/8552 | 19/18723 | 6.45e-04 | 3.43e-03 | 16 |
| GO:00427951 | Esophagus | ESCC | snRNA transcription by RNA polymerase II | 13/8552 | 16/18723 | 4.05e-03 | 1.62e-02 | 13 |
| GO:0006383 | Liver | HCC | transcription by RNA polymerase III | 31/7958 | 46/18723 | 5.67e-04 | 3.61e-03 | 31 |
| GO:0098781 | Liver | HCC | ncRNA transcription | 33/7958 | 56/18723 | 9.64e-03 | 3.63e-02 | 33 |
| GO:00063832 | Oral cavity | OSCC | transcription by RNA polymerase III | 34/7305 | 46/18723 | 1.61e-06 | 2.11e-05 | 34 |
| GO:00987811 | Oral cavity | OSCC | ncRNA transcription | 38/7305 | 56/18723 | 1.15e-05 | 1.18e-04 | 38 |
| GO:0009301 | Oral cavity | OSCC | snRNA transcription | 13/7305 | 19/18723 | 9.07e-03 | 3.26e-02 | 13 |
| GO:0042795 | Oral cavity | OSCC | snRNA transcription by RNA polymerase II | 11/7305 | 16/18723 | 1.56e-02 | 4.99e-02 | 11 |
| GO:00063831 | Oral cavity | LP | transcription by RNA polymerase III | 20/4623 | 46/18723 | 4.03e-03 | 2.61e-02 | 20 |
| GO:00987813 | Skin | cSCC | ncRNA transcription | 28/4864 | 56/18723 | 9.93e-05 | 9.22e-04 | 28 |
| GO:00063834 | Skin | cSCC | transcription by RNA polymerase III | 20/4864 | 46/18723 | 7.44e-03 | 3.50e-02 | 20 |
| GO:00987814 | Thyroid | PTC | ncRNA transcription | 27/5968 | 56/18723 | 7.77e-03 | 3.29e-02 | 27 |
| GO:00063835 | Thyroid | PTC | transcription by RNA polymerase III | 23/5968 | 46/18723 | 7.89e-03 | 3.33e-02 | 23 |
| Page: 1 |
| Pathway ID | Tissue | Disease Stage | Description | Gene Ratio | Bg Ratio | pvalue | p.adjust | qvalue | Count |
| Page: 1 |
Top |
Cell-cell communication analysis |
| Identification of potential cell-cell interactions between two cell types and their ligand-receptor pairs for different disease states |
| Ligand | Receptor | LRpair | Pathway | Tissue | Disease Stage |
| Page: 1 |
Top |
Single-cell gene regulatory network inference analysis |
| Find out the significant the regulons (TFs) and the target genes of each regulon across cell types for different disease states |
| TF | Cell Type | Tissue | Disease Stage | Target Gene | RSS | Regulon Activity |
| ∗The dot plots of a searched regulon are shown for all cell subpopulations in each disease state of each tissue based on the regulon specific score inferred using pySCENIC and by calculating the average expression. |
| Page: 1 |
Top |
Somatic mutation of malignant transformation related genes |
| Annotation of somatic variants for genes involved in malignant transformation |
| Hugo Symbol | Variant Class | Variant Classification | dbSNP RS | HGVSc | HGVSp | HGVSp Short | SWISSPROT | BIOTYPE | SIFT | PolyPhen | Tumor Sample Barcode | Tissue | Histology | Sex | Age | Stage | Therapy Types | Drugs | Outcome |
| SNAPC1 | SNV | Missense_Mutation | c.1042N>A | p.Glu348Lys | p.E348K | Q16533 | protein_coding | deleterious(0.04) | benign(0.062) | TCGA-AO-A12D-01 | Breast | breast invasive carcinoma | Female | <65 | I/II | Chemotherapy | cyclophosphamide | SD | |
| SNAPC1 | SNV | Missense_Mutation | rs746058398 | c.79G>A | p.Glu27Lys | p.E27K | Q16533 | protein_coding | deleterious(0) | probably_damaging(0.916) | TCGA-BH-A0EI-01 | Breast | breast invasive carcinoma | Female | <65 | I/II | Unknown | Unknown | SD |
| SNAPC1 | SNV | Missense_Mutation | c.775G>A | p.Ala259Thr | p.A259T | Q16533 | protein_coding | deleterious(0) | probably_damaging(0.996) | TCGA-BH-A18G-01 | Breast | breast invasive carcinoma | Female | >=65 | I/II | Unknown | Unknown | SD | |
| SNAPC1 | SNV | Missense_Mutation | c.434N>T | p.Ser145Leu | p.S145L | Q16533 | protein_coding | deleterious(0.03) | possibly_damaging(0.726) | TCGA-D8-A1Y0-01 | Breast | breast invasive carcinoma | Female | >=65 | III/IV | Chemotherapy | cyclophosphamide+methotrexatum+fluorouracillum | SD | |
| SNAPC1 | deletion | Frame_Shift_Del | c.633delN | p.Phe213LeufsTer7 | p.F213Lfs*7 | Q16533 | protein_coding | TCGA-D8-A1Y1-01 | Breast | breast invasive carcinoma | Female | >=65 | III/IV | Hormone Therapy | tamoxiphen | PD | |||
| SNAPC1 | SNV | Missense_Mutation | c.191N>A | p.Arg64Gln | p.R64Q | Q16533 | protein_coding | tolerated(1) | benign(0.005) | TCGA-2W-A8YY-01 | Cervix | cervical & endocervical cancer | Female | <65 | I/II | Chemotherapy | cisplatin | CR | |
| SNAPC1 | insertion | Frame_Shift_Ins | novel | c.976_976+1insATGAG | p.Gly326AspfsTer15 | p.G326Dfs*15 | Q16533 | protein_coding | TCGA-DS-A1OC-01 | Cervix | cervical & endocervical cancer | Female | <65 | I/II | Chemotherapy | gemcitabine | SD | ||
| SNAPC1 | SNV | Missense_Mutation | c.1078N>T | p.Thr360Ser | p.T360S | Q16533 | protein_coding | tolerated(0.47) | benign(0.031) | TCGA-AA-3864-01 | Colorectum | colon adenocarcinoma | Male | >=65 | I/II | Unknown | Unknown | SD | |
| SNAPC1 | SNV | Missense_Mutation | rs779670803 | c.389G>A | p.Arg130Gln | p.R130Q | Q16533 | protein_coding | tolerated(0.05) | probably_damaging(0.985) | TCGA-CA-6717-01 | Colorectum | colon adenocarcinoma | Male | <65 | I/II | Chemotherapy | oxaliplatin | CR |
| SNAPC1 | SNV | Missense_Mutation | novel | c.733A>C | p.Lys245Gln | p.K245Q | Q16533 | protein_coding | tolerated(0.14) | benign(0) | TCGA-CA-6717-01 | Colorectum | colon adenocarcinoma | Male | <65 | I/II | Chemotherapy | oxaliplatin | CR |
| Page: 1 2 3 4 5 6 |
Top |
Related drugs of malignant transformation related genes |
| Identification of chemicals and drugs interact with genes involved in malignant transfromation |
| (DGIdb 4.0) |
| Entrez ID | Symbol | Category | Interaction Types | Drug Claim Name | Drug Name | PMIDs |
| Page: 1 |

Copyright 2023-Present -The University of Texas Health Science Center at Houston |