
|
|||||
|
 | |
| |
| |
| |
| |
| |
|
Gene: SNAP47 |
Gene summary for SNAP47 |
| Gene information | Species | Human | Gene symbol | SNAP47 | Gene ID | 116841 |
| Gene name | synaptosome associated protein 47 | |
| Gene Alias | C1orf142 | |
| Cytomap | 1q42.13 | |
| Gene Type | protein-coding | GO ID | GO:0001505 | UniProtAcc | A0A087X0B7 |
Top |
Malignant transformation analysis |
| Identification of the aberrant gene expression in precancerous and cancerous lesions by comparing the gene expression of stem-like cells in diseased tissues with normal stem cells |
| Entrez ID | Symbol | Replicates | Species | Organ | Tissue | Adj P-value | Log2FC | Malignancy |
| 116841 | SNAP47 | LZE4T | Human | Esophagus | ESCC | 1.58e-06 | 2.95e-01 | 0.0811 |
| 116841 | SNAP47 | LZE7T | Human | Esophagus | ESCC | 7.56e-15 | 7.09e-01 | 0.0667 |
| 116841 | SNAP47 | LZE20T | Human | Esophagus | ESCC | 2.61e-05 | 1.89e-01 | 0.0662 |
| 116841 | SNAP47 | LZE22T | Human | Esophagus | ESCC | 2.47e-04 | 3.74e-01 | 0.068 |
| 116841 | SNAP47 | LZE24T | Human | Esophagus | ESCC | 2.11e-08 | 2.70e-01 | 0.0596 |
| 116841 | SNAP47 | LZE21T | Human | Esophagus | ESCC | 3.31e-05 | 1.89e-01 | 0.0655 |
| 116841 | SNAP47 | LZE6T | Human | Esophagus | ESCC | 2.92e-04 | 2.40e-01 | 0.0845 |
| 116841 | SNAP47 | P1T-E | Human | Esophagus | ESCC | 7.55e-12 | 5.00e-01 | 0.0875 |
| 116841 | SNAP47 | P2T-E | Human | Esophagus | ESCC | 1.92e-34 | 5.89e-01 | 0.1177 |
| 116841 | SNAP47 | P4T-E | Human | Esophagus | ESCC | 1.06e-13 | 3.34e-01 | 0.1323 |
| 116841 | SNAP47 | P5T-E | Human | Esophagus | ESCC | 8.31e-23 | 4.57e-01 | 0.1327 |
| 116841 | SNAP47 | P8T-E | Human | Esophagus | ESCC | 3.62e-12 | 1.81e-01 | 0.0889 |
| 116841 | SNAP47 | P9T-E | Human | Esophagus | ESCC | 5.69e-18 | 3.27e-01 | 0.1131 |
| 116841 | SNAP47 | P10T-E | Human | Esophagus | ESCC | 3.29e-22 | 3.79e-01 | 0.116 |
| 116841 | SNAP47 | P11T-E | Human | Esophagus | ESCC | 1.09e-15 | 6.11e-01 | 0.1426 |
| 116841 | SNAP47 | P12T-E | Human | Esophagus | ESCC | 3.19e-20 | 3.52e-01 | 0.1122 |
| 116841 | SNAP47 | P15T-E | Human | Esophagus | ESCC | 7.26e-32 | 6.25e-01 | 0.1149 |
| 116841 | SNAP47 | P16T-E | Human | Esophagus | ESCC | 2.46e-45 | 6.83e-01 | 0.1153 |
| 116841 | SNAP47 | P17T-E | Human | Esophagus | ESCC | 2.67e-11 | 4.15e-01 | 0.1278 |
| 116841 | SNAP47 | P19T-E | Human | Esophagus | ESCC | 6.26e-10 | 5.04e-01 | 0.1662 |
| Page: 1 2 3 4 5 |
| Tissue | Expression Dynamics | Abbreviation |
| Esophagus | 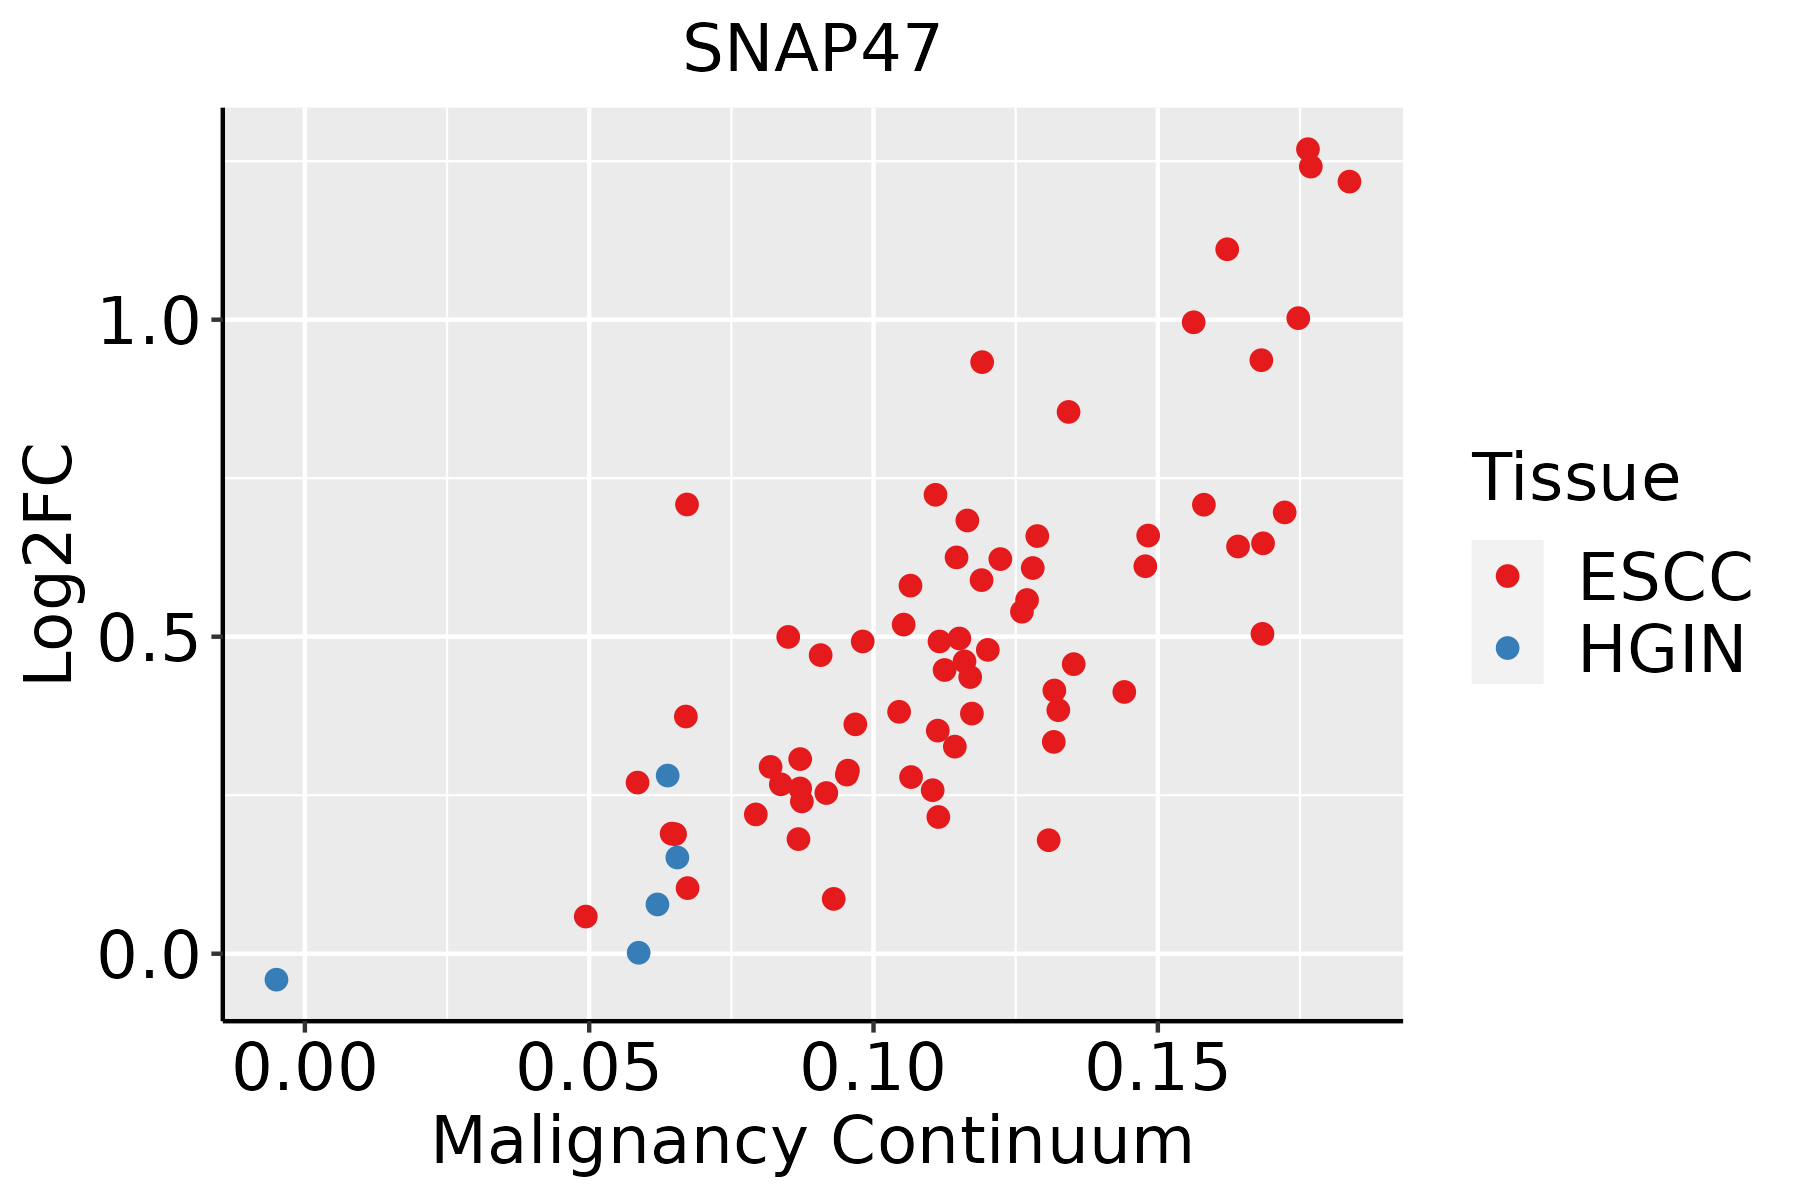 | ESCC: Esophageal squamous cell carcinoma |
| HGIN: High-grade intraepithelial neoplasias | ||
| LGIN: Low-grade intraepithelial neoplasias | ||
| Liver | 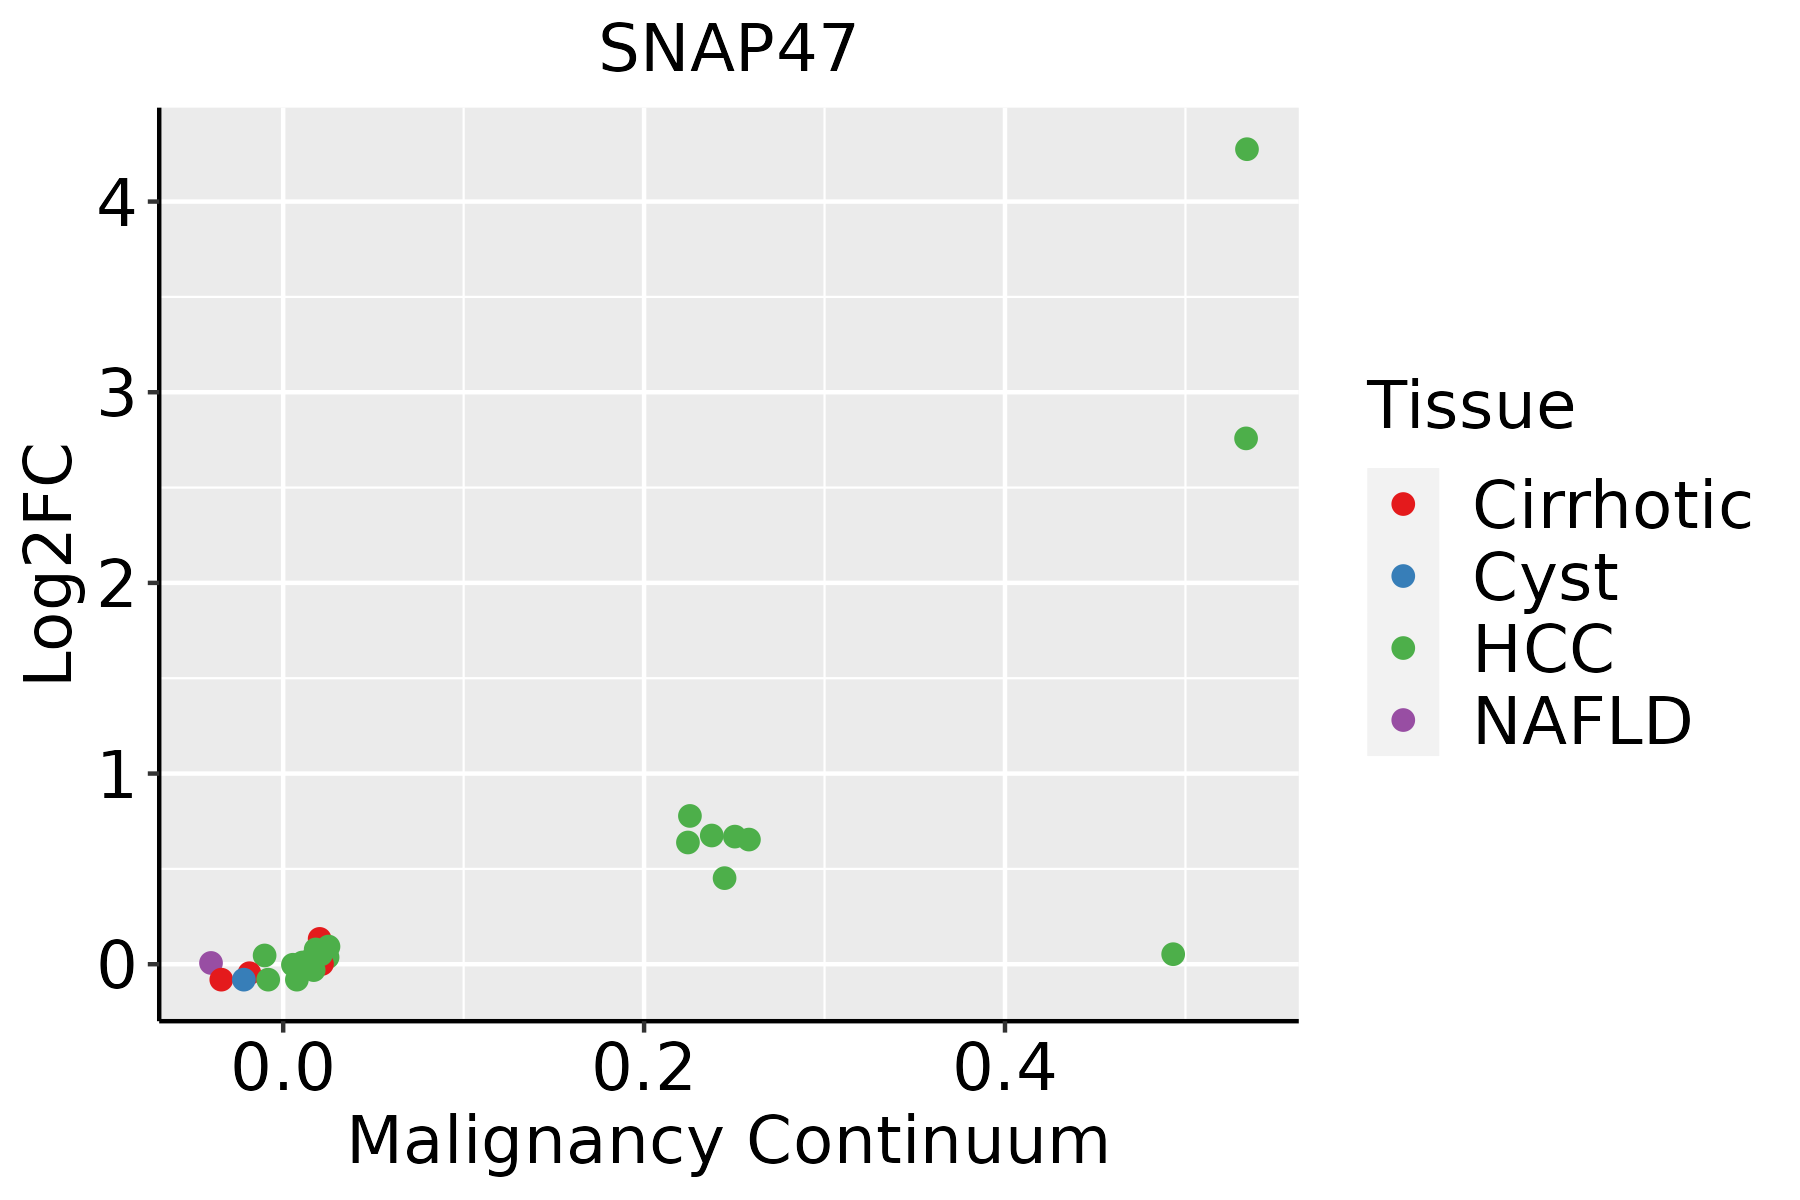 | HCC: Hepatocellular carcinoma |
| NAFLD: Non-alcoholic fatty liver disease | ||
| Oral Cavity |  | EOLP: Erosive Oral lichen planus |
| LP: leukoplakia | ||
| NEOLP: Non-erosive oral lichen planus | ||
| OSCC: Oral squamous cell carcinoma | ||
| Skin | 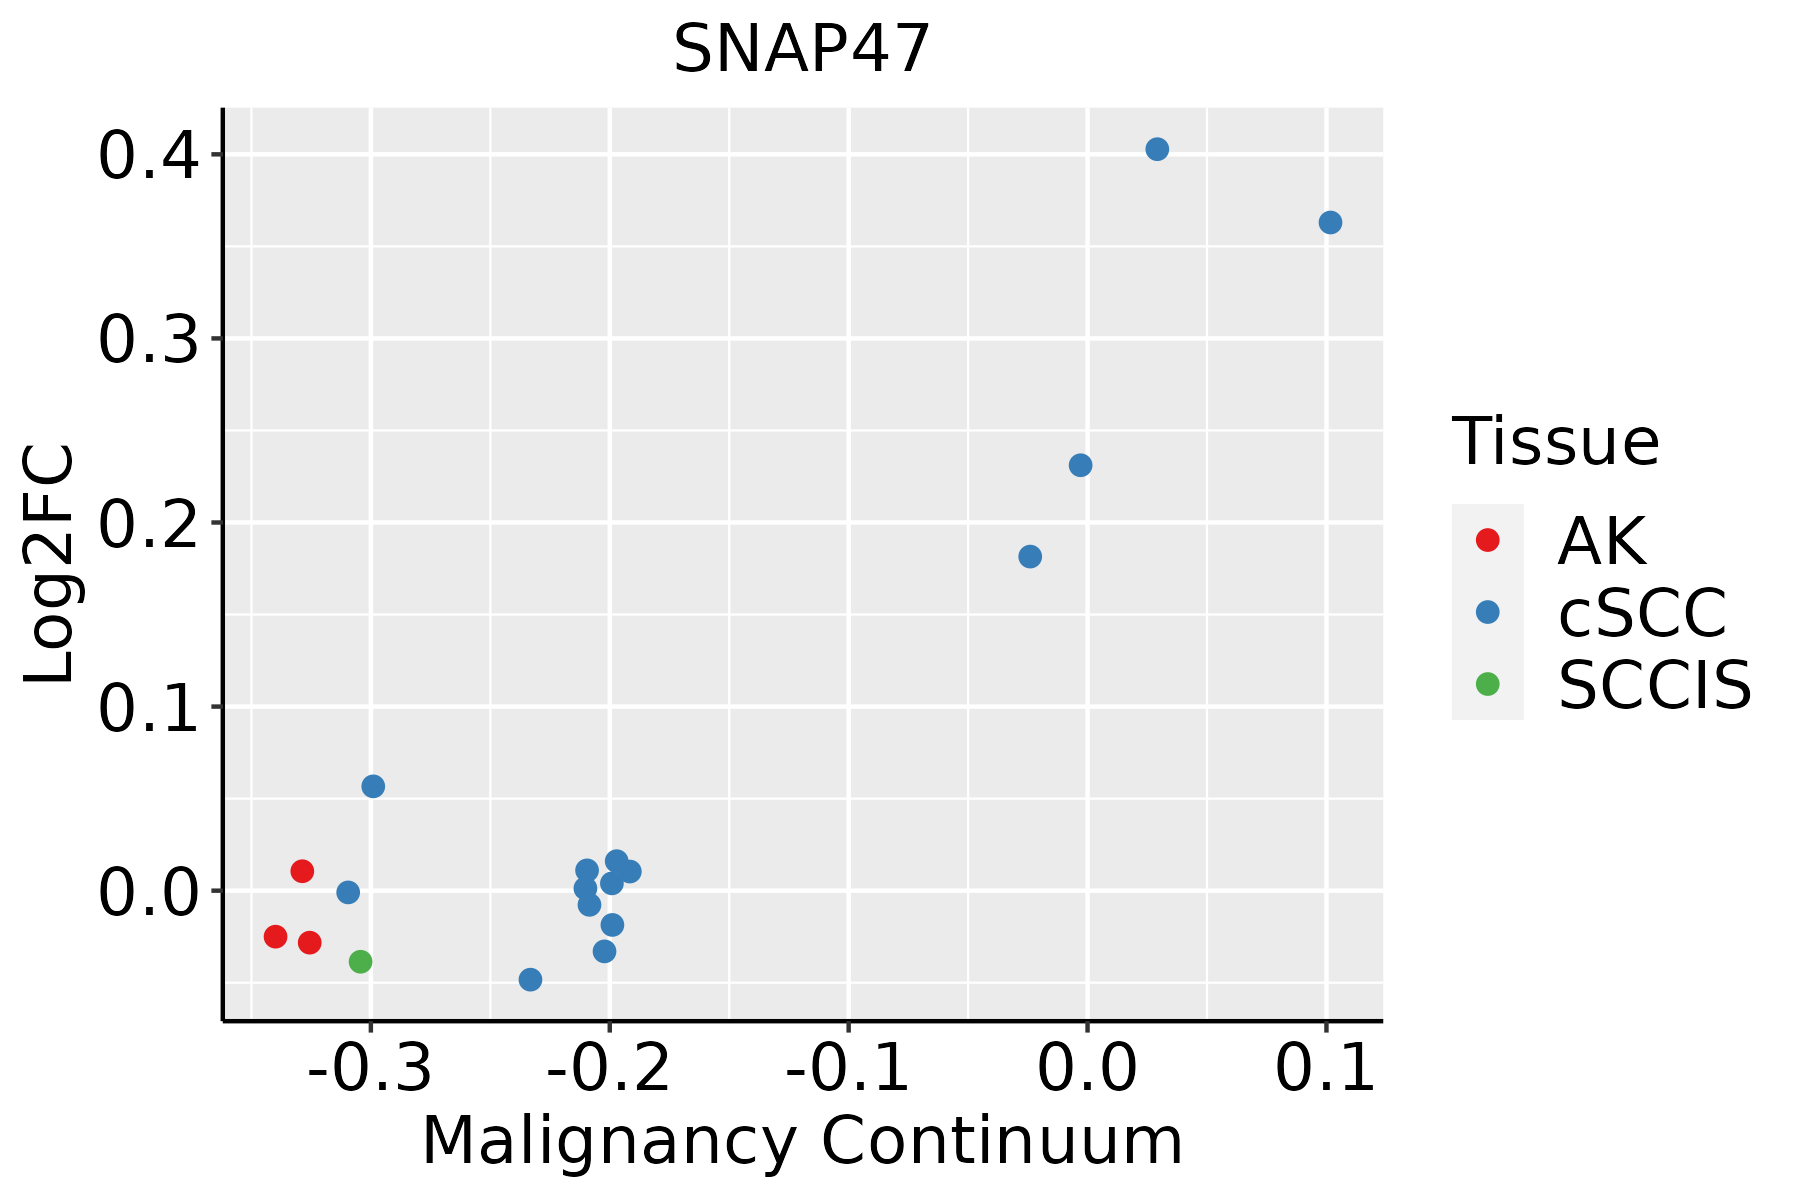 | AK: Actinic keratosis |
| cSCC: Cutaneous squamous cell carcinoma | ||
| SCCIS:squamous cell carcinoma in situ |
| ∗log2FC in expression of this searched gene in stem-like cells from each diseased tissue sample relative to stem-like cells in normal samples in each tissue plotted against the malignancy continuum. Samples are colored based on if they are from different disease stage. |
Top |
Malignant transformation related pathway analysis |
| Find out the enriched GO biological processes and KEGG pathways involved in transition from healthy to precancer to cancer |
| Tissue | Disease Stage | Enriched GO biological Processes |
| Colorectum | AD |  |
| Colorectum | SER |  |
| Colorectum | MSS |  |
| Colorectum | MSI-H |  |
| Colorectum | FAP |  |
| ∗Top 15 enriched GO BP terms are showed in the bar plot of each disease state in each tissue. Each row represents a significant GO biological process which is colored according to the -log10(p.adjust). |
| Page: 1 2 3 4 5 6 7 8 9 |
| GO ID | Tissue | Disease Stage | Description | Gene Ratio | Bg Ratio | pvalue | p.adjust | Count |
| GO:001605014 | Esophagus | ESCC | vesicle organization | 211/8552 | 300/18723 | 2.85e-18 | 2.87e-16 | 211 |
| GO:00482844 | Esophagus | ESCC | organelle fusion | 94/8552 | 141/18723 | 3.72e-07 | 5.16e-06 | 94 |
| GO:00901743 | Esophagus | ESCC | organelle membrane fusion | 73/8552 | 110/18723 | 9.29e-06 | 8.88e-05 | 73 |
| GO:00069063 | Esophagus | ESCC | vesicle fusion | 70/8552 | 106/18723 | 1.82e-05 | 1.60e-04 | 70 |
| GO:00610254 | Esophagus | ESCC | membrane fusion | 98/8552 | 163/18723 | 1.39e-04 | 9.41e-04 | 98 |
| GO:001605021 | Liver | HCC | vesicle organization | 194/7958 | 300/18723 | 5.58e-15 | 3.97e-13 | 194 |
| GO:004828411 | Liver | HCC | organelle fusion | 84/7958 | 141/18723 | 3.13e-05 | 3.20e-04 | 84 |
| GO:00901741 | Liver | HCC | organelle membrane fusion | 63/7958 | 110/18723 | 1.24e-03 | 6.85e-03 | 63 |
| GO:00069061 | Liver | HCC | vesicle fusion | 61/7958 | 106/18723 | 1.25e-03 | 6.90e-03 | 61 |
| GO:0061025 | Liver | HCC | membrane fusion | 88/7958 | 163/18723 | 1.98e-03 | 1.00e-02 | 88 |
| GO:00160508 | Oral cavity | OSCC | vesicle organization | 189/7305 | 300/18723 | 2.40e-17 | 2.14e-15 | 189 |
| GO:00482843 | Oral cavity | OSCC | organelle fusion | 82/7305 | 141/18723 | 3.08e-06 | 3.72e-05 | 82 |
| GO:00901742 | Oral cavity | OSCC | organelle membrane fusion | 63/7305 | 110/18723 | 7.75e-05 | 6.01e-04 | 63 |
| GO:00069062 | Oral cavity | OSCC | vesicle fusion | 61/7305 | 106/18723 | 8.28e-05 | 6.35e-04 | 61 |
| GO:00610253 | Oral cavity | OSCC | membrane fusion | 84/7305 | 163/18723 | 7.56e-04 | 4.12e-03 | 84 |
| GO:001605013 | Oral cavity | LP | vesicle organization | 128/4623 | 300/18723 | 4.96e-12 | 3.98e-10 | 128 |
| GO:004828412 | Oral cavity | LP | organelle fusion | 56/4623 | 141/18723 | 5.55e-05 | 7.62e-04 | 56 |
| GO:000690611 | Oral cavity | LP | vesicle fusion | 44/4623 | 106/18723 | 1.01e-04 | 1.24e-03 | 44 |
| GO:009017411 | Oral cavity | LP | organelle membrane fusion | 45/4623 | 110/18723 | 1.28e-04 | 1.49e-03 | 45 |
| GO:00610251 | Oral cavity | LP | membrane fusion | 58/4623 | 163/18723 | 1.19e-03 | 9.62e-03 | 58 |
| Page: 1 2 |
| Pathway ID | Tissue | Disease Stage | Description | Gene Ratio | Bg Ratio | pvalue | p.adjust | qvalue | Count |
| Page: 1 |
Top |
Cell-cell communication analysis |
| Identification of potential cell-cell interactions between two cell types and their ligand-receptor pairs for different disease states |
| Ligand | Receptor | LRpair | Pathway | Tissue | Disease Stage |
| Page: 1 |
Top |
Single-cell gene regulatory network inference analysis |
| Find out the significant the regulons (TFs) and the target genes of each regulon across cell types for different disease states |
| TF | Cell Type | Tissue | Disease Stage | Target Gene | RSS | Regulon Activity |
| ∗The dot plots of a searched regulon are shown for all cell subpopulations in each disease state of each tissue based on the regulon specific score inferred using pySCENIC and by calculating the average expression. |
| Page: 1 |
Top |
Somatic mutation of malignant transformation related genes |
| Annotation of somatic variants for genes involved in malignant transformation |
| Hugo Symbol | Variant Class | Variant Classification | dbSNP RS | HGVSc | HGVSp | HGVSp Short | SWISSPROT | BIOTYPE | SIFT | PolyPhen | Tumor Sample Barcode | Tissue | Histology | Sex | Age | Stage | Therapy Types | Drugs | Outcome |
| SNAP47 | SNV | Missense_Mutation | novel | c.1299N>C | p.Glu433Asp | p.E433D | Q5SQN1 | protein_coding | tolerated(0.11) | probably_damaging(0.915) | TCGA-AC-A5XS-01 | Breast | breast invasive carcinoma | Female | >=65 | I/II | Hormone Therapy | femara | SD |
| SNAP47 | SNV | Missense_Mutation | c.674G>A | p.Ser225Asn | p.S225N | Q5SQN1 | protein_coding | tolerated(0.09) | possibly_damaging(0.691) | TCGA-BH-A0HK-01 | Breast | breast invasive carcinoma | Female | >=65 | I/II | Hormone Therapy | arimidex | SD | |
| SNAP47 | SNV | Missense_Mutation | novel | c.748N>A | p.Gly250Arg | p.G250R | Q5SQN1 | protein_coding | deleterious(0.03) | probably_damaging(0.988) | TCGA-C8-A8HP-01 | Breast | breast invasive carcinoma | Female | <65 | III/IV | Chemotherapy | 5-fluorouracil | CR |
| SNAP47 | insertion | Frame_Shift_Ins | novel | c.910_911insGT | p.Lys304SerfsTer25 | p.K304Sfs*25 | Q5SQN1 | protein_coding | TCGA-BH-A0HL-01 | Breast | breast invasive carcinoma | Female | <65 | I/II | Chemotherapy | cyclophosphamide | SD | ||
| SNAP47 | insertion | Nonsense_Mutation | novel | c.911_912insTAAACCAAAAGTAAAATCCTAAGCACCCCAGCCAACTGAAT | p.Lys304AsnfsTer8 | p.K304Nfs*8 | Q5SQN1 | protein_coding | TCGA-BH-A0HL-01 | Breast | breast invasive carcinoma | Female | <65 | I/II | Chemotherapy | cyclophosphamide | SD | ||
| SNAP47 | SNV | Missense_Mutation | c.346C>A | p.Leu116Met | p.L116M | Q5SQN1 | protein_coding | deleterious(0) | probably_damaging(0.999) | TCGA-A6-2686-01 | Colorectum | colon adenocarcinoma | Female | >=65 | I/II | Unknown | Unknown | SD | |
| SNAP47 | SNV | Missense_Mutation | c.796A>G | p.Thr266Ala | p.T266A | Q5SQN1 | protein_coding | tolerated(0.99) | benign(0.015) | TCGA-AA-3680-01 | Colorectum | colon adenocarcinoma | Female | >=65 | III/IV | Chemotherapy | folinic | PD | |
| SNAP47 | SNV | Missense_Mutation | novel | c.545C>T | p.Ala182Val | p.A182V | Q5SQN1 | protein_coding | deleterious(0) | possibly_damaging(0.794) | TCGA-AA-3949-01 | Colorectum | colon adenocarcinoma | Female | >=65 | III/IV | Unknown | Unknown | SD |
| SNAP47 | SNV | Missense_Mutation | novel | c.901G>C | p.Asp301His | p.D301H | Q5SQN1 | protein_coding | deleterious(0) | probably_damaging(1) | TCGA-AA-A01D-01 | Colorectum | colon adenocarcinoma | Female | <65 | III/IV | Chemotherapy | capecitabine | PD |
| SNAP47 | SNV | Missense_Mutation | rs770833379 | c.319N>T | p.His107Tyr | p.H107Y | Q5SQN1 | protein_coding | tolerated(0.56) | possibly_damaging(0.536) | TCGA-AA-A01T-01 | Colorectum | colon adenocarcinoma | Female | <65 | III/IV | Chemotherapy | 5-fluorouracil | CR |
| Page: 1 2 3 4 5 |
Top |
Related drugs of malignant transformation related genes |
| Identification of chemicals and drugs interact with genes involved in malignant transfromation |
| (DGIdb 4.0) |
| Entrez ID | Symbol | Category | Interaction Types | Drug Claim Name | Drug Name | PMIDs |
| Page: 1 |

Copyright 2023-Present -The University of Texas Health Science Center at Houston |