
|
|||||
|
 | |
| |
| |
| |
| |
| |
|
Gene: SNAP23 |
Gene summary for SNAP23 |
| Gene information | Species | Human | Gene symbol | SNAP23 | Gene ID | 8773 |
| Gene name | synaptosome associated protein 23 | |
| Gene Alias | HsT17016 | |
| Cytomap | 15q15.1-q15.2 | |
| Gene Type | protein-coding | GO ID | GO:0001505 | UniProtAcc | A8K287 |
Top |
Malignant transformation analysis |
| Identification of the aberrant gene expression in precancerous and cancerous lesions by comparing the gene expression of stem-like cells in diseased tissues with normal stem cells |
| Entrez ID | Symbol | Replicates | Species | Organ | Tissue | Adj P-value | Log2FC | Malignancy |
| 8773 | SNAP23 | LZE4T | Human | Esophagus | ESCC | 2.13e-19 | 7.65e-01 | 0.0811 |
| 8773 | SNAP23 | LZE5T | Human | Esophagus | ESCC | 1.05e-04 | 3.96e-01 | 0.0514 |
| 8773 | SNAP23 | LZE7T | Human | Esophagus | ESCC | 7.55e-03 | 2.50e-01 | 0.0667 |
| 8773 | SNAP23 | LZE8T | Human | Esophagus | ESCC | 1.10e-10 | 2.22e-01 | 0.067 |
| 8773 | SNAP23 | LZE20T | Human | Esophagus | ESCC | 1.76e-03 | 1.97e-01 | 0.0662 |
| 8773 | SNAP23 | LZE22T | Human | Esophagus | ESCC | 1.49e-06 | 2.54e-01 | 0.068 |
| 8773 | SNAP23 | LZE24T | Human | Esophagus | ESCC | 1.07e-21 | 4.97e-01 | 0.0596 |
| 8773 | SNAP23 | LZE21T | Human | Esophagus | ESCC | 1.55e-03 | 1.32e-01 | 0.0655 |
| 8773 | SNAP23 | P1T-E | Human | Esophagus | ESCC | 1.64e-14 | 7.10e-01 | 0.0875 |
| 8773 | SNAP23 | P2T-E | Human | Esophagus | ESCC | 2.39e-22 | 3.15e-01 | 0.1177 |
| 8773 | SNAP23 | P4T-E | Human | Esophagus | ESCC | 3.21e-31 | 7.85e-01 | 0.1323 |
| 8773 | SNAP23 | P5T-E | Human | Esophagus | ESCC | 2.71e-16 | 4.67e-01 | 0.1327 |
| 8773 | SNAP23 | P8T-E | Human | Esophagus | ESCC | 4.19e-35 | 6.49e-01 | 0.0889 |
| 8773 | SNAP23 | P9T-E | Human | Esophagus | ESCC | 1.21e-17 | 2.62e-01 | 0.1131 |
| 8773 | SNAP23 | P10T-E | Human | Esophagus | ESCC | 2.38e-25 | 5.33e-01 | 0.116 |
| 8773 | SNAP23 | P11T-E | Human | Esophagus | ESCC | 3.23e-12 | 5.76e-01 | 0.1426 |
| 8773 | SNAP23 | P12T-E | Human | Esophagus | ESCC | 1.83e-34 | 7.47e-01 | 0.1122 |
| 8773 | SNAP23 | P15T-E | Human | Esophagus | ESCC | 4.33e-18 | 3.50e-01 | 0.1149 |
| 8773 | SNAP23 | P16T-E | Human | Esophagus | ESCC | 4.61e-24 | 6.59e-01 | 0.1153 |
| 8773 | SNAP23 | P17T-E | Human | Esophagus | ESCC | 2.60e-04 | 3.10e-01 | 0.1278 |
| Page: 1 2 3 4 5 6 |
| Tissue | Expression Dynamics | Abbreviation |
| Esophagus | 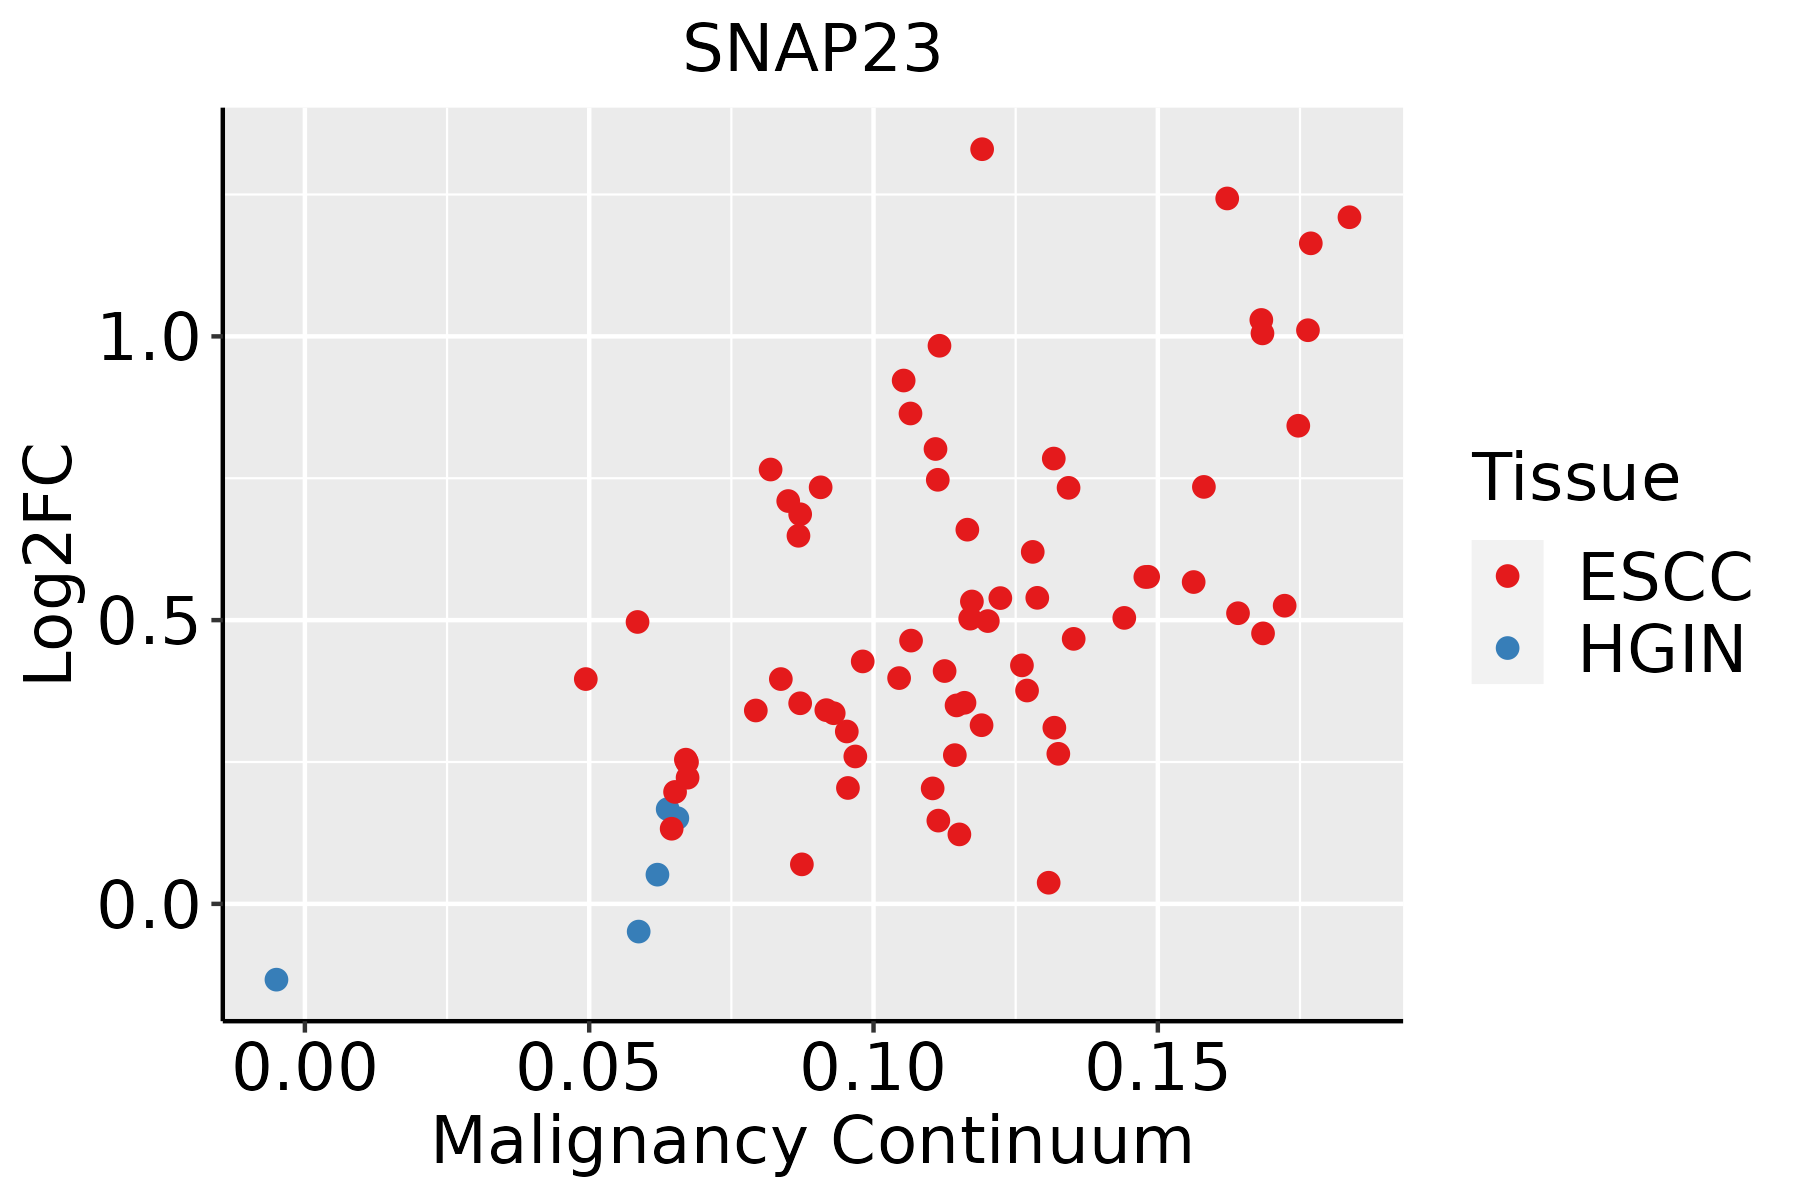 | ESCC: Esophageal squamous cell carcinoma |
| HGIN: High-grade intraepithelial neoplasias | ||
| LGIN: Low-grade intraepithelial neoplasias | ||
| Liver | 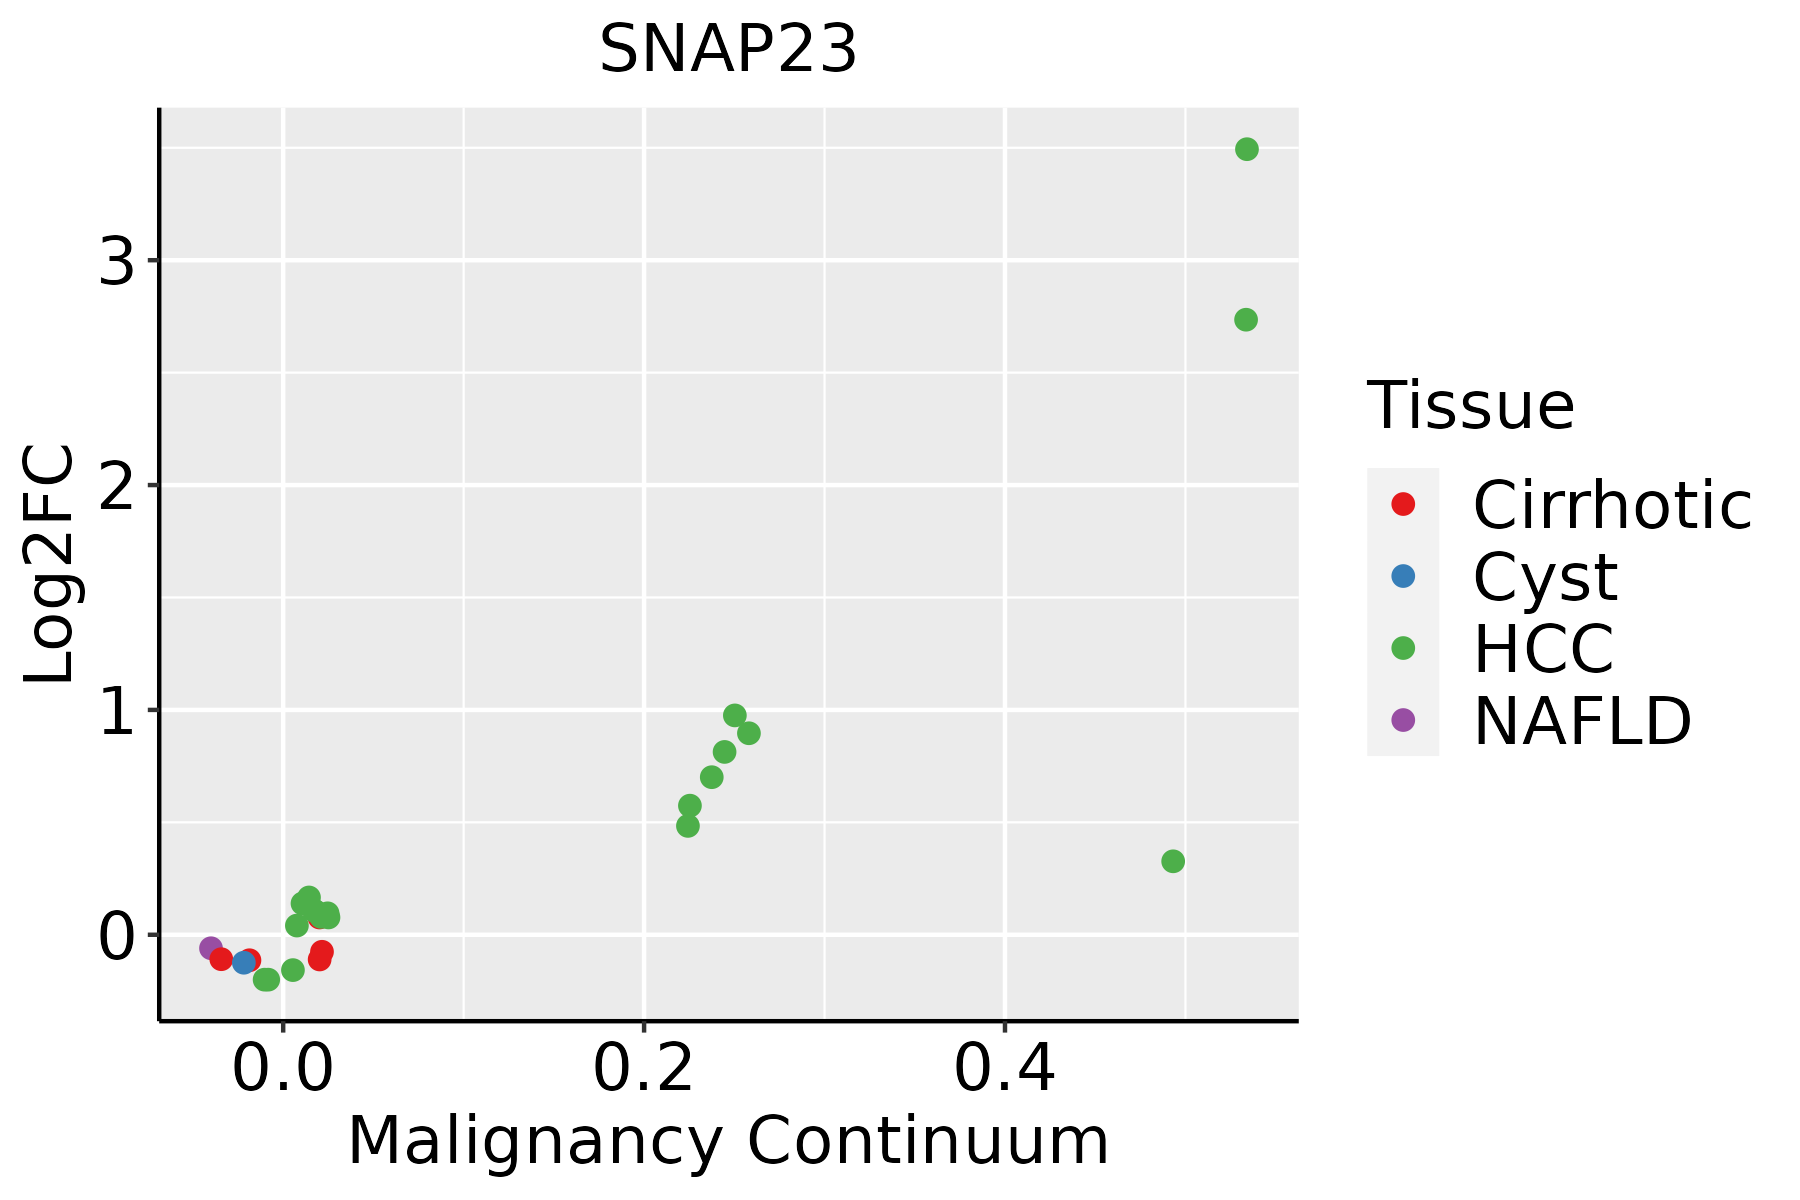 | HCC: Hepatocellular carcinoma |
| NAFLD: Non-alcoholic fatty liver disease | ||
| Oral Cavity | 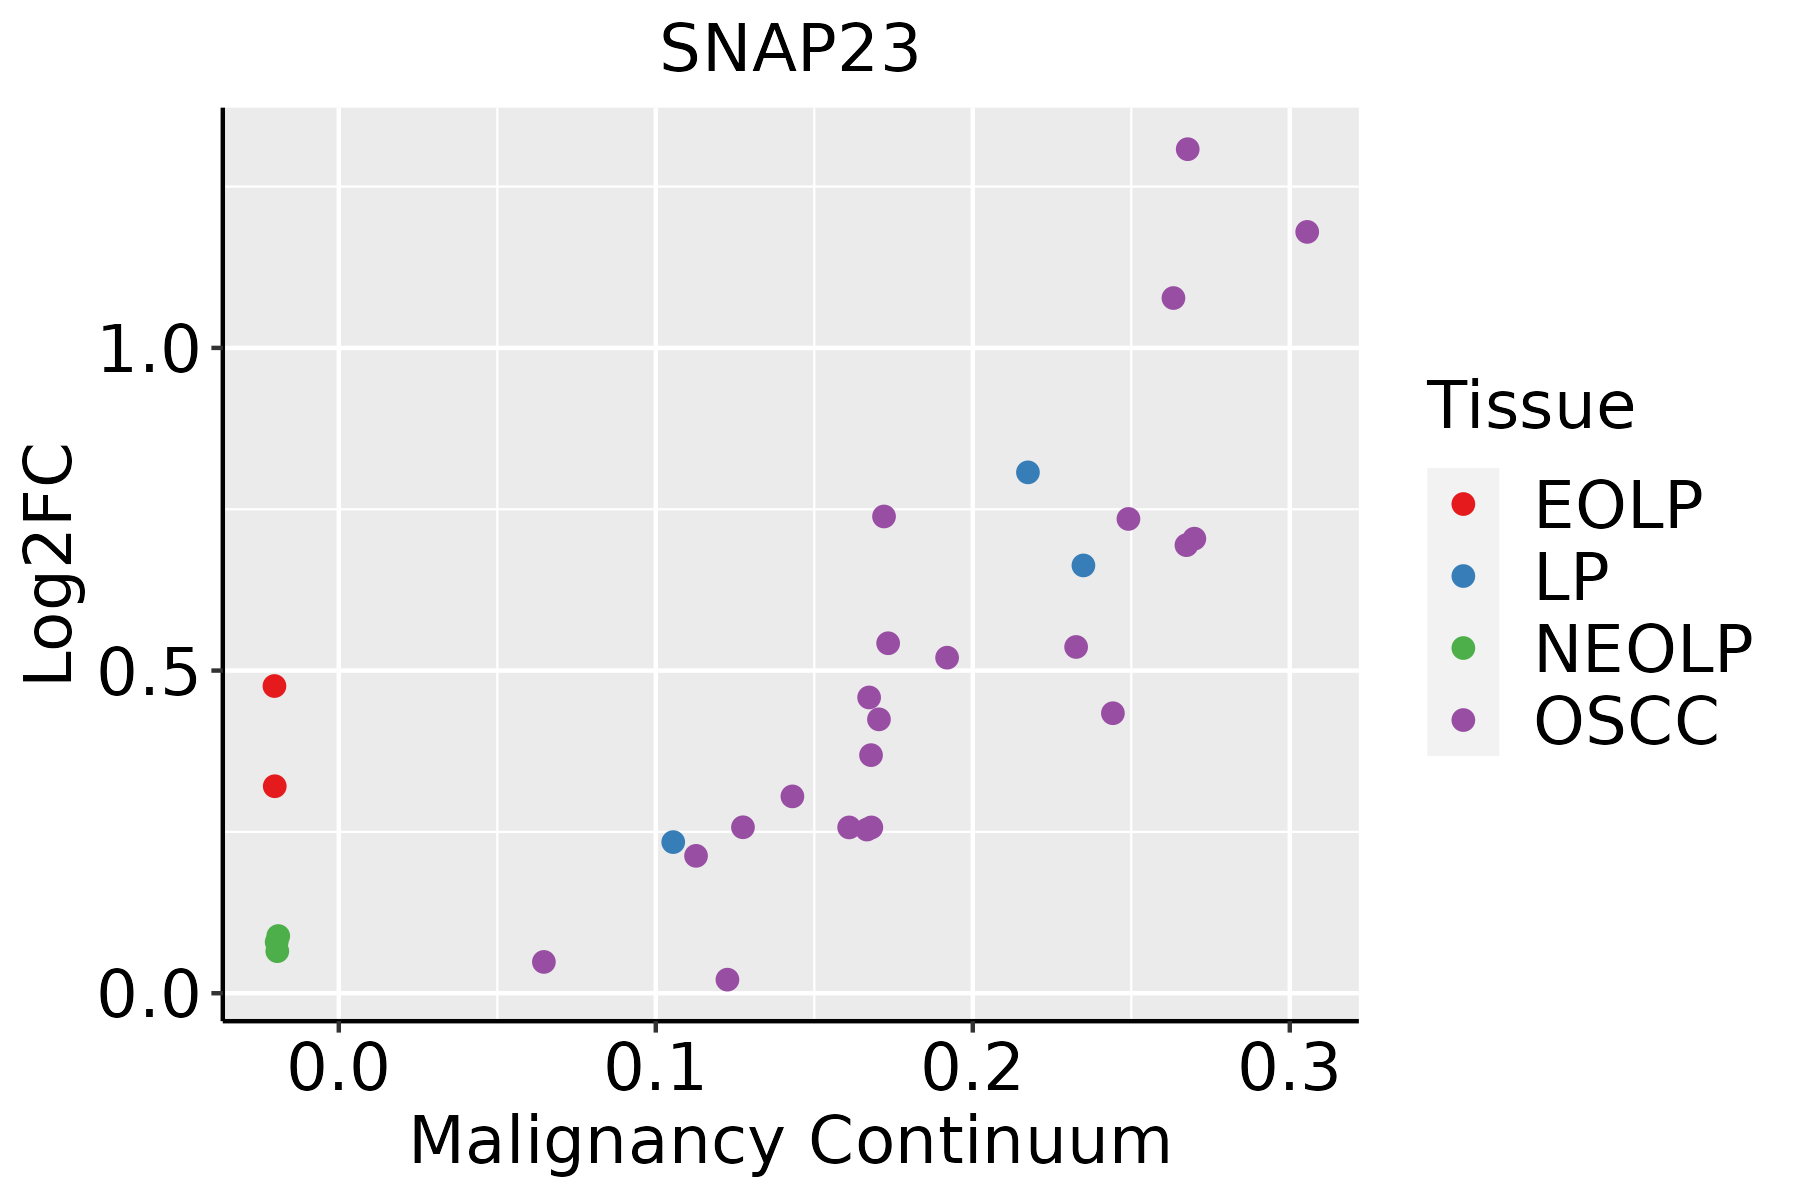 | EOLP: Erosive Oral lichen planus |
| LP: leukoplakia | ||
| NEOLP: Non-erosive oral lichen planus | ||
| OSCC: Oral squamous cell carcinoma | ||
| Prostate | 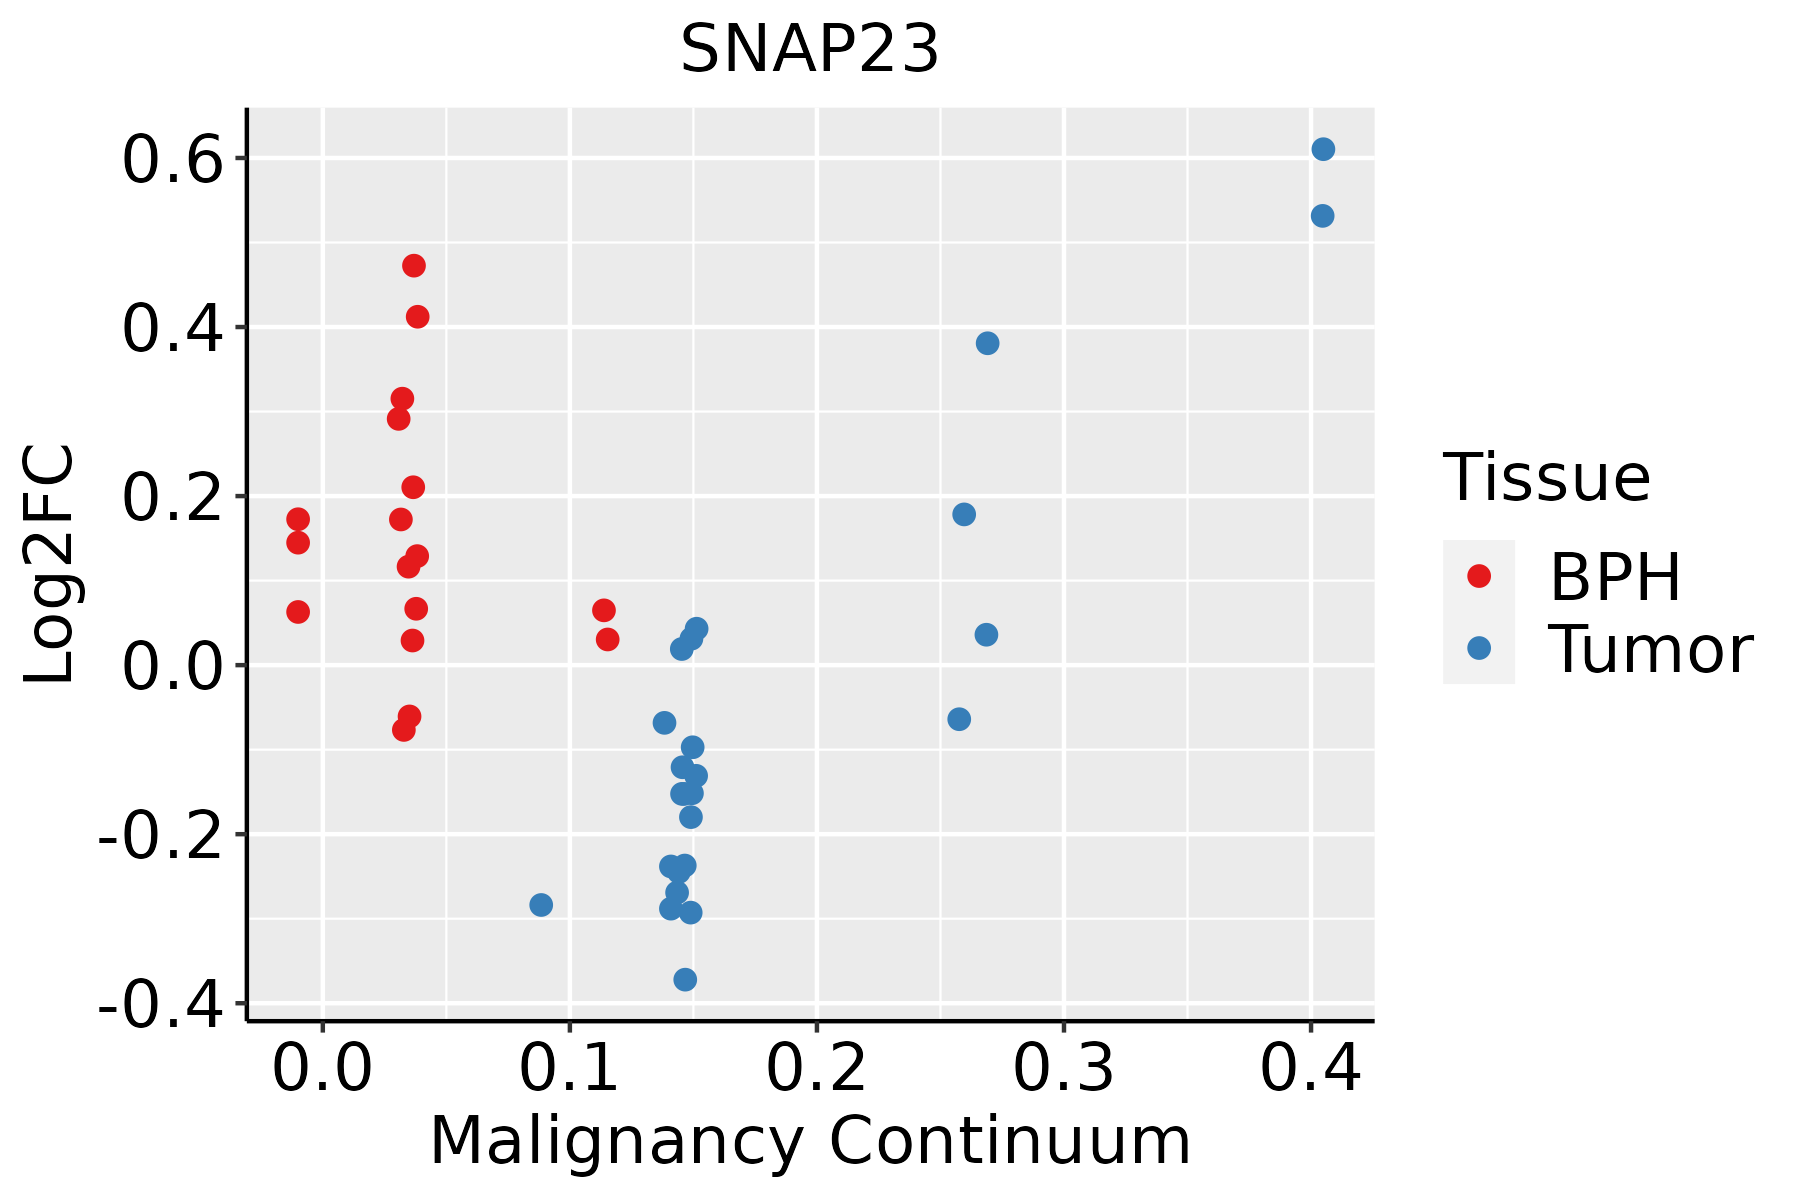 | BPH: Benign Prostatic Hyperplasia |
| Skin |  | AK: Actinic keratosis |
| cSCC: Cutaneous squamous cell carcinoma | ||
| SCCIS:squamous cell carcinoma in situ | ||
| Thyroid |  | ATC: Anaplastic thyroid cancer |
| HT: Hashimoto's thyroiditis | ||
| PTC: Papillary thyroid cancer |
| ∗log2FC in expression of this searched gene in stem-like cells from each diseased tissue sample relative to stem-like cells in normal samples in each tissue plotted against the malignancy continuum. Samples are colored based on if they are from different disease stage. |
Top |
Malignant transformation related pathway analysis |
| Find out the enriched GO biological processes and KEGG pathways involved in transition from healthy to precancer to cancer |
| Tissue | Disease Stage | Enriched GO biological Processes |
| Colorectum | AD |  |
| Colorectum | SER |  |
| Colorectum | MSS |  |
| Colorectum | MSI-H |  |
| Colorectum | FAP |  |
| ∗Top 15 enriched GO BP terms are showed in the bar plot of each disease state in each tissue. Each row represents a significant GO biological process which is colored according to the -log10(p.adjust). |
| Page: 1 2 3 4 5 6 7 8 9 |
| GO ID | Tissue | Disease Stage | Description | Gene Ratio | Bg Ratio | pvalue | p.adjust | Count |
| GO:004819318 | Esophagus | ESCC | Golgi vesicle transport | 231/8552 | 296/18723 | 1.82e-30 | 9.63e-28 | 231 |
| GO:005165617 | Esophagus | ESCC | establishment of organelle localization | 273/8552 | 390/18723 | 9.13e-23 | 1.81e-20 | 273 |
| GO:001605014 | Esophagus | ESCC | vesicle organization | 211/8552 | 300/18723 | 2.85e-18 | 2.87e-16 | 211 |
| GO:000689215 | Esophagus | ESCC | post-Golgi vesicle-mediated transport | 82/8552 | 104/18723 | 4.00e-12 | 1.55e-10 | 82 |
| GO:005165016 | Esophagus | ESCC | establishment of vesicle localization | 114/8552 | 161/18723 | 8.20e-11 | 2.53e-09 | 114 |
| GO:005164815 | Esophagus | ESCC | vesicle localization | 119/8552 | 177/18723 | 5.16e-09 | 1.08e-07 | 119 |
| GO:00069038 | Esophagus | ESCC | vesicle targeting | 38/8552 | 45/18723 | 8.42e-08 | 1.43e-06 | 38 |
| GO:00482844 | Esophagus | ESCC | organelle fusion | 94/8552 | 141/18723 | 3.72e-07 | 5.16e-06 | 94 |
| GO:00901743 | Esophagus | ESCC | organelle membrane fusion | 73/8552 | 110/18723 | 9.29e-06 | 8.88e-05 | 73 |
| GO:00069063 | Esophagus | ESCC | vesicle fusion | 70/8552 | 106/18723 | 1.82e-05 | 1.60e-04 | 70 |
| GO:00610254 | Esophagus | ESCC | membrane fusion | 98/8552 | 163/18723 | 1.39e-04 | 9.41e-04 | 98 |
| GO:004819311 | Liver | Cirrhotic | Golgi vesicle transport | 153/4634 | 296/18723 | 1.02e-23 | 6.43e-21 | 153 |
| GO:001605011 | Liver | Cirrhotic | vesicle organization | 133/4634 | 300/18723 | 7.35e-14 | 6.41e-12 | 133 |
| GO:000689211 | Liver | Cirrhotic | post-Golgi vesicle-mediated transport | 51/4634 | 104/18723 | 7.12e-08 | 2.15e-06 | 51 |
| GO:005165611 | Liver | Cirrhotic | establishment of organelle localization | 128/4634 | 390/18723 | 1.78e-04 | 1.67e-03 | 128 |
| GO:00069034 | Liver | Cirrhotic | vesicle targeting | 22/4634 | 45/18723 | 3.90e-04 | 3.23e-03 | 22 |
| GO:00482842 | Liver | Cirrhotic | organelle fusion | 52/4634 | 141/18723 | 8.77e-04 | 6.31e-03 | 52 |
| GO:005165011 | Liver | Cirrhotic | establishment of vesicle localization | 58/4634 | 161/18723 | 8.98e-04 | 6.44e-03 | 58 |
| GO:005164811 | Liver | Cirrhotic | vesicle localization | 62/4634 | 177/18723 | 1.37e-03 | 9.18e-03 | 62 |
| GO:0006906 | Liver | Cirrhotic | vesicle fusion | 40/4634 | 106/18723 | 2.01e-03 | 1.24e-02 | 40 |
| Page: 1 2 3 4 5 6 |
| Pathway ID | Tissue | Disease Stage | Description | Gene Ratio | Bg Ratio | pvalue | p.adjust | qvalue | Count |
| hsa041305 | Esophagus | ESCC | SNARE interactions in vesicular transport | 28/4205 | 33/8465 | 2.75e-05 | 1.32e-04 | 6.75e-05 | 28 |
| hsa0413012 | Esophagus | ESCC | SNARE interactions in vesicular transport | 28/4205 | 33/8465 | 2.75e-05 | 1.32e-04 | 6.75e-05 | 28 |
| hsa04130 | Liver | Cirrhotic | SNARE interactions in vesicular transport | 18/2530 | 33/8465 | 2.64e-03 | 1.10e-02 | 6.76e-03 | 18 |
| hsa041301 | Liver | Cirrhotic | SNARE interactions in vesicular transport | 18/2530 | 33/8465 | 2.64e-03 | 1.10e-02 | 6.76e-03 | 18 |
| hsa041302 | Liver | HCC | SNARE interactions in vesicular transport | 25/4020 | 33/8465 | 8.78e-04 | 3.38e-03 | 1.88e-03 | 25 |
| hsa046112 | Liver | HCC | Platelet activation | 71/4020 | 124/8465 | 1.77e-02 | 4.15e-02 | 2.31e-02 | 71 |
| hsa041303 | Liver | HCC | SNARE interactions in vesicular transport | 25/4020 | 33/8465 | 8.78e-04 | 3.38e-03 | 1.88e-03 | 25 |
| hsa0461111 | Liver | HCC | Platelet activation | 71/4020 | 124/8465 | 1.77e-02 | 4.15e-02 | 2.31e-02 | 71 |
| hsa041304 | Oral cavity | OSCC | SNARE interactions in vesicular transport | 28/3704 | 33/8465 | 1.31e-06 | 7.18e-06 | 3.66e-06 | 28 |
| hsa0413011 | Oral cavity | OSCC | SNARE interactions in vesicular transport | 28/3704 | 33/8465 | 1.31e-06 | 7.18e-06 | 3.66e-06 | 28 |
| hsa0413021 | Oral cavity | LP | SNARE interactions in vesicular transport | 22/2418 | 33/8465 | 6.00e-06 | 4.76e-05 | 3.07e-05 | 22 |
| hsa0413031 | Oral cavity | LP | SNARE interactions in vesicular transport | 22/2418 | 33/8465 | 6.00e-06 | 4.76e-05 | 3.07e-05 | 22 |
| hsa046116 | Oral cavity | EOLP | Platelet activation | 29/1218 | 124/8465 | 4.73e-03 | 1.48e-02 | 8.75e-03 | 29 |
| hsa0461114 | Oral cavity | EOLP | Platelet activation | 29/1218 | 124/8465 | 4.73e-03 | 1.48e-02 | 8.75e-03 | 29 |
| Page: 1 |
Top |
Cell-cell communication analysis |
| Identification of potential cell-cell interactions between two cell types and their ligand-receptor pairs for different disease states |
| Ligand | Receptor | LRpair | Pathway | Tissue | Disease Stage |
| Page: 1 |
Top |
Single-cell gene regulatory network inference analysis |
| Find out the significant the regulons (TFs) and the target genes of each regulon across cell types for different disease states |
| TF | Cell Type | Tissue | Disease Stage | Target Gene | RSS | Regulon Activity |
| ∗The dot plots of a searched regulon are shown for all cell subpopulations in each disease state of each tissue based on the regulon specific score inferred using pySCENIC and by calculating the average expression. |
| Page: 1 |
Top |
Somatic mutation of malignant transformation related genes |
| Annotation of somatic variants for genes involved in malignant transformation |
| Hugo Symbol | Variant Class | Variant Classification | dbSNP RS | HGVSc | HGVSp | HGVSp Short | SWISSPROT | BIOTYPE | SIFT | PolyPhen | Tumor Sample Barcode | Tissue | Histology | Sex | Age | Stage | Therapy Types | Drugs | Outcome |
| SNAP23 | SNV | Missense_Mutation | c.61N>G | p.Leu21Val | p.L21V | O00161 | protein_coding | tolerated(0.05) | possibly_damaging(0.879) | TCGA-E2-A14R-01 | Breast | breast invasive carcinoma | Female | <65 | I/II | Chemotherapy | doxorubicin | PD | |
| SNAP23 | SNV | Missense_Mutation | c.151N>G | p.Gln51Glu | p.Q51E | O00161 | protein_coding | deleterious(0.02) | benign(0.41) | TCGA-E2-A1II-01 | Breast | breast invasive carcinoma | Female | <65 | I/II | Chemotherapy | doxorubicin | SD | |
| SNAP23 | deletion | Frame_Shift_Del | c.339_340delNN | p.Val114SerfsTer3 | p.V114Sfs*3 | O00161 | protein_coding | TCGA-A8-A09V-01 | Breast | breast invasive carcinoma | Female | <65 | I/II | Hormone Therapy | tamoxiphen | SD | |||
| SNAP23 | SNV | Missense_Mutation | c.103N>G | p.Gln35Glu | p.Q35E | O00161 | protein_coding | tolerated(0.2) | benign(0.003) | TCGA-IR-A3LK-01 | Cervix | cervical & endocervical cancer | Female | >=65 | I/II | Chemotherapy | cisplatin | PD | |
| SNAP23 | SNV | Missense_Mutation | novel | c.200N>A | p.Arg67Lys | p.R67K | O00161 | protein_coding | tolerated(1) | benign(0) | TCGA-ZJ-AAXU-01 | Cervix | cervical & endocervical cancer | Female | <65 | I/II | Unknown | Unknown | SD |
| SNAP23 | SNV | Missense_Mutation | rs138813563 | c.424N>T | p.Arg142Cys | p.R142C | O00161 | protein_coding | deleterious(0) | probably_damaging(0.982) | TCGA-A5-A0G2-01 | Endometrium | uterine corpus endometrioid carcinoma | Female | <65 | III/IV | Unknown | Unknown | SD |
| SNAP23 | SNV | Missense_Mutation | c.618N>T | p.Lys206Asn | p.K206N | O00161 | protein_coding | tolerated(0.65) | benign(0.05) | TCGA-AJ-A3EL-01 | Endometrium | uterine corpus endometrioid carcinoma | Female | <65 | I/II | Unknown | Unknown | SD | |
| SNAP23 | SNV | Missense_Mutation | c.161G>A | p.Arg54His | p.R54H | O00161 | protein_coding | deleterious(0.04) | probably_damaging(0.953) | TCGA-AP-A0LM-01 | Endometrium | uterine corpus endometrioid carcinoma | Female | <65 | III/IV | Chemotherapy | cisplatin | SD | |
| SNAP23 | SNV | Missense_Mutation | c.425N>A | p.Arg142His | p.R142H | O00161 | protein_coding | tolerated(0.05) | benign(0.427) | TCGA-AX-A05Z-01 | Endometrium | uterine corpus endometrioid carcinoma | Female | <65 | III/IV | Chemotherapy | adriamycin | SD | |
| SNAP23 | SNV | Missense_Mutation | novel | c.586G>T | p.Asp196Tyr | p.D196Y | O00161 | protein_coding | tolerated(0.51) | possibly_damaging(0.722) | TCGA-AX-A2HC-01 | Endometrium | uterine corpus endometrioid carcinoma | Female | <65 | III/IV | Chemotherapy | paclitaxel | PD |
| Page: 1 2 |
Top |
Related drugs of malignant transformation related genes |
| Identification of chemicals and drugs interact with genes involved in malignant transfromation |
| (DGIdb 4.0) |
| Entrez ID | Symbol | Category | Interaction Types | Drug Claim Name | Drug Name | PMIDs |
| Page: 1 |

Copyright 2023-Present -The University of Texas Health Science Center at Houston |