
|
|||||
|
 | |
| |
| |
| |
| |
| |
|
Gene: SNAI2 |
Gene summary for SNAI2 |
| Gene information | Species | Human | Gene symbol | SNAI2 | Gene ID | 6591 |
| Gene name | snail family transcriptional repressor 2 | |
| Gene Alias | SLUG | |
| Cytomap | 8q11.21 | |
| Gene Type | protein-coding | GO ID | GO:0000122 | UniProtAcc | O43623 |
Top |
Malignant transformation analysis |
| Identification of the aberrant gene expression in precancerous and cancerous lesions by comparing the gene expression of stem-like cells in diseased tissues with normal stem cells |
| Entrez ID | Symbol | Replicates | Species | Organ | Tissue | Adj P-value | Log2FC | Malignancy |
| 6591 | SNAI2 | LZE4T | Human | Esophagus | ESCC | 7.04e-08 | 5.18e-01 | 0.0811 |
| 6591 | SNAI2 | P2T-E | Human | Esophagus | ESCC | 8.09e-25 | 6.78e-01 | 0.1177 |
| 6591 | SNAI2 | P4T-E | Human | Esophagus | ESCC | 2.85e-06 | 4.37e-01 | 0.1323 |
| 6591 | SNAI2 | P5T-E | Human | Esophagus | ESCC | 1.69e-14 | 3.65e-01 | 0.1327 |
| 6591 | SNAI2 | P8T-E | Human | Esophagus | ESCC | 7.07e-03 | -1.94e-02 | 0.0889 |
| 6591 | SNAI2 | P9T-E | Human | Esophagus | ESCC | 4.77e-13 | 6.01e-01 | 0.1131 |
| 6591 | SNAI2 | P10T-E | Human | Esophagus | ESCC | 2.78e-26 | 7.35e-01 | 0.116 |
| 6591 | SNAI2 | P11T-E | Human | Esophagus | ESCC | 4.46e-06 | 1.04e+00 | 0.1426 |
| 6591 | SNAI2 | P12T-E | Human | Esophagus | ESCC | 3.92e-11 | 5.65e-01 | 0.1122 |
| 6591 | SNAI2 | P15T-E | Human | Esophagus | ESCC | 1.80e-18 | 7.42e-01 | 0.1149 |
| 6591 | SNAI2 | P16T-E | Human | Esophagus | ESCC | 1.49e-41 | 1.16e+00 | 0.1153 |
| 6591 | SNAI2 | P20T-E | Human | Esophagus | ESCC | 7.73e-19 | 7.65e-01 | 0.1124 |
| 6591 | SNAI2 | P21T-E | Human | Esophagus | ESCC | 3.58e-26 | 1.07e+00 | 0.1617 |
| 6591 | SNAI2 | P22T-E | Human | Esophagus | ESCC | 1.94e-34 | 9.31e-01 | 0.1236 |
| 6591 | SNAI2 | P23T-E | Human | Esophagus | ESCC | 6.10e-10 | 8.17e-01 | 0.108 |
| 6591 | SNAI2 | P26T-E | Human | Esophagus | ESCC | 2.56e-26 | 8.40e-01 | 0.1276 |
| 6591 | SNAI2 | P27T-E | Human | Esophagus | ESCC | 3.40e-14 | 3.81e-01 | 0.1055 |
| 6591 | SNAI2 | P28T-E | Human | Esophagus | ESCC | 4.22e-07 | 3.55e-01 | 0.1149 |
| 6591 | SNAI2 | P30T-E | Human | Esophagus | ESCC | 8.36e-41 | 2.05e+00 | 0.137 |
| 6591 | SNAI2 | P31T-E | Human | Esophagus | ESCC | 3.75e-24 | 7.89e-01 | 0.1251 |
| Page: 1 2 3 4 5 |
| Tissue | Expression Dynamics | Abbreviation |
| Esophagus |  | ESCC: Esophageal squamous cell carcinoma |
| HGIN: High-grade intraepithelial neoplasias | ||
| LGIN: Low-grade intraepithelial neoplasias | ||
| Liver |  | HCC: Hepatocellular carcinoma |
| NAFLD: Non-alcoholic fatty liver disease | ||
| Oral Cavity |  | EOLP: Erosive Oral lichen planus |
| LP: leukoplakia | ||
| NEOLP: Non-erosive oral lichen planus | ||
| OSCC: Oral squamous cell carcinoma | ||
| Prostate | 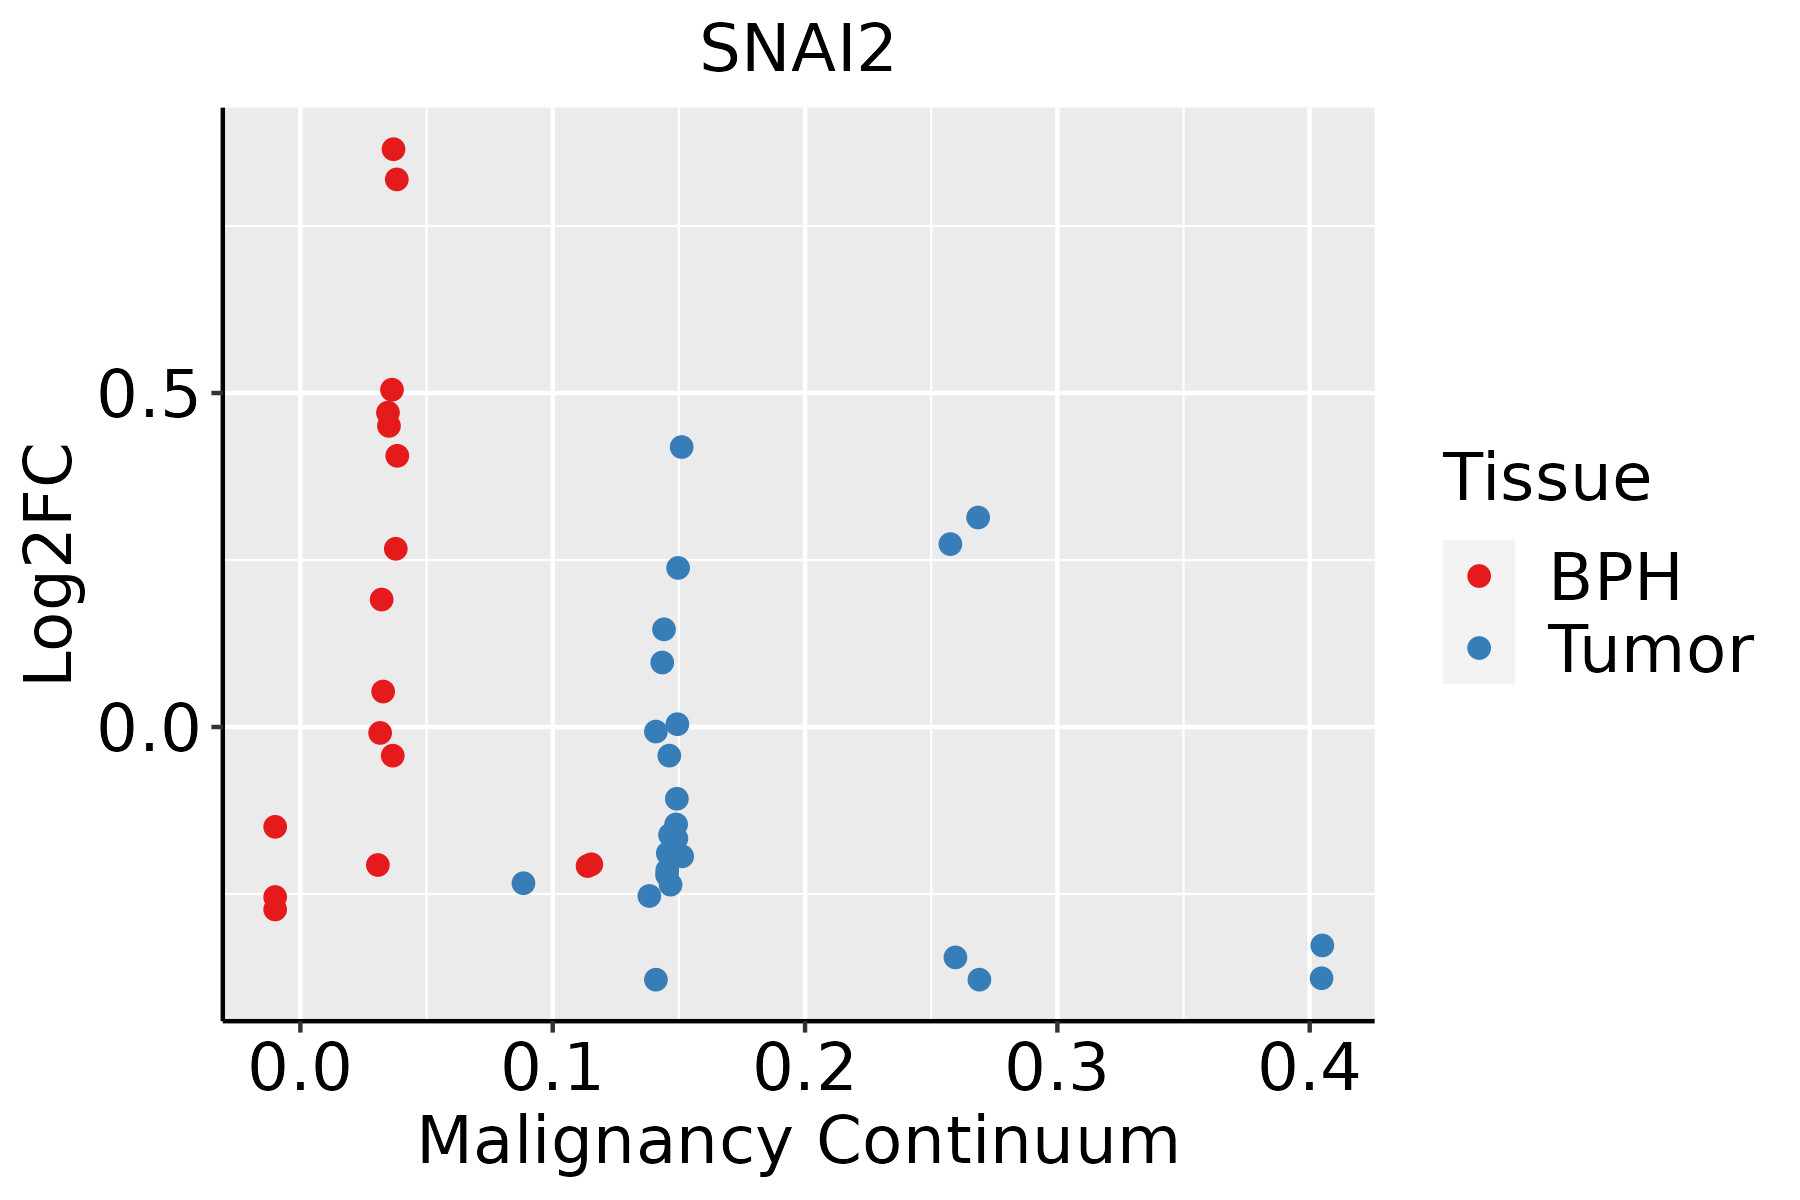 | BPH: Benign Prostatic Hyperplasia |
| Skin | 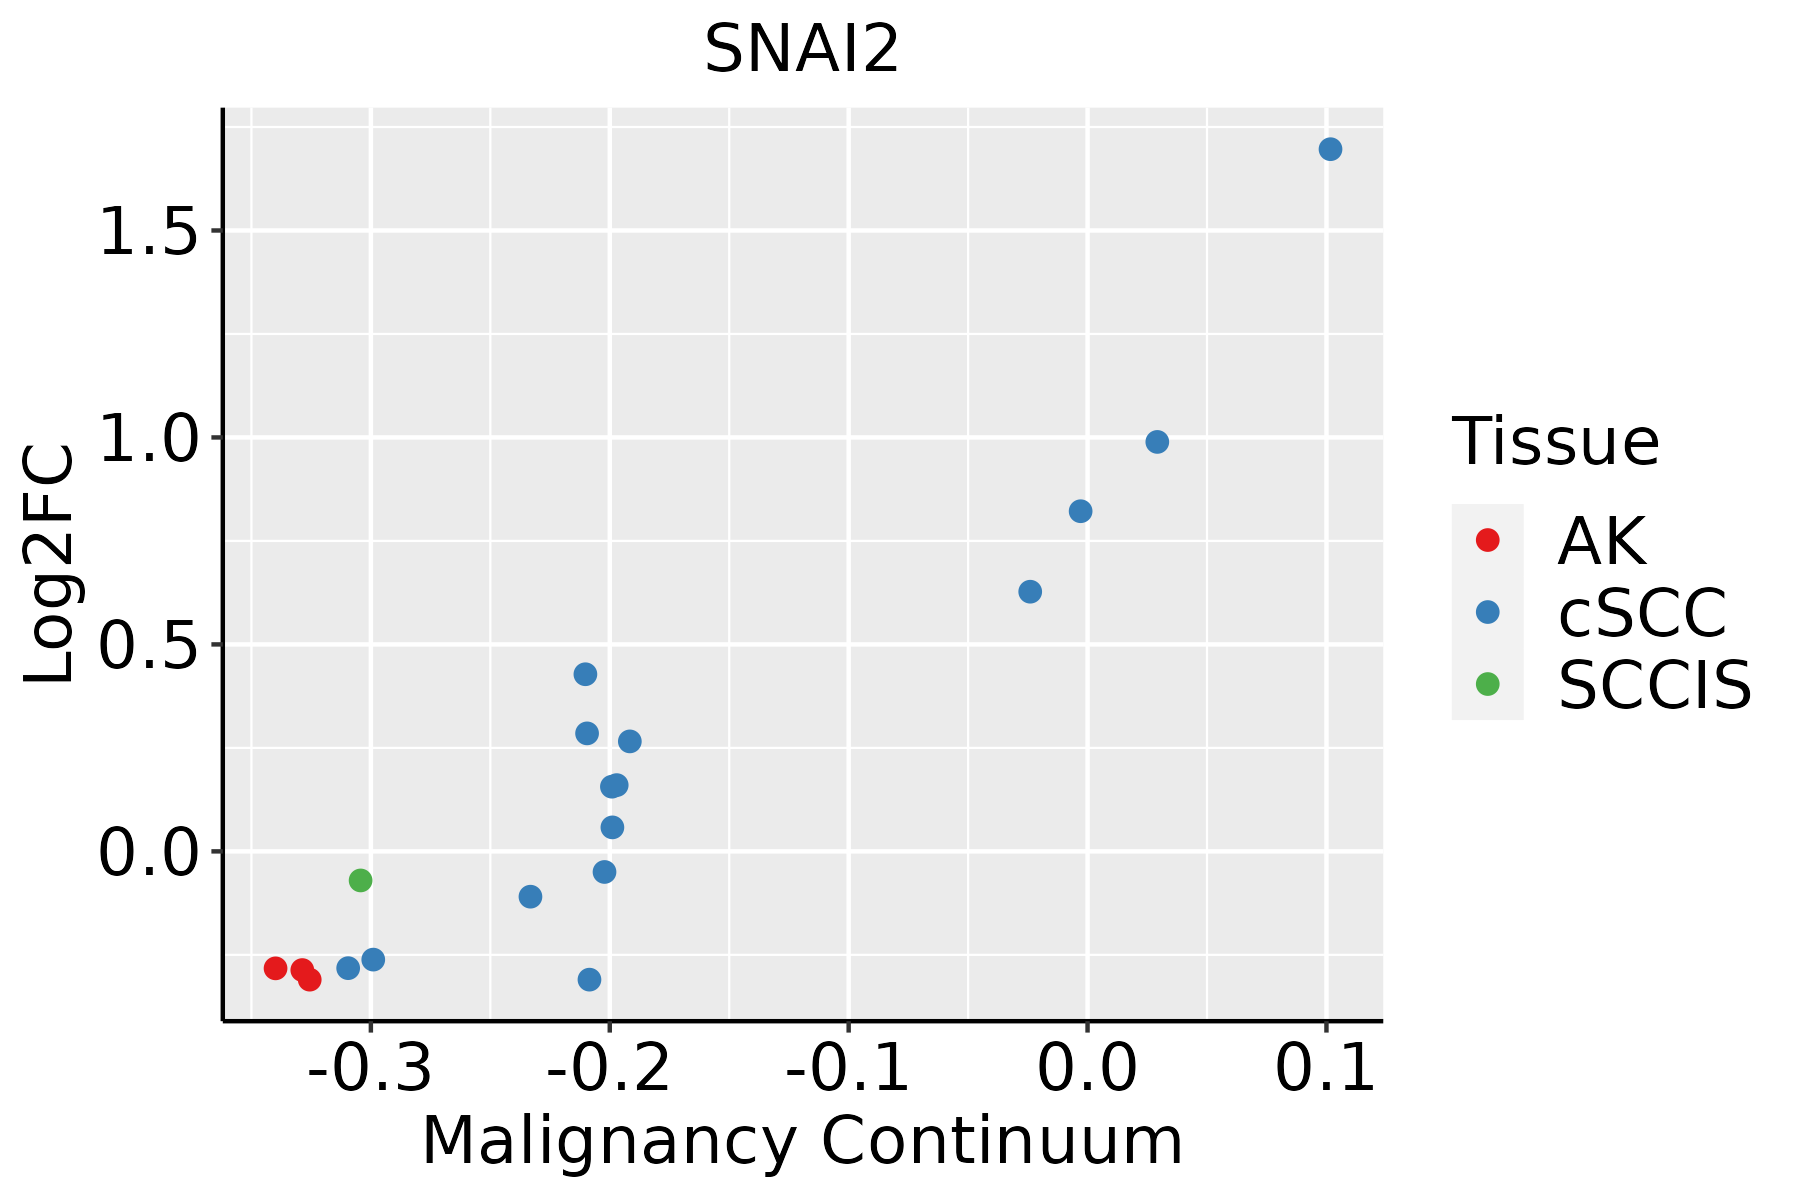 | AK: Actinic keratosis |
| cSCC: Cutaneous squamous cell carcinoma | ||
| SCCIS:squamous cell carcinoma in situ | ||
| Thyroid | 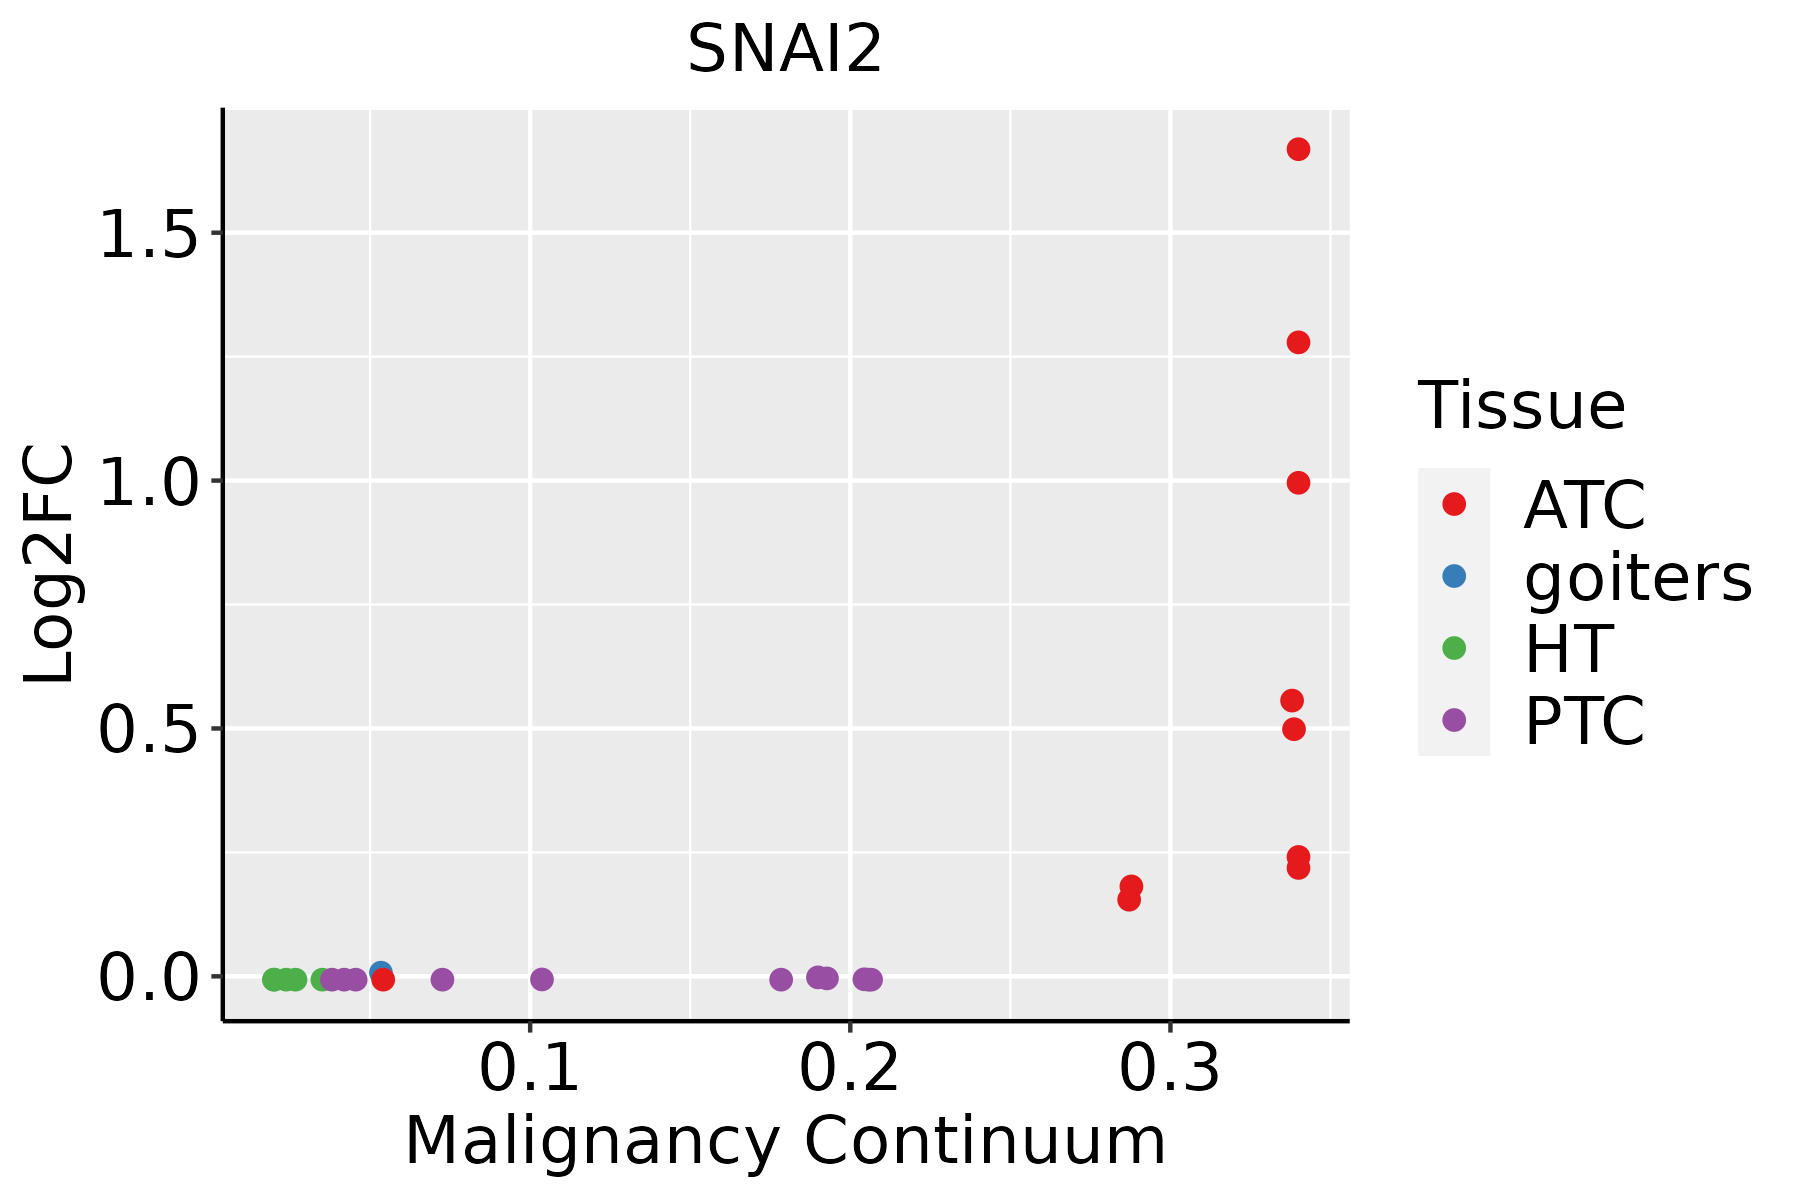 | ATC: Anaplastic thyroid cancer |
| HT: Hashimoto's thyroiditis | ||
| PTC: Papillary thyroid cancer |
| ∗log2FC in expression of this searched gene in stem-like cells from each diseased tissue sample relative to stem-like cells in normal samples in each tissue plotted against the malignancy continuum. Samples are colored based on if they are from different disease stage. |
Top |
Malignant transformation related pathway analysis |
| Find out the enriched GO biological processes and KEGG pathways involved in transition from healthy to precancer to cancer |
| Tissue | Disease Stage | Enriched GO biological Processes |
| Colorectum | AD |  |
| Colorectum | SER |  |
| Colorectum | MSS |  |
| Colorectum | MSI-H |  |
| Colorectum | FAP |  |
| ∗Top 15 enriched GO BP terms are showed in the bar plot of each disease state in each tissue. Each row represents a significant GO biological process which is colored according to the -log10(p.adjust). |
| Page: 1 2 3 4 5 6 7 8 9 |
| GO ID | Tissue | Disease Stage | Description | Gene Ratio | Bg Ratio | pvalue | p.adjust | Count |
| GO:0097193111 | Esophagus | ESCC | intrinsic apoptotic signaling pathway | 222/8552 | 288/18723 | 5.87e-28 | 2.02e-25 | 222 |
| GO:2001233111 | Esophagus | ESCC | regulation of apoptotic signaling pathway | 256/8552 | 356/18723 | 4.11e-24 | 1.04e-21 | 256 |
| GO:0022411111 | Esophagus | ESCC | cellular component disassembly | 305/8552 | 443/18723 | 1.94e-23 | 4.57e-21 | 305 |
| GO:2001242111 | Esophagus | ESCC | regulation of intrinsic apoptotic signaling pathway | 128/8552 | 164/18723 | 1.75e-17 | 1.50e-15 | 128 |
| GO:0097191111 | Esophagus | ESCC | extrinsic apoptotic signaling pathway | 159/8552 | 219/18723 | 4.12e-16 | 2.94e-14 | 159 |
| GO:2001234111 | Esophagus | ESCC | negative regulation of apoptotic signaling pathway | 161/8552 | 224/18723 | 1.24e-15 | 8.09e-14 | 161 |
| GO:0071496111 | Esophagus | ESCC | cellular response to external stimulus | 215/8552 | 320/18723 | 4.29e-15 | 2.43e-13 | 215 |
| GO:0072331111 | Esophagus | ESCC | signal transduction by p53 class mediator | 121/8552 | 163/18723 | 9.61e-14 | 4.69e-12 | 121 |
| GO:0031668111 | Esophagus | ESCC | cellular response to extracellular stimulus | 168/8552 | 246/18723 | 4.93e-13 | 2.23e-11 | 168 |
| GO:2001236111 | Esophagus | ESCC | regulation of extrinsic apoptotic signaling pathway | 111/8552 | 151/18723 | 2.97e-12 | 1.18e-10 | 111 |
| GO:0031669110 | Esophagus | ESCC | cellular response to nutrient levels | 148/8552 | 215/18723 | 4.58e-12 | 1.76e-10 | 148 |
| GO:2001243111 | Esophagus | ESCC | negative regulation of intrinsic apoptotic signaling pathway | 78/8552 | 98/18723 | 5.50e-12 | 2.10e-10 | 78 |
| GO:0031667111 | Esophagus | ESCC | response to nutrient levels | 289/8552 | 474/18723 | 9.25e-12 | 3.47e-10 | 289 |
| GO:0008630110 | Esophagus | ESCC | intrinsic apoptotic signaling pathway in response to DNA damage | 78/8552 | 99/18723 | 1.43e-11 | 5.08e-10 | 78 |
| GO:001605517 | Esophagus | ESCC | Wnt signaling pathway | 268/8552 | 444/18723 | 2.32e-10 | 6.58e-09 | 268 |
| GO:019873817 | Esophagus | ESCC | cell-cell signaling by wnt | 269/8552 | 446/18723 | 2.41e-10 | 6.79e-09 | 269 |
| GO:2001020110 | Esophagus | ESCC | regulation of response to DNA damage stimulus | 145/8552 | 219/18723 | 5.97e-10 | 1.50e-08 | 145 |
| GO:0030522110 | Esophagus | ESCC | intracellular receptor signaling pathway | 170/8552 | 265/18723 | 8.58e-10 | 2.09e-08 | 170 |
| GO:004277014 | Esophagus | ESCC | signal transduction in response to DNA damage | 117/8552 | 172/18723 | 2.38e-09 | 5.32e-08 | 117 |
| GO:1901796111 | Esophagus | ESCC | regulation of signal transduction by p53 class mediator | 70/8552 | 93/18723 | 5.69e-09 | 1.18e-07 | 70 |
| Page: 1 2 3 4 5 6 7 8 9 10 11 12 13 14 15 16 17 18 19 20 21 22 23 24 25 26 27 28 29 30 |
| Pathway ID | Tissue | Disease Stage | Description | Gene Ratio | Bg Ratio | pvalue | p.adjust | qvalue | Count |
| hsa0452030 | Esophagus | ESCC | Adherens junction | 69/4205 | 93/8465 | 1.08e-06 | 6.83e-06 | 3.50e-06 | 69 |
| hsa0439018 | Esophagus | ESCC | Hippo signaling pathway | 92/4205 | 157/8465 | 1.46e-02 | 3.31e-02 | 1.69e-02 | 92 |
| hsa04520114 | Esophagus | ESCC | Adherens junction | 69/4205 | 93/8465 | 1.08e-06 | 6.83e-06 | 3.50e-06 | 69 |
| hsa0439019 | Esophagus | ESCC | Hippo signaling pathway | 92/4205 | 157/8465 | 1.46e-02 | 3.31e-02 | 1.69e-02 | 92 |
| hsa0452029 | Oral cavity | OSCC | Adherens junction | 62/3704 | 93/8465 | 6.34e-06 | 3.12e-05 | 1.59e-05 | 62 |
| hsa0439016 | Oral cavity | OSCC | Hippo signaling pathway | 86/3704 | 157/8465 | 3.30e-03 | 8.24e-03 | 4.20e-03 | 86 |
| hsa04520113 | Oral cavity | OSCC | Adherens junction | 62/3704 | 93/8465 | 6.34e-06 | 3.12e-05 | 1.59e-05 | 62 |
| hsa0439017 | Oral cavity | OSCC | Hippo signaling pathway | 86/3704 | 157/8465 | 3.30e-03 | 8.24e-03 | 4.20e-03 | 86 |
| hsa0452027 | Prostate | BPH | Adherens junction | 55/1718 | 93/8465 | 1.90e-16 | 4.18e-15 | 2.59e-15 | 55 |
| hsa0439010 | Prostate | BPH | Hippo signaling pathway | 52/1718 | 157/8465 | 9.93e-05 | 6.00e-04 | 3.71e-04 | 52 |
| hsa04520112 | Prostate | BPH | Adherens junction | 55/1718 | 93/8465 | 1.90e-16 | 4.18e-15 | 2.59e-15 | 55 |
| hsa0439015 | Prostate | BPH | Hippo signaling pathway | 52/1718 | 157/8465 | 9.93e-05 | 6.00e-04 | 3.71e-04 | 52 |
| hsa0452028 | Prostate | Tumor | Adherens junction | 53/1791 | 93/8465 | 3.68e-14 | 8.11e-13 | 5.03e-13 | 53 |
| hsa0439024 | Prostate | Tumor | Hippo signaling pathway | 54/1791 | 157/8465 | 7.52e-05 | 5.30e-04 | 3.28e-04 | 54 |
| hsa0452036 | Prostate | Tumor | Adherens junction | 53/1791 | 93/8465 | 3.68e-14 | 8.11e-13 | 5.03e-13 | 53 |
| hsa0439034 | Prostate | Tumor | Hippo signaling pathway | 54/1791 | 157/8465 | 7.52e-05 | 5.30e-04 | 3.28e-04 | 54 |
| Page: 1 |
Top |
Cell-cell communication analysis |
| Identification of potential cell-cell interactions between two cell types and their ligand-receptor pairs for different disease states |
| Ligand | Receptor | LRpair | Pathway | Tissue | Disease Stage |
| Page: 1 |
Top |
Single-cell gene regulatory network inference analysis |
| Find out the significant the regulons (TFs) and the target genes of each regulon across cell types for different disease states |
| TF | Cell Type | Tissue | Disease Stage | Target Gene | RSS | Regulon Activity |
| SNAI2 | INCAF | Oral cavity | OSCC | PRSS23,LUM,GGT5, etc. | 4.71e-01 |  |
| SNAI2 | BN | Prostate | ADJ | FAM153CP,CRISPLD2,MTRNR2L1, etc. | 1.91e-02 |  |
| SNAI2 | PLA | Prostate | ADJ | FAM153CP,CRISPLD2,MTRNR2L1, etc. | 2.27e-02 | |
| SNAI2 | NKT | Prostate | ADJ | FAM153CP,CRISPLD2,MTRNR2L1, etc. | 4.60e-02 | |
| SNAI2 | pDC | Prostate | BPH | FAM153CP,CRISPLD2,MTRNR2L1, etc. | 2.14e-01 |  |
| SNAI2 | pDC | Prostate | Healthy | FAM153CP,CRISPLD2,MTRNR2L1, etc. | 1.74e-01 |  |
| SNAI2 | PLA | Prostate | Healthy | FAM153CP,CRISPLD2,MTRNR2L1, etc. | 1.18e-02 | |
| SNAI2 | PLA | Prostate | Tumor | FAM153CP,CRISPLD2,MTRNR2L1, etc. | 1.60e-02 |  |
| ∗The dot plots of a searched regulon are shown for all cell subpopulations in each disease state of each tissue based on the regulon specific score inferred using pySCENIC and by calculating the average expression. |
| Page: 1 |
Top |
Somatic mutation of malignant transformation related genes |
| Annotation of somatic variants for genes involved in malignant transformation |
| Hugo Symbol | Variant Class | Variant Classification | dbSNP RS | HGVSc | HGVSp | HGVSp Short | SWISSPROT | BIOTYPE | SIFT | PolyPhen | Tumor Sample Barcode | Tissue | Histology | Sex | Age | Stage | Therapy Types | Drugs | Outcome |
| SNAI2 | SNV | Missense_Mutation | novel | c.709N>A | p.Asp237Asn | p.D237N | O43623 | protein_coding | deleterious(0.01) | probably_damaging(0.982) | TCGA-D8-A27G-01 | Breast | breast invasive carcinoma | Female | >=65 | I/II | Unknown | Unknown | SD |
| SNAI2 | SNV | Missense_Mutation | novel | c.750N>A | p.Phe250Leu | p.F250L | O43623 | protein_coding | deleterious(0) | probably_damaging(1) | TCGA-2W-A8YY-01 | Cervix | cervical & endocervical cancer | Female | <65 | I/II | Chemotherapy | cisplatin | CR |
| SNAI2 | SNV | Missense_Mutation | novel | c.473N>A | p.Ser158Tyr | p.S158Y | O43623 | protein_coding | tolerated(1) | benign(0.025) | TCGA-2W-A8YY-01 | Cervix | cervical & endocervical cancer | Female | <65 | I/II | Chemotherapy | cisplatin | CR |
| SNAI2 | SNV | Missense_Mutation | novel | c.373N>A | p.Ala125Thr | p.A125T | O43623 | protein_coding | tolerated(0.11) | benign(0.283) | TCGA-2W-A8YY-01 | Cervix | cervical & endocervical cancer | Female | <65 | I/II | Chemotherapy | cisplatin | CR |
| SNAI2 | SNV | Missense_Mutation | c.89C>T | p.Ser30Phe | p.S30F | O43623 | protein_coding | tolerated(0.65) | possibly_damaging(0.459) | TCGA-AA-A00N-01 | Colorectum | colon adenocarcinoma | Male | >=65 | I/II | Unknown | Unknown | PD | |
| SNAI2 | SNV | Missense_Mutation | novel | c.783N>T | p.Glu261Asp | p.E261D | O43623 | protein_coding | tolerated(0.1) | benign(0.062) | TCGA-CA-6717-01 | Colorectum | colon adenocarcinoma | Male | <65 | I/II | Chemotherapy | oxaliplatin | CR |
| SNAI2 | SNV | Missense_Mutation | c.422N>T | p.Ser141Phe | p.S141F | O43623 | protein_coding | deleterious(0) | possibly_damaging(0.808) | TCGA-AG-3892-01 | Colorectum | rectum adenocarcinoma | Female | <65 | I/II | Unknown | Unknown | SD | |
| SNAI2 | SNV | Missense_Mutation | novel | c.359C>T | p.Pro120Leu | p.P120L | O43623 | protein_coding | deleterious(0.02) | benign(0.01) | TCGA-A5-A0G2-01 | Endometrium | uterine corpus endometrioid carcinoma | Female | <65 | III/IV | Unknown | Unknown | SD |
| SNAI2 | SNV | Missense_Mutation | novel | c.750C>A | p.Phe250Leu | p.F250L | O43623 | protein_coding | deleterious(0) | probably_damaging(1) | TCGA-A5-A2K5-01 | Endometrium | uterine corpus endometrioid carcinoma | Female | >=65 | I/II | Unknown | Unknown | SD |
| SNAI2 | SNV | Missense_Mutation | c.83N>G | p.Ile28Ser | p.I28S | O43623 | protein_coding | tolerated(0.5) | benign(0.006) | TCGA-AX-A05Z-01 | Endometrium | uterine corpus endometrioid carcinoma | Female | <65 | III/IV | Chemotherapy | adriamycin | SD |
| Page: 1 2 3 4 |
Top |
Related drugs of malignant transformation related genes |
| Identification of chemicals and drugs interact with genes involved in malignant transfromation |
| (DGIdb 4.0) |
| Entrez ID | Symbol | Category | Interaction Types | Drug Claim Name | Drug Name | PMIDs |
| Page: 1 |

Copyright 2023-Present -The University of Texas Health Science Center at Houston |