
|
|||||
|
 | |
| |
| |
| |
| |
| |
|
Gene: SNAI1 |
Gene summary for SNAI1 |
| Gene information | Species | Human | Gene symbol | SNAI1 | Gene ID | 6615 |
| Gene name | snail family transcriptional repressor 1 | |
| Gene Alias | SLUGH2 | |
| Cytomap | 20q13.13 | |
| Gene Type | protein-coding | GO ID | GO:0000003 | UniProtAcc | O95863 |
Top |
Malignant transformation analysis |
| Identification of the aberrant gene expression in precancerous and cancerous lesions by comparing the gene expression of stem-like cells in diseased tissues with normal stem cells |
| Entrez ID | Symbol | Replicates | Species | Organ | Tissue | Adj P-value | Log2FC | Malignancy |
| 6615 | SNAI1 | LZE4T | Human | Esophagus | ESCC | 1.40e-02 | 2.17e-01 | 0.0811 |
| 6615 | SNAI1 | LZE20T | Human | Esophagus | ESCC | 2.10e-03 | 2.26e-01 | 0.0662 |
| 6615 | SNAI1 | P1T-E | Human | Esophagus | ESCC | 1.86e-03 | 2.53e-01 | 0.0875 |
| 6615 | SNAI1 | P2T-E | Human | Esophagus | ESCC | 3.75e-03 | 8.64e-02 | 0.1177 |
| 6615 | SNAI1 | P4T-E | Human | Esophagus | ESCC | 1.18e-11 | 2.97e-01 | 0.1323 |
| 6615 | SNAI1 | P5T-E | Human | Esophagus | ESCC | 8.84e-36 | 7.06e-01 | 0.1327 |
| 6615 | SNAI1 | P8T-E | Human | Esophagus | ESCC | 1.48e-03 | 1.35e-01 | 0.0889 |
| 6615 | SNAI1 | P10T-E | Human | Esophagus | ESCC | 8.56e-12 | 2.35e-01 | 0.116 |
| 6615 | SNAI1 | P11T-E | Human | Esophagus | ESCC | 9.13e-22 | 1.30e+00 | 0.1426 |
| 6615 | SNAI1 | P12T-E | Human | Esophagus | ESCC | 2.37e-17 | 3.39e-01 | 0.1122 |
| 6615 | SNAI1 | P15T-E | Human | Esophagus | ESCC | 8.11e-25 | 5.92e-01 | 0.1149 |
| 6615 | SNAI1 | P16T-E | Human | Esophagus | ESCC | 1.30e-06 | 2.08e-01 | 0.1153 |
| 6615 | SNAI1 | P20T-E | Human | Esophagus | ESCC | 1.01e-11 | 3.00e-01 | 0.1124 |
| 6615 | SNAI1 | P22T-E | Human | Esophagus | ESCC | 9.53e-09 | 2.24e-01 | 0.1236 |
| 6615 | SNAI1 | P23T-E | Human | Esophagus | ESCC | 5.94e-07 | 3.38e-01 | 0.108 |
| 6615 | SNAI1 | P24T-E | Human | Esophagus | ESCC | 2.02e-06 | 1.54e-01 | 0.1287 |
| 6615 | SNAI1 | P26T-E | Human | Esophagus | ESCC | 2.05e-07 | 1.73e-01 | 0.1276 |
| 6615 | SNAI1 | P27T-E | Human | Esophagus | ESCC | 9.44e-07 | 1.27e-01 | 0.1055 |
| 6615 | SNAI1 | P28T-E | Human | Esophagus | ESCC | 1.12e-09 | 2.39e-01 | 0.1149 |
| 6615 | SNAI1 | P31T-E | Human | Esophagus | ESCC | 1.76e-12 | 2.83e-01 | 0.1251 |
| Page: 1 2 3 |
| Tissue | Expression Dynamics | Abbreviation |
| Esophagus | 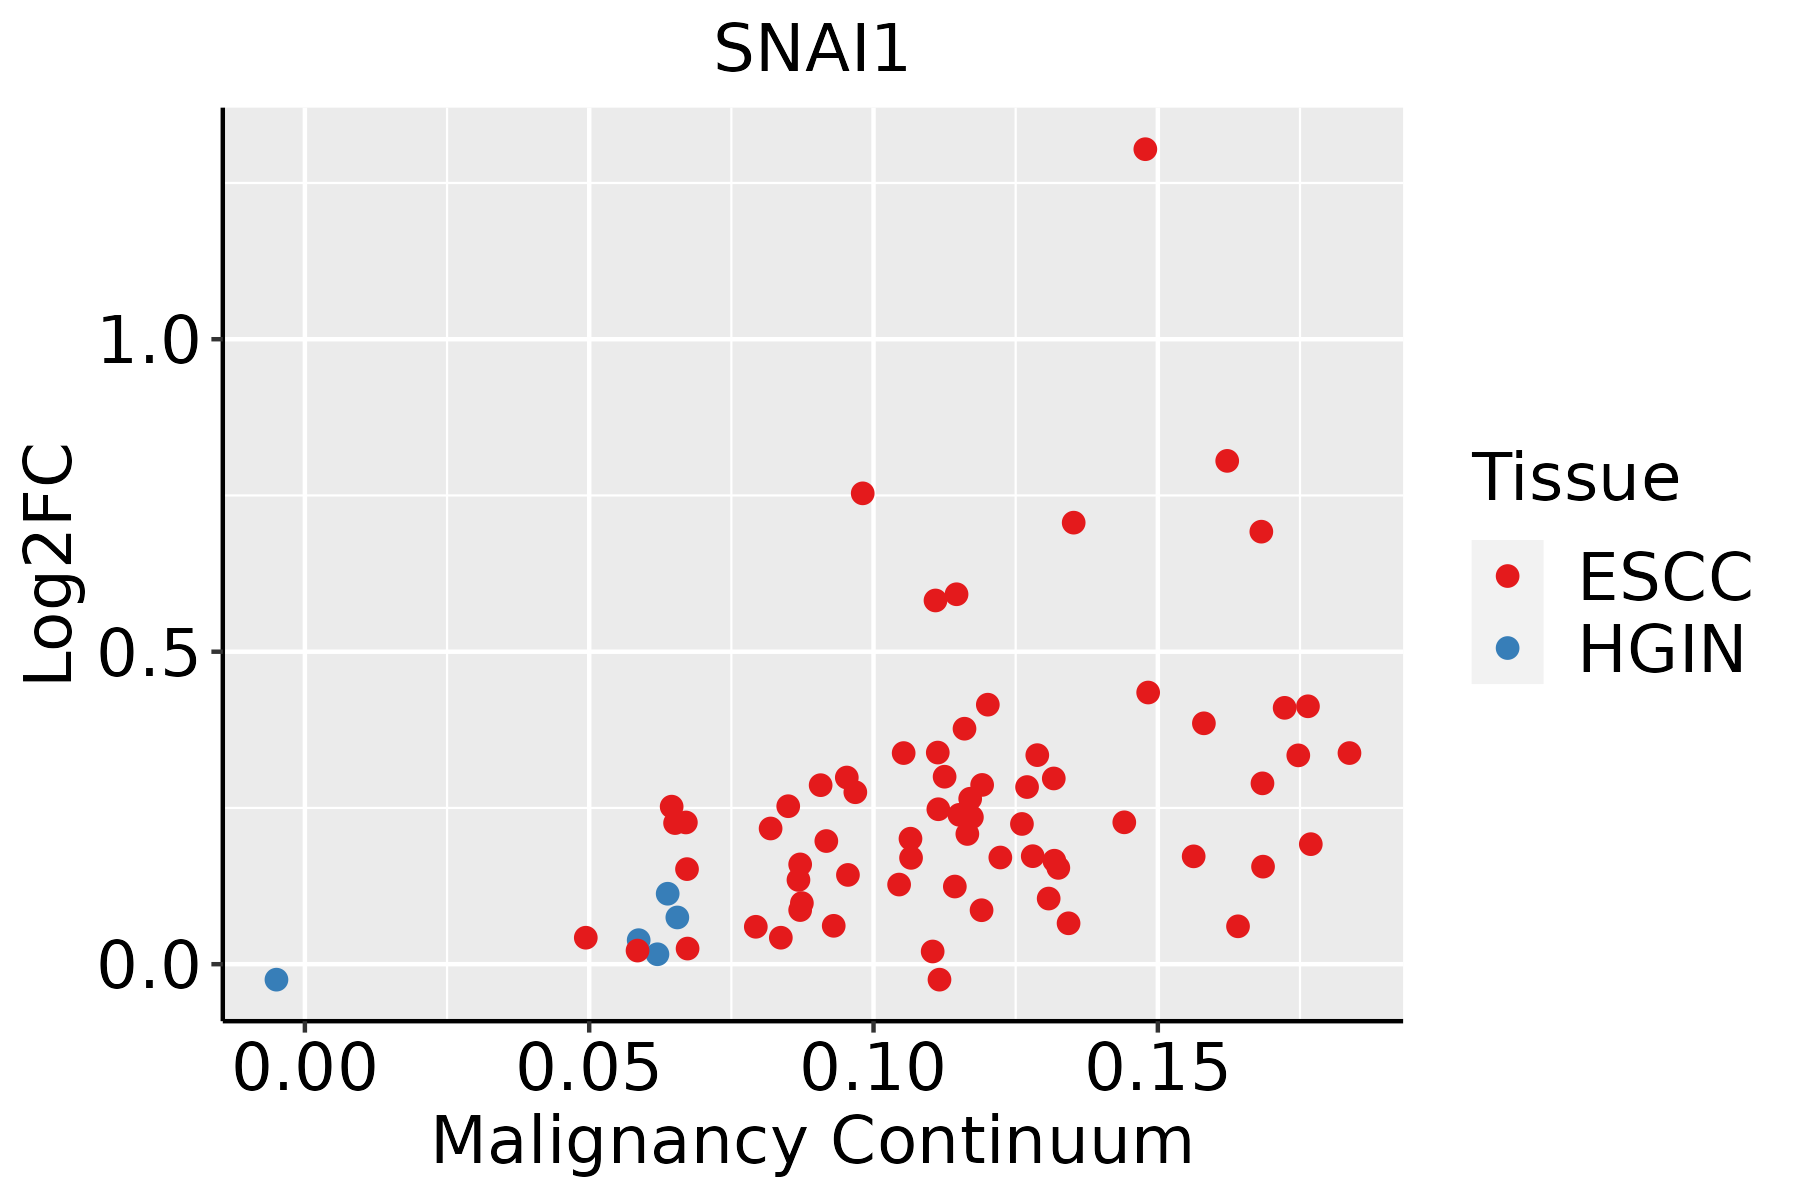 | ESCC: Esophageal squamous cell carcinoma |
| HGIN: High-grade intraepithelial neoplasias | ||
| LGIN: Low-grade intraepithelial neoplasias |
| ∗log2FC in expression of this searched gene in stem-like cells from each diseased tissue sample relative to stem-like cells in normal samples in each tissue plotted against the malignancy continuum. Samples are colored based on if they are from different disease stage. |
Top |
Malignant transformation related pathway analysis |
| Find out the enriched GO biological processes and KEGG pathways involved in transition from healthy to precancer to cancer |
| Tissue | Disease Stage | Enriched GO biological Processes |
| Colorectum | AD |  |
| Colorectum | SER |  |
| Colorectum | MSS |  |
| Colorectum | MSI-H |  |
| Colorectum | FAP |  |
| ∗Top 15 enriched GO BP terms are showed in the bar plot of each disease state in each tissue. Each row represents a significant GO biological process which is colored according to the -log10(p.adjust). |
| Page: 1 2 3 4 5 6 7 8 9 |
| GO ID | Tissue | Disease Stage | Description | Gene Ratio | Bg Ratio | pvalue | p.adjust | Count |
| GO:0097193111 | Esophagus | ESCC | intrinsic apoptotic signaling pathway | 222/8552 | 288/18723 | 5.87e-28 | 2.02e-25 | 222 |
| GO:2001233111 | Esophagus | ESCC | regulation of apoptotic signaling pathway | 256/8552 | 356/18723 | 4.11e-24 | 1.04e-21 | 256 |
| GO:2001242111 | Esophagus | ESCC | regulation of intrinsic apoptotic signaling pathway | 128/8552 | 164/18723 | 1.75e-17 | 1.50e-15 | 128 |
| GO:000170119 | Esophagus | ESCC | in utero embryonic development | 243/8552 | 367/18723 | 1.00e-15 | 6.86e-14 | 243 |
| GO:2001234111 | Esophagus | ESCC | negative regulation of apoptotic signaling pathway | 161/8552 | 224/18723 | 1.24e-15 | 8.09e-14 | 161 |
| GO:0072331111 | Esophagus | ESCC | signal transduction by p53 class mediator | 121/8552 | 163/18723 | 9.61e-14 | 4.69e-12 | 121 |
| GO:2001243111 | Esophagus | ESCC | negative regulation of intrinsic apoptotic signaling pathway | 78/8552 | 98/18723 | 5.50e-12 | 2.10e-10 | 78 |
| GO:0008630110 | Esophagus | ESCC | intrinsic apoptotic signaling pathway in response to DNA damage | 78/8552 | 99/18723 | 1.43e-11 | 5.08e-10 | 78 |
| GO:2001020110 | Esophagus | ESCC | regulation of response to DNA damage stimulus | 145/8552 | 219/18723 | 5.97e-10 | 1.50e-08 | 145 |
| GO:004277014 | Esophagus | ESCC | signal transduction in response to DNA damage | 117/8552 | 172/18723 | 2.38e-09 | 5.32e-08 | 117 |
| GO:1901796111 | Esophagus | ESCC | regulation of signal transduction by p53 class mediator | 70/8552 | 93/18723 | 5.69e-09 | 1.18e-07 | 70 |
| GO:0001890110 | Esophagus | ESCC | placenta development | 98/8552 | 144/18723 | 4.46e-08 | 8.11e-07 | 98 |
| GO:00435888 | Esophagus | ESCC | skin development | 163/8552 | 263/18723 | 6.48e-08 | 1.14e-06 | 163 |
| GO:000632517 | Esophagus | ESCC | chromatin organization | 240/8552 | 409/18723 | 6.52e-08 | 1.14e-06 | 240 |
| GO:0061458110 | Esophagus | ESCC | reproductive system development | 247/8552 | 427/18723 | 2.24e-07 | 3.42e-06 | 247 |
| GO:004860818 | Esophagus | ESCC | reproductive structure development | 245/8552 | 424/18723 | 2.82e-07 | 4.14e-06 | 245 |
| GO:000854410 | Esophagus | ESCC | epidermis development | 193/8552 | 324/18723 | 2.87e-07 | 4.19e-06 | 193 |
| GO:0030330110 | Esophagus | ESCC | DNA damage response, signal transduction by p53 class mediator | 53/8552 | 72/18723 | 1.34e-06 | 1.63e-05 | 53 |
| GO:000164918 | Esophagus | ESCC | osteoblast differentiation | 140/8552 | 229/18723 | 1.63e-06 | 1.95e-05 | 140 |
| GO:000150317 | Esophagus | ESCC | ossification | 232/8552 | 408/18723 | 3.00e-06 | 3.40e-05 | 232 |
| Page: 1 2 3 |
| Pathway ID | Tissue | Disease Stage | Description | Gene Ratio | Bg Ratio | pvalue | p.adjust | qvalue | Count |
| hsa0452030 | Esophagus | ESCC | Adherens junction | 69/4205 | 93/8465 | 1.08e-06 | 6.83e-06 | 3.50e-06 | 69 |
| hsa04520114 | Esophagus | ESCC | Adherens junction | 69/4205 | 93/8465 | 1.08e-06 | 6.83e-06 | 3.50e-06 | 69 |
| Page: 1 |
Top |
Cell-cell communication analysis |
| Identification of potential cell-cell interactions between two cell types and their ligand-receptor pairs for different disease states |
| Ligand | Receptor | LRpair | Pathway | Tissue | Disease Stage |
| Page: 1 |
Top |
Single-cell gene regulatory network inference analysis |
| Find out the significant the regulons (TFs) and the target genes of each regulon across cell types for different disease states |
| TF | Cell Type | Tissue | Disease Stage | Target Gene | RSS | Regulon Activity |
| SNAI1 | LUMP | Breast | DCIS | CD83,AC103591.3,RARRES2, etc. | 7.42e-02 |  |
| SNAI1 | KER | Cervix | CC | GPR183,TAGAP,ARL4C, etc. | 5.23e-02 |  |
| SNAI1 | M2MAC | Cervix | ADJ | IFITM3,VEGFA,NLRP3, etc. | 1.80e-01 |  |
| SNAI1 | INMON | Cervix | ADJ | IFITM3,VEGFA,NLRP3, etc. | 1.14e-01 | |
| SNAI1 | MON | Cervix | CC | IFITM3,VEGFA,NLRP3, etc. | 1.94e-01 | |
| SNAI1 | INMON | Cervix | Healthy | IFITM3,VEGFA,NLRP3, etc. | 3.56e-02 |  |
| SNAI1 | INMON | Cervix | HSIL_HPV | IFITM3,VEGFA,NLRP3, etc. | 2.87e-01 |  |
| SNAI1 | M2MAC | Cervix | HSIL_HPV | IFITM3,VEGFA,NLRP3, etc. | 1.03e-01 | |
| SNAI1 | CD8TCM | Endometrium | ADJ | HSPA1B,CUBN,PHLDA2, etc. | 1.71e-01 |  |
| SNAI1 | CD8TEXINT | Endometrium | ADJ | HSPA1B,CUBN,PHLDA2, etc. | 1.07e-01 | |
| ∗The dot plots of a searched regulon are shown for all cell subpopulations in each disease state of each tissue based on the regulon specific score inferred using pySCENIC and by calculating the average expression. |
| Page: 1 2 3 |
Top |
Somatic mutation of malignant transformation related genes |
| Annotation of somatic variants for genes involved in malignant transformation |
| Hugo Symbol | Variant Class | Variant Classification | dbSNP RS | HGVSc | HGVSp | HGVSp Short | SWISSPROT | BIOTYPE | SIFT | PolyPhen | Tumor Sample Barcode | Tissue | Histology | Sex | Age | Stage | Therapy Types | Drugs | Outcome |
| SNAI1 | SNV | Missense_Mutation | c.728G>A | p.Arg243Gln | p.R243Q | O95863 | protein_coding | deleterious(0.01) | probably_damaging(0.957) | TCGA-A1-A0SJ-01 | Breast | breast invasive carcinoma | Female | <65 | III/IV | Unknown | Unknown | SD | |
| SNAI1 | SNV | Missense_Mutation | c.658N>T | p.Arg220Cys | p.R220C | O95863 | protein_coding | deleterious(0) | probably_damaging(0.997) | TCGA-A7-A13F-01 | Breast | breast invasive carcinoma | Female | <65 | III/IV | Chemotherapy | doxorubicin | SD | |
| SNAI1 | SNV | Missense_Mutation | rs369673182 | c.541N>A | p.Val181Ile | p.V181I | O95863 | protein_coding | tolerated(0.16) | probably_damaging(0.997) | TCGA-2W-A8YY-01 | Cervix | cervical & endocervical cancer | Female | <65 | I/II | Chemotherapy | cisplatin | CR |
| SNAI1 | SNV | Missense_Mutation | c.740N>C | p.Arg247Pro | p.R247P | O95863 | protein_coding | deleterious(0) | probably_damaging(0.999) | TCGA-DS-A0VM-01 | Cervix | cervical & endocervical cancer | Female | <65 | I/II | Chemotherapy | cisplatin | PD | |
| SNAI1 | SNV | Missense_Mutation | c.559N>G | p.Lys187Glu | p.K187E | O95863 | protein_coding | deleterious(0) | probably_damaging(0.998) | TCGA-A6-5665-01 | Colorectum | colon adenocarcinoma | Female | >=65 | I/II | Unknown | Unknown | PD | |
| SNAI1 | SNV | Missense_Mutation | c.659G>A | p.Arg220His | p.R220H | O95863 | protein_coding | deleterious(0) | probably_damaging(0.997) | TCGA-A6-6782-01 | Colorectum | colon adenocarcinoma | Male | >=65 | I/II | Unknown | Unknown | SD | |
| SNAI1 | SNV | Missense_Mutation | c.727N>T | p.Arg243Trp | p.R243W | O95863 | protein_coding | deleterious(0) | probably_damaging(0.995) | TCGA-AA-3821-01 | Colorectum | colon adenocarcinoma | Female | >=65 | I/II | Unknown | Unknown | SD | |
| SNAI1 | SNV | Missense_Mutation | c.613N>A | p.Glu205Lys | p.E205K | O95863 | protein_coding | deleterious(0.01) | probably_damaging(0.999) | TCGA-AA-3845-01 | Colorectum | colon adenocarcinoma | Female | >=65 | I/II | Unknown | Unknown | PD | |
| SNAI1 | SNV | Missense_Mutation | c.613N>A | p.Glu205Lys | p.E205K | O95863 | protein_coding | deleterious(0.01) | probably_damaging(0.999) | TCGA-D5-6928-01 | Colorectum | colon adenocarcinoma | Male | >=65 | I/II | Unknown | Unknown | SD | |
| SNAI1 | SNV | Missense_Mutation | c.613G>A | p.Glu205Lys | p.E205K | O95863 | protein_coding | deleterious(0.01) | probably_damaging(0.999) | TCGA-F5-6571-01 | Colorectum | rectum adenocarcinoma | Female | <65 | I/II | Chemotherapy | capecitabine | SD |
| Page: 1 2 3 4 |
Top |
Related drugs of malignant transformation related genes |
| Identification of chemicals and drugs interact with genes involved in malignant transfromation |
| (DGIdb 4.0) |
| Entrez ID | Symbol | Category | Interaction Types | Drug Claim Name | Drug Name | PMIDs |
| Page: 1 |

Copyright 2023-Present -The University of Texas Health Science Center at Houston |