
|
|||||
|
 | |
| |
| |
| |
| |
| |
|
Gene: SMYD5 |
Gene summary for SMYD5 |
| Gene information | Species | Human | Gene symbol | SMYD5 | Gene ID | 10322 |
| Gene name | SMYD family member 5 | |
| Gene Alias | NN8-4AG | |
| Cytomap | 2p13.2 | |
| Gene Type | protein-coding | GO ID | GO:0006464 | UniProtAcc | Q6GMV2 |
Top |
Malignant transformation analysis |
| Identification of the aberrant gene expression in precancerous and cancerous lesions by comparing the gene expression of stem-like cells in diseased tissues with normal stem cells |
| Entrez ID | Symbol | Replicates | Species | Organ | Tissue | Adj P-value | Log2FC | Malignancy |
| 10322 | SMYD5 | LZE24T | Human | Esophagus | ESCC | 3.11e-04 | 1.08e-01 | 0.0596 |
| 10322 | SMYD5 | P2T-E | Human | Esophagus | ESCC | 5.36e-14 | 2.56e-01 | 0.1177 |
| 10322 | SMYD5 | P5T-E | Human | Esophagus | ESCC | 2.51e-02 | 1.23e-01 | 0.1327 |
| 10322 | SMYD5 | P8T-E | Human | Esophagus | ESCC | 2.94e-12 | 1.10e-01 | 0.0889 |
| 10322 | SMYD5 | P10T-E | Human | Esophagus | ESCC | 8.94e-06 | 1.24e-01 | 0.116 |
| 10322 | SMYD5 | P11T-E | Human | Esophagus | ESCC | 1.68e-02 | 2.17e-01 | 0.1426 |
| 10322 | SMYD5 | P12T-E | Human | Esophagus | ESCC | 6.00e-09 | 1.42e-01 | 0.1122 |
| 10322 | SMYD5 | P15T-E | Human | Esophagus | ESCC | 3.50e-08 | 1.83e-01 | 0.1149 |
| 10322 | SMYD5 | P16T-E | Human | Esophagus | ESCC | 1.68e-12 | 1.53e-01 | 0.1153 |
| 10322 | SMYD5 | P19T-E | Human | Esophagus | ESCC | 1.60e-02 | 2.62e-01 | 0.1662 |
| 10322 | SMYD5 | P20T-E | Human | Esophagus | ESCC | 2.46e-03 | 6.13e-02 | 0.1124 |
| 10322 | SMYD5 | P21T-E | Human | Esophagus | ESCC | 4.24e-18 | 3.10e-01 | 0.1617 |
| 10322 | SMYD5 | P22T-E | Human | Esophagus | ESCC | 4.08e-04 | 1.20e-01 | 0.1236 |
| 10322 | SMYD5 | P23T-E | Human | Esophagus | ESCC | 1.54e-06 | 1.58e-01 | 0.108 |
| 10322 | SMYD5 | P24T-E | Human | Esophagus | ESCC | 1.13e-13 | 1.52e-01 | 0.1287 |
| 10322 | SMYD5 | P26T-E | Human | Esophagus | ESCC | 1.31e-10 | 1.83e-01 | 0.1276 |
| 10322 | SMYD5 | P27T-E | Human | Esophagus | ESCC | 9.85e-13 | 1.40e-01 | 0.1055 |
| 10322 | SMYD5 | P28T-E | Human | Esophagus | ESCC | 1.39e-16 | 3.03e-01 | 0.1149 |
| 10322 | SMYD5 | P30T-E | Human | Esophagus | ESCC | 3.04e-09 | 3.35e-01 | 0.137 |
| 10322 | SMYD5 | P31T-E | Human | Esophagus | ESCC | 1.51e-11 | 1.26e-01 | 0.1251 |
| Page: 1 2 3 4 |
| Tissue | Expression Dynamics | Abbreviation |
| Esophagus | 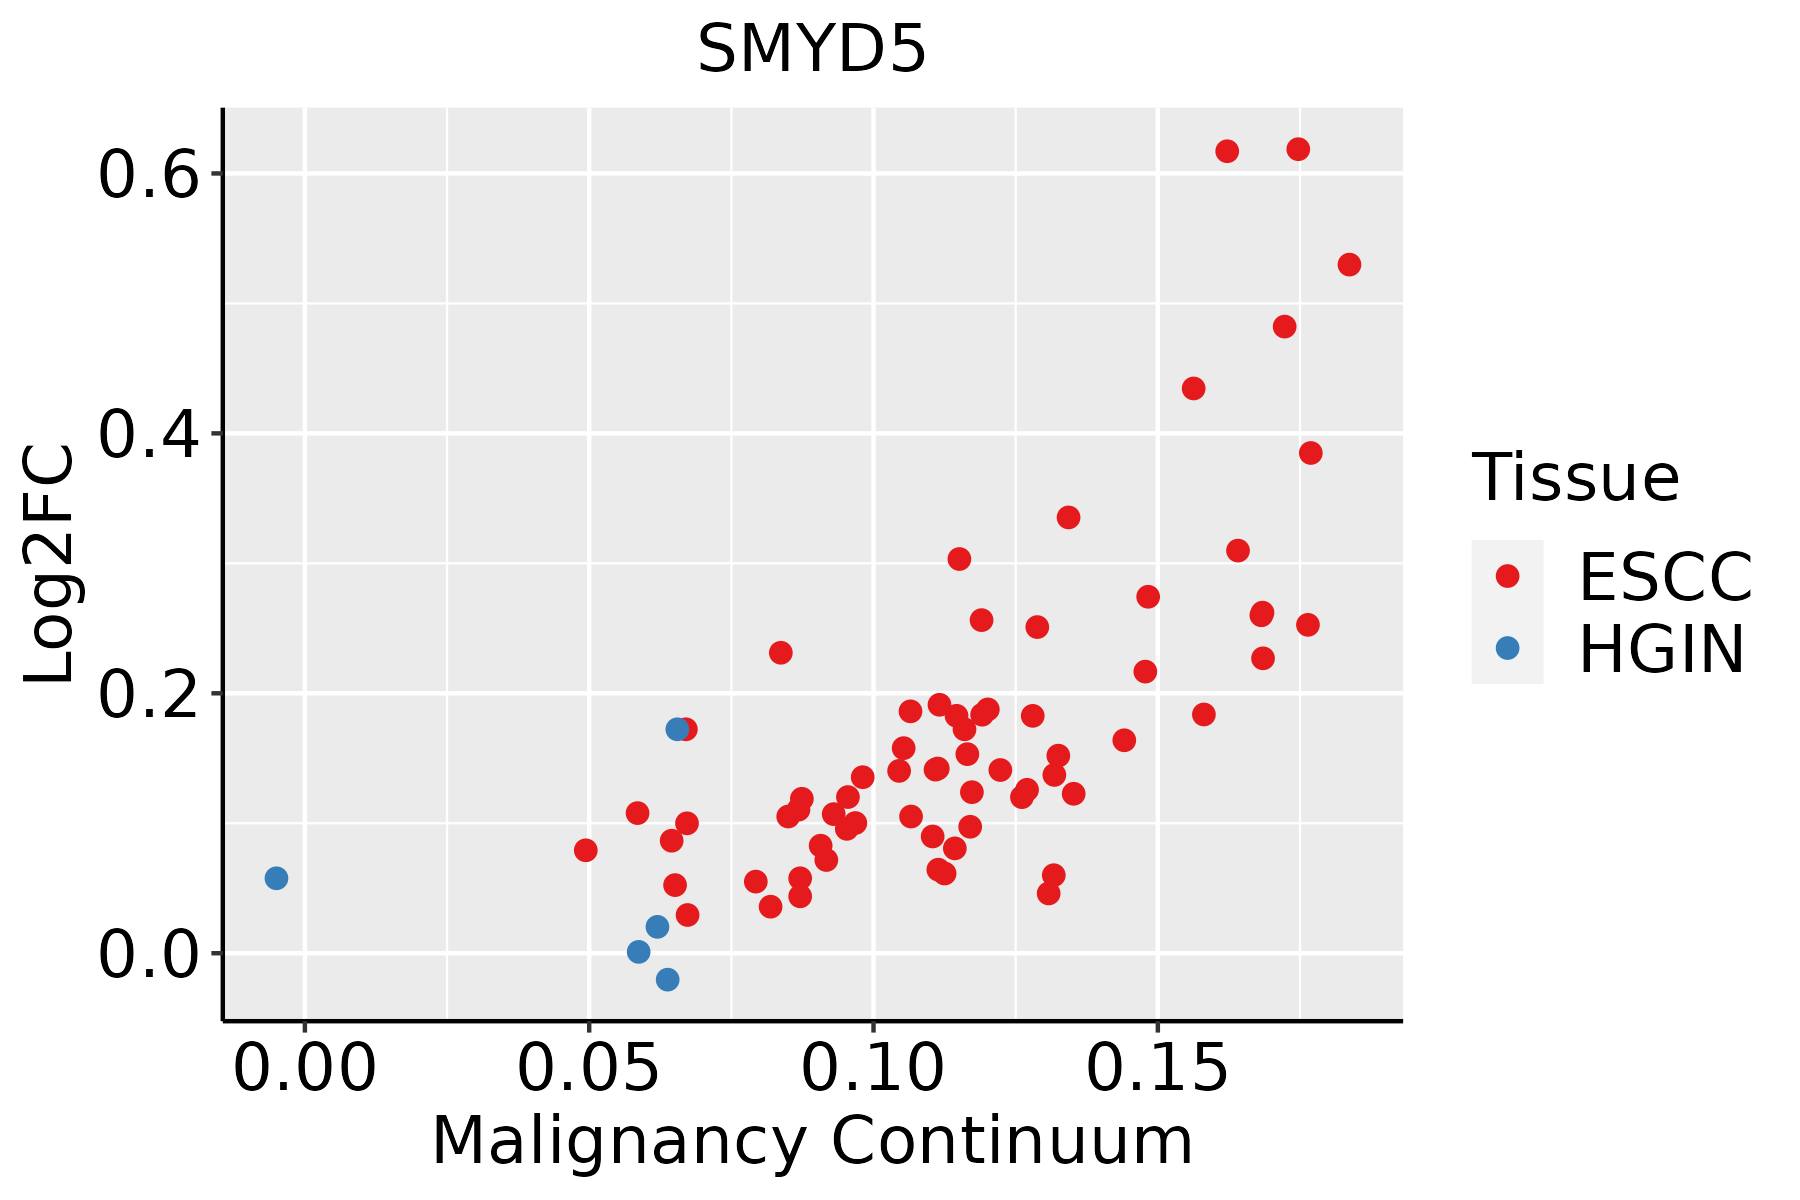 | ESCC: Esophageal squamous cell carcinoma |
| HGIN: High-grade intraepithelial neoplasias | ||
| LGIN: Low-grade intraepithelial neoplasias | ||
| Liver |  | HCC: Hepatocellular carcinoma |
| NAFLD: Non-alcoholic fatty liver disease | ||
| Oral Cavity |  | EOLP: Erosive Oral lichen planus |
| LP: leukoplakia | ||
| NEOLP: Non-erosive oral lichen planus | ||
| OSCC: Oral squamous cell carcinoma |
| ∗log2FC in expression of this searched gene in stem-like cells from each diseased tissue sample relative to stem-like cells in normal samples in each tissue plotted against the malignancy continuum. Samples are colored based on if they are from different disease stage. |
Top |
Malignant transformation related pathway analysis |
| Find out the enriched GO biological processes and KEGG pathways involved in transition from healthy to precancer to cancer |
| Tissue | Disease Stage | Enriched GO biological Processes |
| Colorectum | AD |  |
| Colorectum | SER |  |
| Colorectum | MSS |  |
| Colorectum | MSI-H |  |
| Colorectum | FAP |  |
| ∗Top 15 enriched GO BP terms are showed in the bar plot of each disease state in each tissue. Each row represents a significant GO biological process which is colored according to the -log10(p.adjust). |
| Page: 1 2 3 4 5 6 7 8 9 |
| GO ID | Tissue | Disease Stage | Description | Gene Ratio | Bg Ratio | pvalue | p.adjust | Count |
| GO:001657015 | Esophagus | ESCC | histone modification | 323/8552 | 463/18723 | 2.61e-26 | 7.88e-24 | 323 |
| GO:001820514 | Esophagus | ESCC | peptidyl-lysine modification | 259/8552 | 376/18723 | 3.90e-20 | 5.26e-18 | 259 |
| GO:00434143 | Esophagus | ESCC | macromolecule methylation | 199/8552 | 316/18723 | 3.44e-10 | 9.57e-09 | 199 |
| GO:00322592 | Esophagus | ESCC | methylation | 222/8552 | 364/18723 | 2.26e-09 | 5.09e-08 | 222 |
| GO:00400295 | Esophagus | ESCC | regulation of gene expression, epigenetic | 74/8552 | 105/18723 | 2.24e-07 | 3.42e-06 | 74 |
| GO:000647914 | Esophagus | ESCC | protein methylation | 115/8552 | 181/18723 | 9.07e-07 | 1.16e-05 | 115 |
| GO:000821314 | Esophagus | ESCC | protein alkylation | 115/8552 | 181/18723 | 9.07e-07 | 1.16e-05 | 115 |
| GO:00165718 | Esophagus | ESCC | histone methylation | 89/8552 | 141/18723 | 2.17e-05 | 1.87e-04 | 89 |
| GO:00488638 | Esophagus | ESCC | stem cell differentiation | 122/8552 | 206/18723 | 5.95e-05 | 4.59e-04 | 122 |
| GO:003496814 | Esophagus | ESCC | histone lysine methylation | 72/8552 | 115/18723 | 1.85e-04 | 1.18e-03 | 72 |
| GO:001802214 | Esophagus | ESCC | peptidyl-lysine methylation | 79/8552 | 131/18723 | 5.17e-04 | 2.86e-03 | 79 |
| GO:200073614 | Esophagus | ESCC | regulation of stem cell differentiation | 39/8552 | 58/18723 | 7.43e-04 | 3.86e-03 | 39 |
| GO:0045814 | Esophagus | ESCC | negative regulation of gene expression, epigenetic | 32/8552 | 50/18723 | 6.90e-03 | 2.52e-02 | 32 |
| GO:00513025 | Esophagus | ESCC | regulation of cell division | 97/8552 | 177/18723 | 8.93e-03 | 3.12e-02 | 97 |
| GO:00180231 | Esophagus | ESCC | peptidyl-lysine trimethylation | 31/8552 | 50/18723 | 1.48e-02 | 4.79e-02 | 31 |
| GO:001657021 | Liver | HCC | histone modification | 283/7958 | 463/18723 | 2.68e-16 | 2.33e-14 | 283 |
| GO:00182052 | Liver | HCC | peptidyl-lysine modification | 230/7958 | 376/18723 | 1.51e-13 | 8.32e-12 | 230 |
| GO:00434141 | Liver | HCC | macromolecule methylation | 183/7958 | 316/18723 | 2.00e-08 | 4.72e-07 | 183 |
| GO:0032259 | Liver | HCC | methylation | 206/7958 | 364/18723 | 3.35e-08 | 7.53e-07 | 206 |
| GO:00064792 | Liver | HCC | protein methylation | 111/7958 | 181/18723 | 2.36e-07 | 4.18e-06 | 111 |
| Page: 1 2 3 |
| Pathway ID | Tissue | Disease Stage | Description | Gene Ratio | Bg Ratio | pvalue | p.adjust | qvalue | Count |
| Page: 1 |
Top |
Cell-cell communication analysis |
| Identification of potential cell-cell interactions between two cell types and their ligand-receptor pairs for different disease states |
| Ligand | Receptor | LRpair | Pathway | Tissue | Disease Stage |
| Page: 1 |
Top |
Single-cell gene regulatory network inference analysis |
| Find out the significant the regulons (TFs) and the target genes of each regulon across cell types for different disease states |
| TF | Cell Type | Tissue | Disease Stage | Target Gene | RSS | Regulon Activity |
| ∗The dot plots of a searched regulon are shown for all cell subpopulations in each disease state of each tissue based on the regulon specific score inferred using pySCENIC and by calculating the average expression. |
| Page: 1 |
Top |
Somatic mutation of malignant transformation related genes |
| Annotation of somatic variants for genes involved in malignant transformation |
| Hugo Symbol | Variant Class | Variant Classification | dbSNP RS | HGVSc | HGVSp | HGVSp Short | SWISSPROT | BIOTYPE | SIFT | PolyPhen | Tumor Sample Barcode | Tissue | Histology | Sex | Age | Stage | Therapy Types | Drugs | Outcome |
| SMYD5 | SNV | Missense_Mutation | c.1022N>G | p.Ile341Ser | p.I341S | Q6GMV2 | protein_coding | deleterious(0) | probably_damaging(0.999) | TCGA-AO-A12D-01 | Breast | breast invasive carcinoma | Female | <65 | I/II | Chemotherapy | cyclophosphamide | SD | |
| SMYD5 | SNV | Missense_Mutation | c.295N>C | p.Glu99Gln | p.E99Q | Q6GMV2 | protein_coding | tolerated(0.12) | benign(0.334) | TCGA-BH-A0DZ-01 | Breast | breast invasive carcinoma | Female | <65 | I/II | Chemotherapy | docetaxel | SD | |
| SMYD5 | deletion | Frame_Shift_Del | c.568_569delNN | p.Ser191ProfsTer4 | p.S191Pfs*4 | Q6GMV2 | protein_coding | TCGA-BH-A0HI-01 | Breast | breast invasive carcinoma | Female | >=65 | I/II | Hormone Therapy | arimidex | SD | |||
| SMYD5 | SNV | Missense_Mutation | novel | c.255N>C | p.Gln85His | p.Q85H | Q6GMV2 | protein_coding | deleterious(0.03) | benign(0.403) | TCGA-C5-A8YR-01 | Cervix | cervical & endocervical cancer | Female | <65 | I/II | Unknown | Unknown | PD |
| SMYD5 | SNV | Missense_Mutation | novel | c.385N>A | p.Glu129Lys | p.E129K | Q6GMV2 | protein_coding | tolerated(0.62) | benign(0.022) | TCGA-VS-A958-01 | Cervix | cervical & endocervical cancer | Female | <65 | I/II | Chemotherapy | cisplatin | CR |
| SMYD5 | SNV | Missense_Mutation | rs777868848 | c.1245N>A | p.Met415Ile | p.M415I | Q6GMV2 | protein_coding | deleterious_low_confidence(0) | possibly_damaging(0.775) | TCGA-VS-A958-01 | Cervix | cervical & endocervical cancer | Female | <65 | I/II | Chemotherapy | cisplatin | CR |
| SMYD5 | SNV | Missense_Mutation | novel | c.679N>T | p.Ala227Ser | p.A227S | Q6GMV2 | protein_coding | tolerated(0.07) | probably_damaging(0.983) | TCGA-A6-5665-01 | Colorectum | colon adenocarcinoma | Female | >=65 | I/II | Unknown | Unknown | PD |
| SMYD5 | SNV | Missense_Mutation | rs376603112 | c.310C>T | p.Arg104Cys | p.R104C | Q6GMV2 | protein_coding | deleterious(0.02) | possibly_damaging(0.848) | TCGA-AA-3833-01 | Colorectum | colon adenocarcinoma | Female | <65 | I/II | Unknown | Unknown | SD |
| SMYD5 | SNV | Missense_Mutation | novel | c.223A>G | p.Arg75Gly | p.R75G | Q6GMV2 | protein_coding | deleterious(0) | possibly_damaging(0.636) | TCGA-AA-3984-01 | Colorectum | colon adenocarcinoma | Female | <65 | I/II | Unknown | Unknown | SD |
| SMYD5 | SNV | Missense_Mutation | c.311N>A | p.Arg104His | p.R104H | Q6GMV2 | protein_coding | deleterious(0.05) | benign(0.015) | TCGA-AA-A010-01 | Colorectum | colon adenocarcinoma | Female | <65 | I/II | Chemotherapy | folinic | CR |
| Page: 1 2 3 4 5 6 |
Top |
Related drugs of malignant transformation related genes |
| Identification of chemicals and drugs interact with genes involved in malignant transfromation |
| (DGIdb 4.0) |
| Entrez ID | Symbol | Category | Interaction Types | Drug Claim Name | Drug Name | PMIDs |
| Page: 1 |

Copyright 2023-Present -The University of Texas Health Science Center at Houston |