
|
|||||
|
 | |
| |
| |
| |
| |
| |
|
Gene: SMYD4 |
Gene summary for SMYD4 |
| Gene information | Species | Human | Gene symbol | SMYD4 | Gene ID | 114826 |
| Gene name | SET and MYND domain containing 4 | |
| Gene Alias | ZMYND21 | |
| Cytomap | 17p13.3 | |
| Gene Type | protein-coding | GO ID | GO:0007275 | UniProtAcc | Q8IYR2 |
Top |
Malignant transformation analysis |
| Identification of the aberrant gene expression in precancerous and cancerous lesions by comparing the gene expression of stem-like cells in diseased tissues with normal stem cells |
| Entrez ID | Symbol | Replicates | Species | Organ | Tissue | Adj P-value | Log2FC | Malignancy |
| 114826 | SMYD4 | LZE4T | Human | Esophagus | ESCC | 1.78e-11 | 3.15e-01 | 0.0811 |
| 114826 | SMYD4 | LZE24T | Human | Esophagus | ESCC | 1.11e-05 | 1.85e-01 | 0.0596 |
| 114826 | SMYD4 | P1T-E | Human | Esophagus | ESCC | 3.47e-07 | 2.57e-01 | 0.0875 |
| 114826 | SMYD4 | P2T-E | Human | Esophagus | ESCC | 2.04e-13 | 2.38e-01 | 0.1177 |
| 114826 | SMYD4 | P4T-E | Human | Esophagus | ESCC | 2.03e-05 | 1.76e-01 | 0.1323 |
| 114826 | SMYD4 | P5T-E | Human | Esophagus | ESCC | 1.02e-05 | 1.13e-01 | 0.1327 |
| 114826 | SMYD4 | P8T-E | Human | Esophagus | ESCC | 7.71e-05 | 1.08e-01 | 0.0889 |
| 114826 | SMYD4 | P9T-E | Human | Esophagus | ESCC | 2.77e-11 | 3.00e-01 | 0.1131 |
| 114826 | SMYD4 | P10T-E | Human | Esophagus | ESCC | 3.24e-10 | 2.64e-01 | 0.116 |
| 114826 | SMYD4 | P12T-E | Human | Esophagus | ESCC | 2.71e-19 | 3.34e-01 | 0.1122 |
| 114826 | SMYD4 | P15T-E | Human | Esophagus | ESCC | 1.11e-09 | 1.88e-01 | 0.1149 |
| 114826 | SMYD4 | P16T-E | Human | Esophagus | ESCC | 5.24e-11 | 2.66e-01 | 0.1153 |
| 114826 | SMYD4 | P19T-E | Human | Esophagus | ESCC | 4.44e-02 | 2.62e-01 | 0.1662 |
| 114826 | SMYD4 | P20T-E | Human | Esophagus | ESCC | 1.17e-05 | 1.70e-01 | 0.1124 |
| 114826 | SMYD4 | P21T-E | Human | Esophagus | ESCC | 7.05e-10 | 1.48e-01 | 0.1617 |
| 114826 | SMYD4 | P22T-E | Human | Esophagus | ESCC | 7.42e-15 | 2.48e-01 | 0.1236 |
| 114826 | SMYD4 | P24T-E | Human | Esophagus | ESCC | 2.86e-04 | 1.19e-01 | 0.1287 |
| 114826 | SMYD4 | P26T-E | Human | Esophagus | ESCC | 6.34e-05 | 8.56e-02 | 0.1276 |
| 114826 | SMYD4 | P27T-E | Human | Esophagus | ESCC | 5.07e-12 | 2.53e-01 | 0.1055 |
| 114826 | SMYD4 | P28T-E | Human | Esophagus | ESCC | 1.18e-15 | 2.51e-01 | 0.1149 |
| Page: 1 2 3 4 |
| Tissue | Expression Dynamics | Abbreviation |
| Esophagus |  | ESCC: Esophageal squamous cell carcinoma |
| HGIN: High-grade intraepithelial neoplasias | ||
| LGIN: Low-grade intraepithelial neoplasias | ||
| Liver | 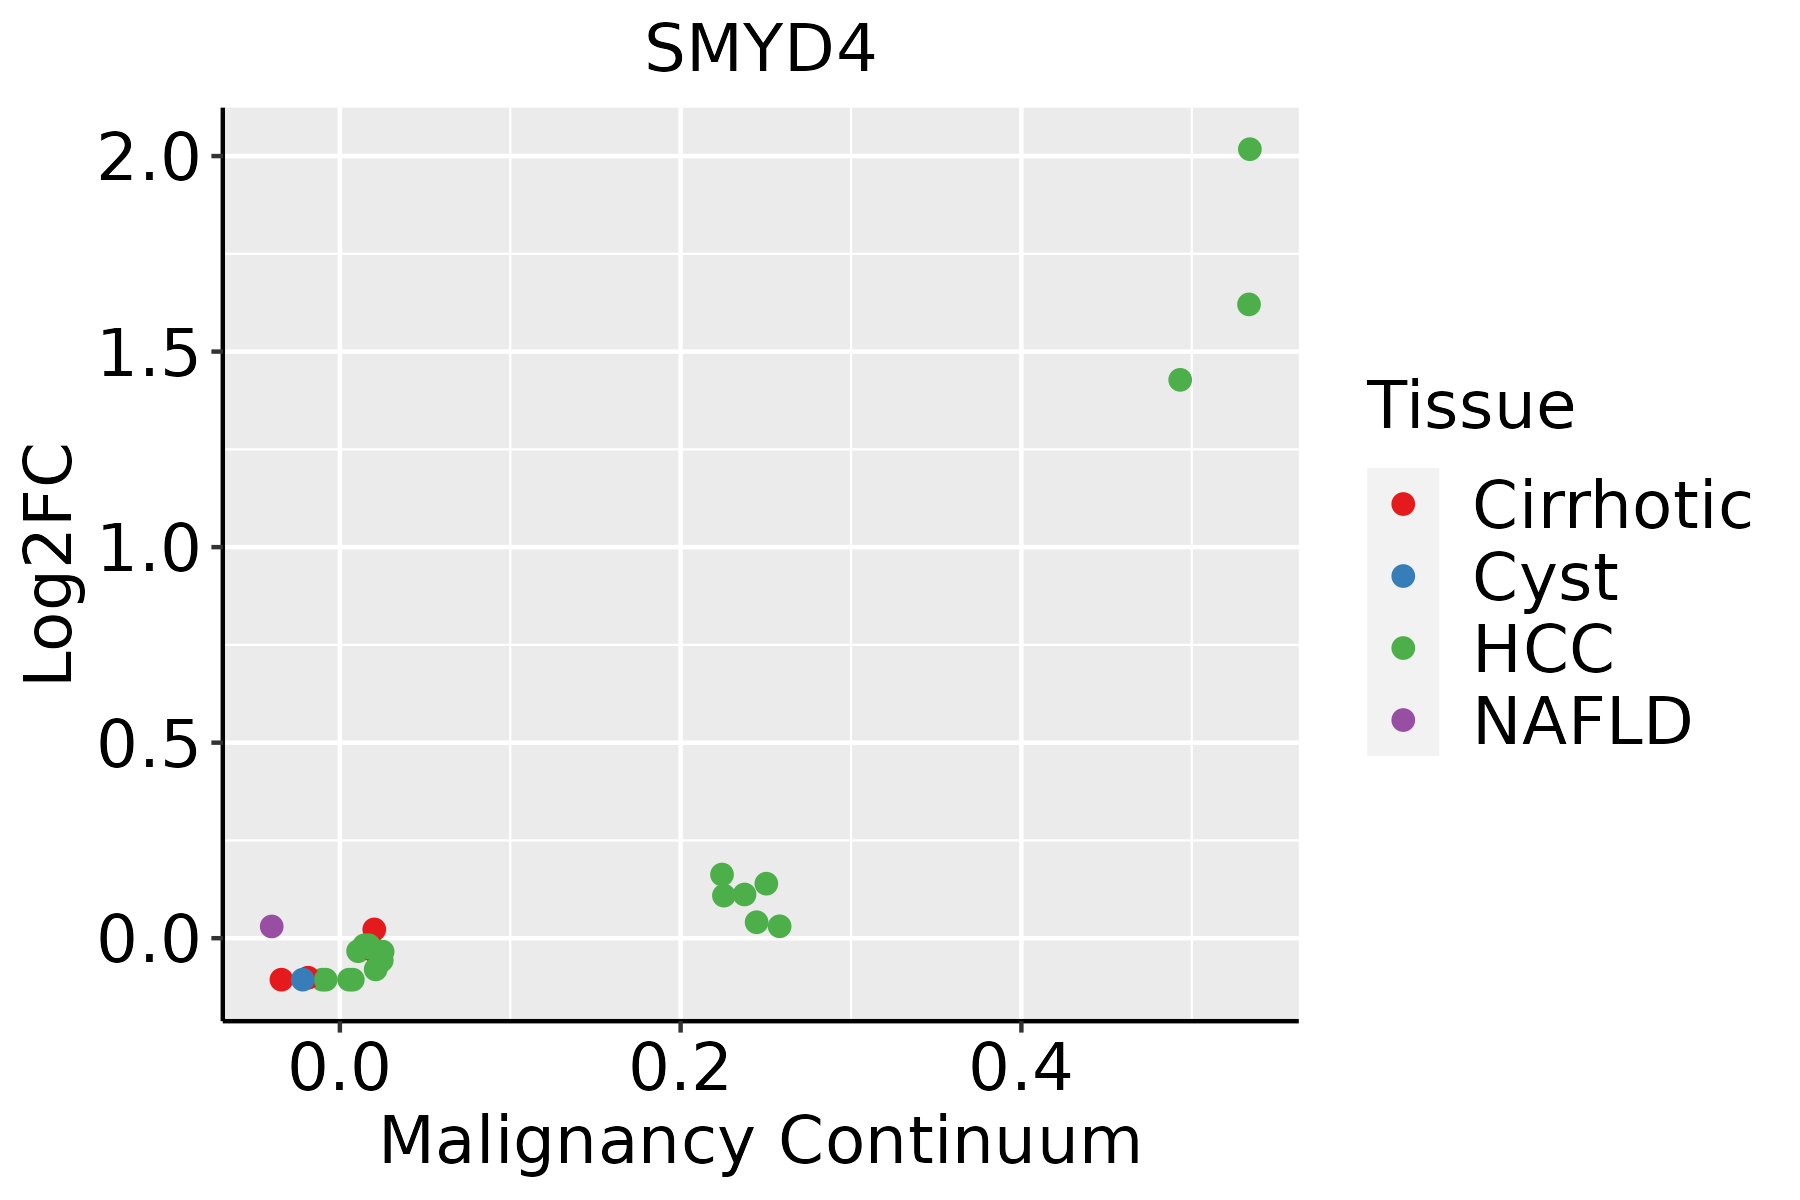 | HCC: Hepatocellular carcinoma |
| NAFLD: Non-alcoholic fatty liver disease | ||
| Thyroid | 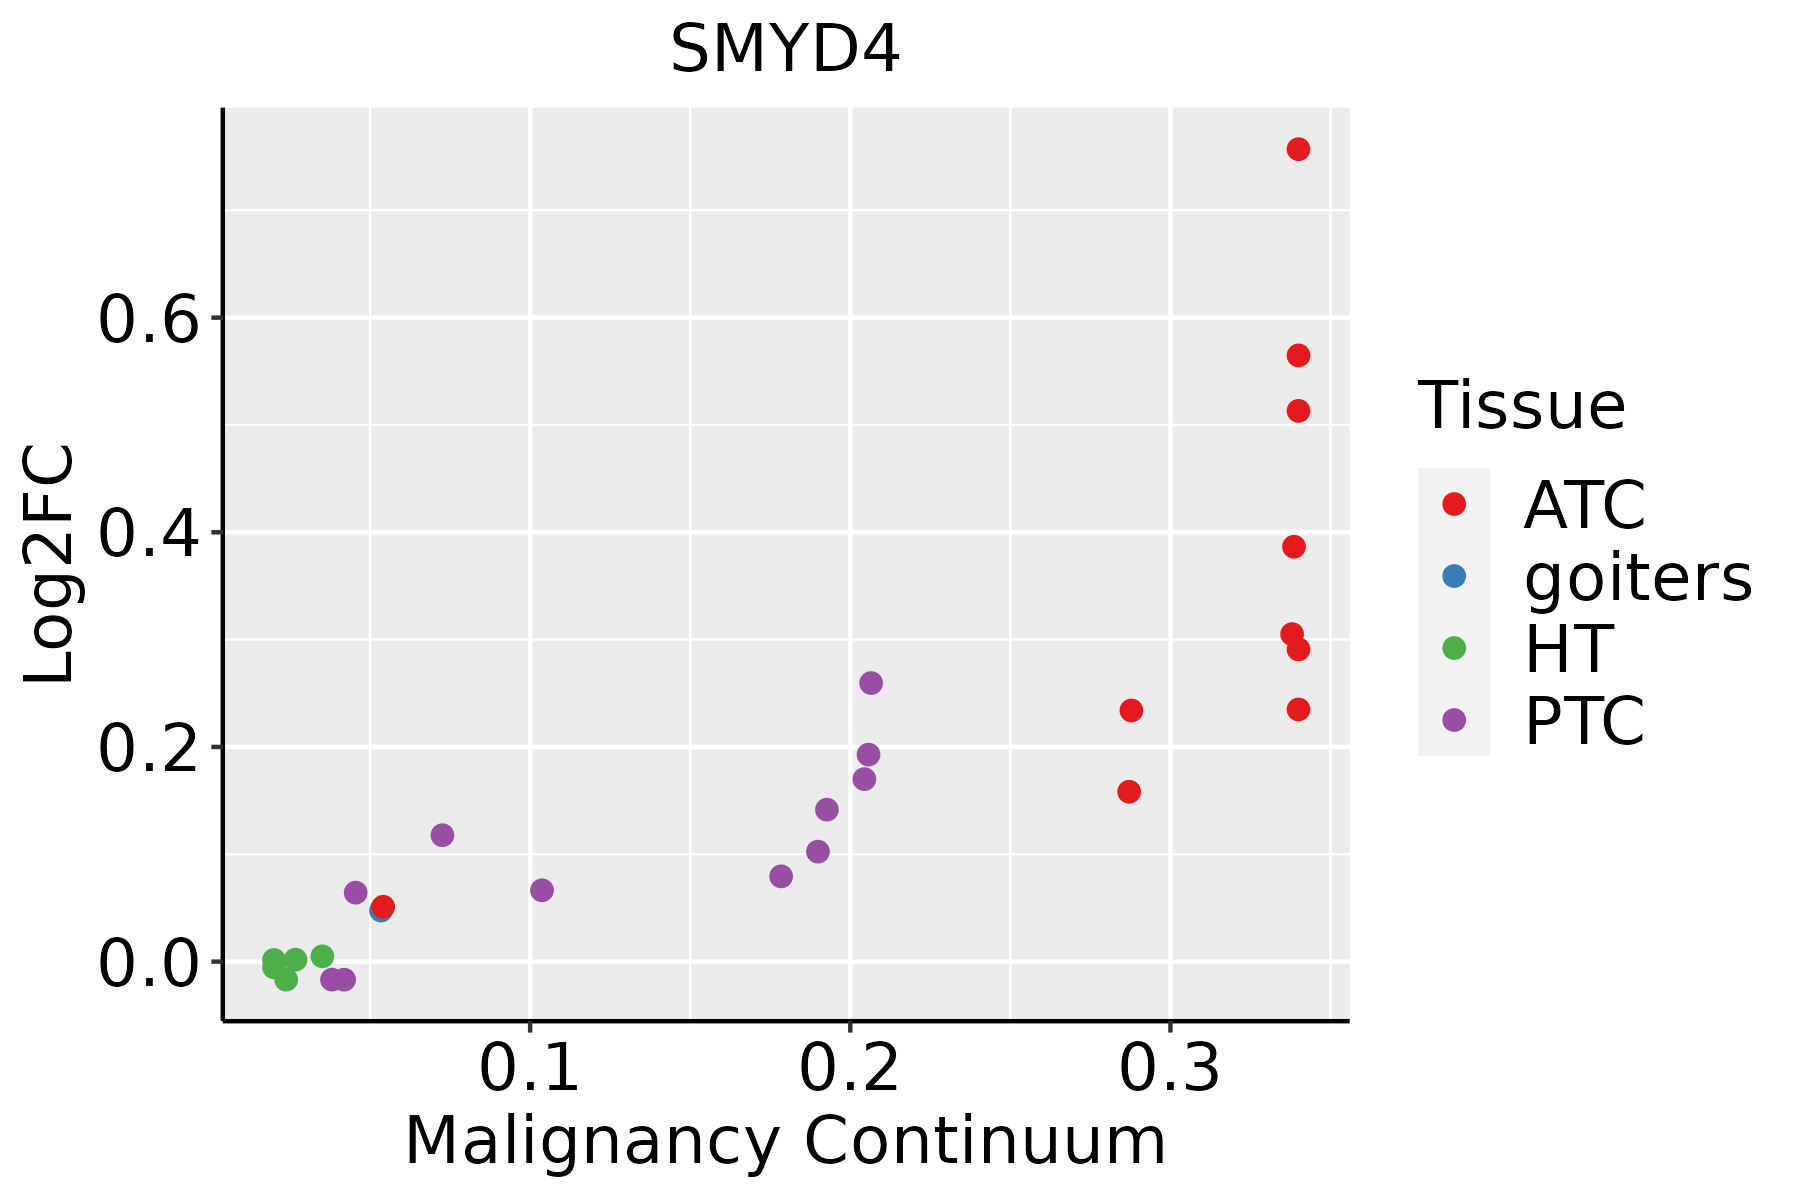 | ATC: Anaplastic thyroid cancer |
| HT: Hashimoto's thyroiditis | ||
| PTC: Papillary thyroid cancer |
| ∗log2FC in expression of this searched gene in stem-like cells from each diseased tissue sample relative to stem-like cells in normal samples in each tissue plotted against the malignancy continuum. Samples are colored based on if they are from different disease stage. |
Top |
Malignant transformation related pathway analysis |
| Find out the enriched GO biological processes and KEGG pathways involved in transition from healthy to precancer to cancer |
| Tissue | Disease Stage | Enriched GO biological Processes |
| Colorectum | AD |  |
| Colorectum | SER |  |
| Colorectum | MSS |  |
| Colorectum | MSI-H |  |
| Colorectum | FAP |  |
| ∗Top 15 enriched GO BP terms are showed in the bar plot of each disease state in each tissue. Each row represents a significant GO biological process which is colored according to the -log10(p.adjust). |
| Page: 1 2 3 4 5 6 7 8 9 |
| GO ID | Tissue | Disease Stage | Description | Gene Ratio | Bg Ratio | pvalue | p.adjust | Count |
| GO:00322592 | Esophagus | ESCC | methylation | 222/8552 | 364/18723 | 2.26e-09 | 5.09e-08 | 222 |
| GO:0032259 | Liver | HCC | methylation | 206/7958 | 364/18723 | 3.35e-08 | 7.53e-07 | 206 |
| GO:00322594 | Thyroid | PTC | methylation | 146/5968 | 364/18723 | 4.99e-04 | 3.26e-03 | 146 |
| GO:003225911 | Thyroid | ATC | methylation | 148/6293 | 364/18723 | 2.69e-03 | 1.23e-02 | 148 |
| Page: 1 |
| Pathway ID | Tissue | Disease Stage | Description | Gene Ratio | Bg Ratio | pvalue | p.adjust | qvalue | Count |
| Page: 1 |
Top |
Cell-cell communication analysis |
| Identification of potential cell-cell interactions between two cell types and their ligand-receptor pairs for different disease states |
| Ligand | Receptor | LRpair | Pathway | Tissue | Disease Stage |
| Page: 1 |
Top |
Single-cell gene regulatory network inference analysis |
| Find out the significant the regulons (TFs) and the target genes of each regulon across cell types for different disease states |
| TF | Cell Type | Tissue | Disease Stage | Target Gene | RSS | Regulon Activity |
| ∗The dot plots of a searched regulon are shown for all cell subpopulations in each disease state of each tissue based on the regulon specific score inferred using pySCENIC and by calculating the average expression. |
| Page: 1 |
Top |
Somatic mutation of malignant transformation related genes |
| Annotation of somatic variants for genes involved in malignant transformation |
| Hugo Symbol | Variant Class | Variant Classification | dbSNP RS | HGVSc | HGVSp | HGVSp Short | SWISSPROT | BIOTYPE | SIFT | PolyPhen | Tumor Sample Barcode | Tissue | Histology | Sex | Age | Stage | Therapy Types | Drugs | Outcome |
| SMYD4 | SNV | Missense_Mutation | c.2347N>A | p.Gln783Lys | p.Q783K | Q8IYR2 | protein_coding | deleterious(0.01) | benign(0.355) | TCGA-A2-A25A-01 | Breast | breast invasive carcinoma | Female | <65 | I/II | Unspecific | Cytoxan | SD | |
| SMYD4 | SNV | Missense_Mutation | c.117N>G | p.His39Gln | p.H39Q | Q8IYR2 | protein_coding | tolerated(0.27) | benign(0.003) | TCGA-AC-A23H-01 | Breast | breast invasive carcinoma | Female | >=65 | I/II | Unknown | Unknown | PD | |
| SMYD4 | SNV | Missense_Mutation | c.832N>G | p.His278Asp | p.H278D | Q8IYR2 | protein_coding | tolerated(0.25) | benign(0.288) | TCGA-BH-A0C0-01 | Breast | breast invasive carcinoma | Female | <65 | I/II | Chemotherapy | carboplatin | SD | |
| SMYD4 | SNV | Missense_Mutation | c.359N>A | p.Gly120Asp | p.G120D | Q8IYR2 | protein_coding | tolerated(0.07) | benign(0.28) | TCGA-D8-A1JD-01 | Breast | breast invasive carcinoma | Female | <65 | I/II | Chemotherapy | adriamycin | SD | |
| SMYD4 | insertion | Frame_Shift_Ins | novel | c.1097_1098insTTTGAGACGGAGTCTCACTCTGTCACCCCCAGGCTGGGGTG | p.Ile367LeufsTer15 | p.I367Lfs*15 | Q8IYR2 | protein_coding | TCGA-A8-A08H-01 | Breast | breast invasive carcinoma | Female | >=65 | I/II | Unknown | Unknown | SD | ||
| SMYD4 | insertion | Nonsense_Mutation | novel | c.1970_1971insGATTTCAGCTGTTGTTTTCTTCTGCATCTGATTGCTAAGTTG | p.Leu657_Gln658insIleSerAlaValValPhePheCysIleTerLeuLeuSerTer | p.L657_Q658insISAVVFFCI*LLS* | Q8IYR2 | protein_coding | TCGA-A8-A08R-01 | Breast | breast invasive carcinoma | Female | <65 | I/II | Unknown | Unknown | SD | ||
| SMYD4 | insertion | Frame_Shift_Ins | novel | c.1041_1042insCCAATTGAGAGATATTTCCC | p.Cys348ProfsTer12 | p.C348Pfs*12 | Q8IYR2 | protein_coding | TCGA-A8-A092-01 | Breast | breast invasive carcinoma | Female | <65 | III/IV | Chemotherapy | paclitaxel | CR | ||
| SMYD4 | deletion | Frame_Shift_Del | c.1919delN | p.Cys640LeufsTer34 | p.C640Lfs*34 | Q8IYR2 | protein_coding | TCGA-AN-A0AK-01 | Breast | breast invasive carcinoma | Female | >=65 | I/II | Unknown | Unknown | SD | |||
| SMYD4 | insertion | Frame_Shift_Ins | novel | c.1228_1229insGAGATCGTGCCACTGCACTCCAGCCTGGCGA | p.Pro410ArgfsTer16 | p.P410Rfs*16 | Q8IYR2 | protein_coding | TCGA-BH-A0HQ-01 | Breast | breast invasive carcinoma | Female | <65 | I/II | Hormone Therapy | arimidex | SD | ||
| SMYD4 | deletion | Frame_Shift_Del | novel | c.2188delN | p.Glu730ArgfsTer32 | p.E730Rfs*32 | Q8IYR2 | protein_coding | TCGA-D8-A27V-01 | Breast | breast invasive carcinoma | Female | <65 | I/II | Hormone Therapy | tamoxiphen | SD |
| Page: 1 2 3 4 5 6 7 |
Top |
Related drugs of malignant transformation related genes |
| Identification of chemicals and drugs interact with genes involved in malignant transfromation |
| (DGIdb 4.0) |
| Entrez ID | Symbol | Category | Interaction Types | Drug Claim Name | Drug Name | PMIDs |
| Page: 1 |

Copyright 2023-Present -The University of Texas Health Science Center at Houston |