
|
|||||
|
 | |
| |
| |
| |
| |
| |
|
Gene: SMYD3 |
Gene summary for SMYD3 |
| Gene information | Species | Human | Gene symbol | SMYD3 | Gene ID | 64754 |
| Gene name | SET and MYND domain containing 3 | |
| Gene Alias | KMT3E | |
| Cytomap | 1q44 | |
| Gene Type | protein-coding | GO ID | GO:0001932 | UniProtAcc | Q9H7B4 |
Top |
Malignant transformation analysis |
| Identification of the aberrant gene expression in precancerous and cancerous lesions by comparing the gene expression of stem-like cells in diseased tissues with normal stem cells |
| Entrez ID | Symbol | Replicates | Species | Organ | Tissue | Adj P-value | Log2FC | Malignancy |
| 64754 | SMYD3 | CA_HPV_1 | Human | Cervix | CC | 1.87e-09 | -2.51e-01 | 0.0264 |
| 64754 | SMYD3 | CCI_1 | Human | Cervix | CC | 9.09e-05 | 8.73e-01 | 0.528 |
| 64754 | SMYD3 | CCI_3 | Human | Cervix | CC | 1.49e-11 | 1.27e+00 | 0.516 |
| 64754 | SMYD3 | Tumor | Human | Cervix | CC | 2.10e-09 | -2.71e-01 | 0.1241 |
| 64754 | SMYD3 | sample3 | Human | Cervix | CC | 5.82e-06 | -2.58e-01 | 0.1387 |
| 64754 | SMYD3 | H2 | Human | Cervix | HSIL_HPV | 2.71e-02 | -1.97e-01 | 0.0632 |
| 64754 | SMYD3 | T3 | Human | Cervix | CC | 4.50e-05 | -2.60e-01 | 0.1389 |
| 64754 | SMYD3 | HTA11_3410_2000001011 | Human | Colorectum | AD | 1.06e-19 | -5.74e-01 | 0.0155 |
| 64754 | SMYD3 | HTA11_2487_2000001011 | Human | Colorectum | SER | 1.53e-02 | -4.14e-01 | -0.1808 |
| 64754 | SMYD3 | HTA11_2951_2000001011 | Human | Colorectum | AD | 1.46e-05 | -7.82e-01 | 0.0216 |
| 64754 | SMYD3 | HTA11_347_2000001011 | Human | Colorectum | AD | 2.06e-04 | 4.50e-01 | -0.1954 |
| 64754 | SMYD3 | HTA11_2112_2000001011 | Human | Colorectum | SER | 8.38e-05 | -5.98e-01 | -0.2196 |
| 64754 | SMYD3 | HTA11_3361_2000001011 | Human | Colorectum | AD | 1.76e-12 | -6.66e-01 | -0.1207 |
| 64754 | SMYD3 | HTA11_5212_2000001011 | Human | Colorectum | AD | 1.47e-08 | -8.23e-01 | -0.2061 |
| 64754 | SMYD3 | HTA11_5216_2000001011 | Human | Colorectum | SER | 1.21e-09 | -9.32e-01 | -0.1462 |
| 64754 | SMYD3 | HTA11_7862_2000001011 | Human | Colorectum | AD | 5.60e-16 | -6.73e-01 | -0.0179 |
| 64754 | SMYD3 | HTA11_866_3004761011 | Human | Colorectum | AD | 1.41e-04 | -4.48e-01 | 0.096 |
| 64754 | SMYD3 | HTA11_8622_2000001021 | Human | Colorectum | SER | 1.95e-02 | -5.03e-01 | 0.0528 |
| 64754 | SMYD3 | HTA11_99999965062_69753 | Human | Colorectum | MSI-H | 9.07e-11 | 9.71e-01 | 0.3487 |
| 64754 | SMYD3 | HTA11_99999971662_82457 | Human | Colorectum | MSS | 2.05e-02 | 6.53e-01 | 0.3859 |
| Page: 1 2 3 4 5 6 7 8 9 10 11 12 |
| Tissue | Expression Dynamics | Abbreviation |
| Cervix | 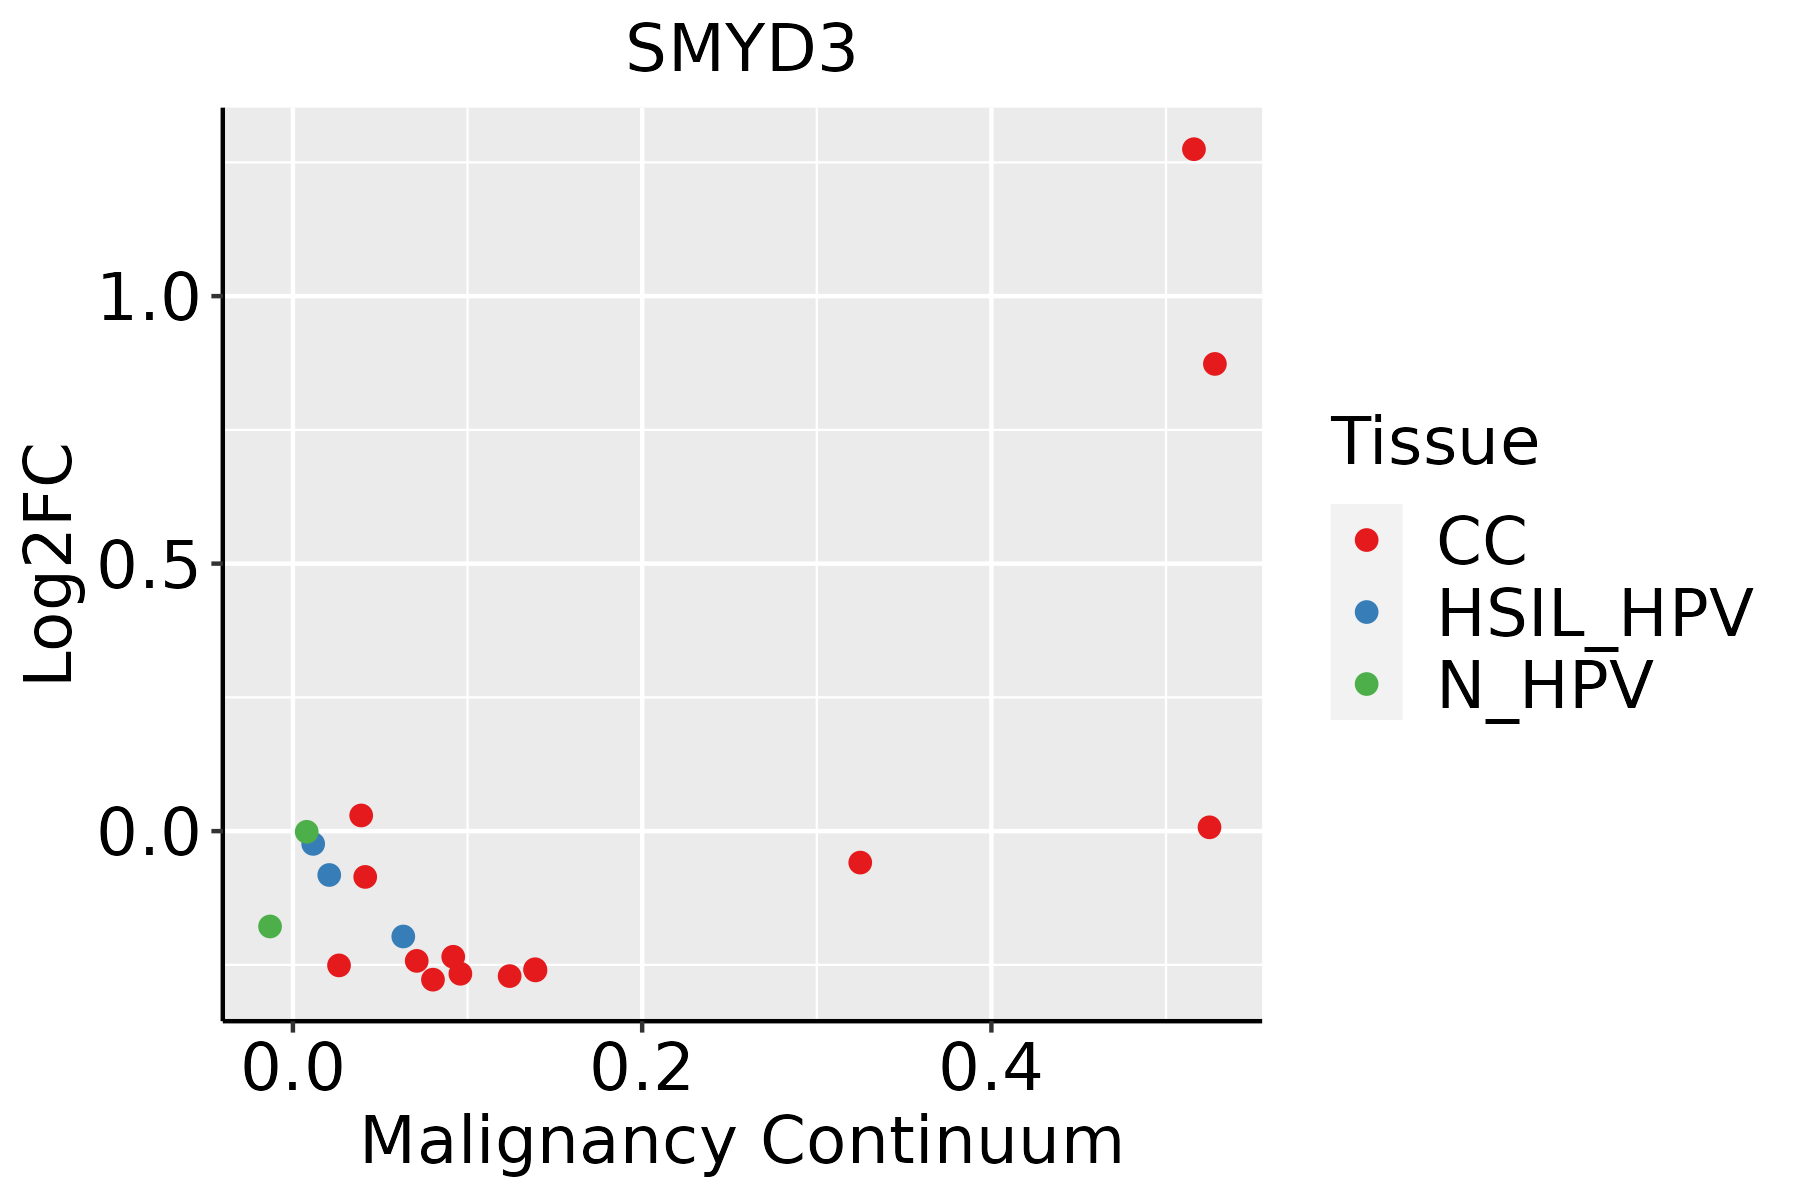 | CC: Cervix cancer |
| HSIL_HPV: HPV-infected high-grade squamous intraepithelial lesions | ||
| N_HPV: HPV-infected normal cervix | ||
| Colorectum (GSE201348) |  | FAP: Familial adenomatous polyposis |
| CRC: Colorectal cancer | ||
| Colorectum (HTA11) |  | AD: Adenomas |
| SER: Sessile serrated lesions | ||
| MSI-H: Microsatellite-high colorectal cancer | ||
| MSS: Microsatellite stable colorectal cancer | ||
| Endometrium | 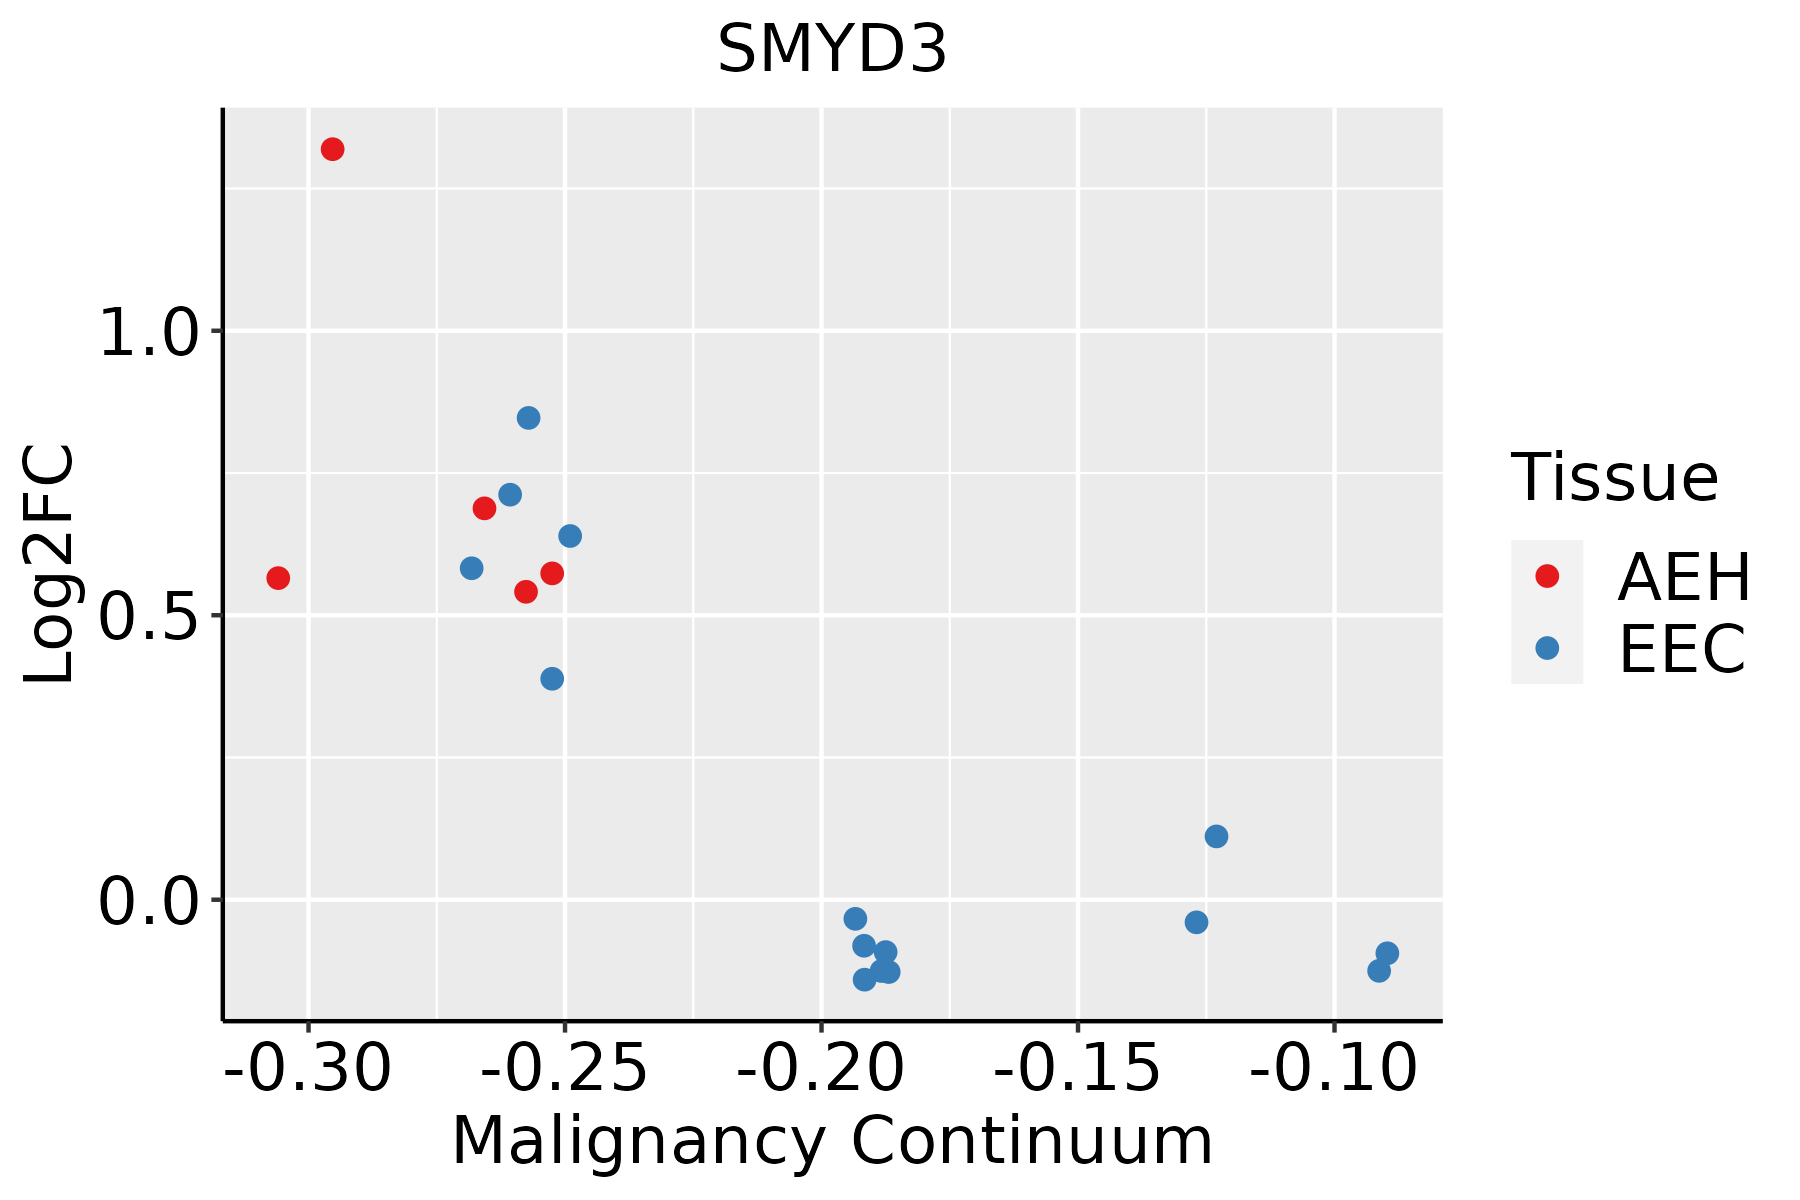 | AEH: Atypical endometrial hyperplasia |
| EEC: Endometrioid Cancer | ||
| Esophagus | 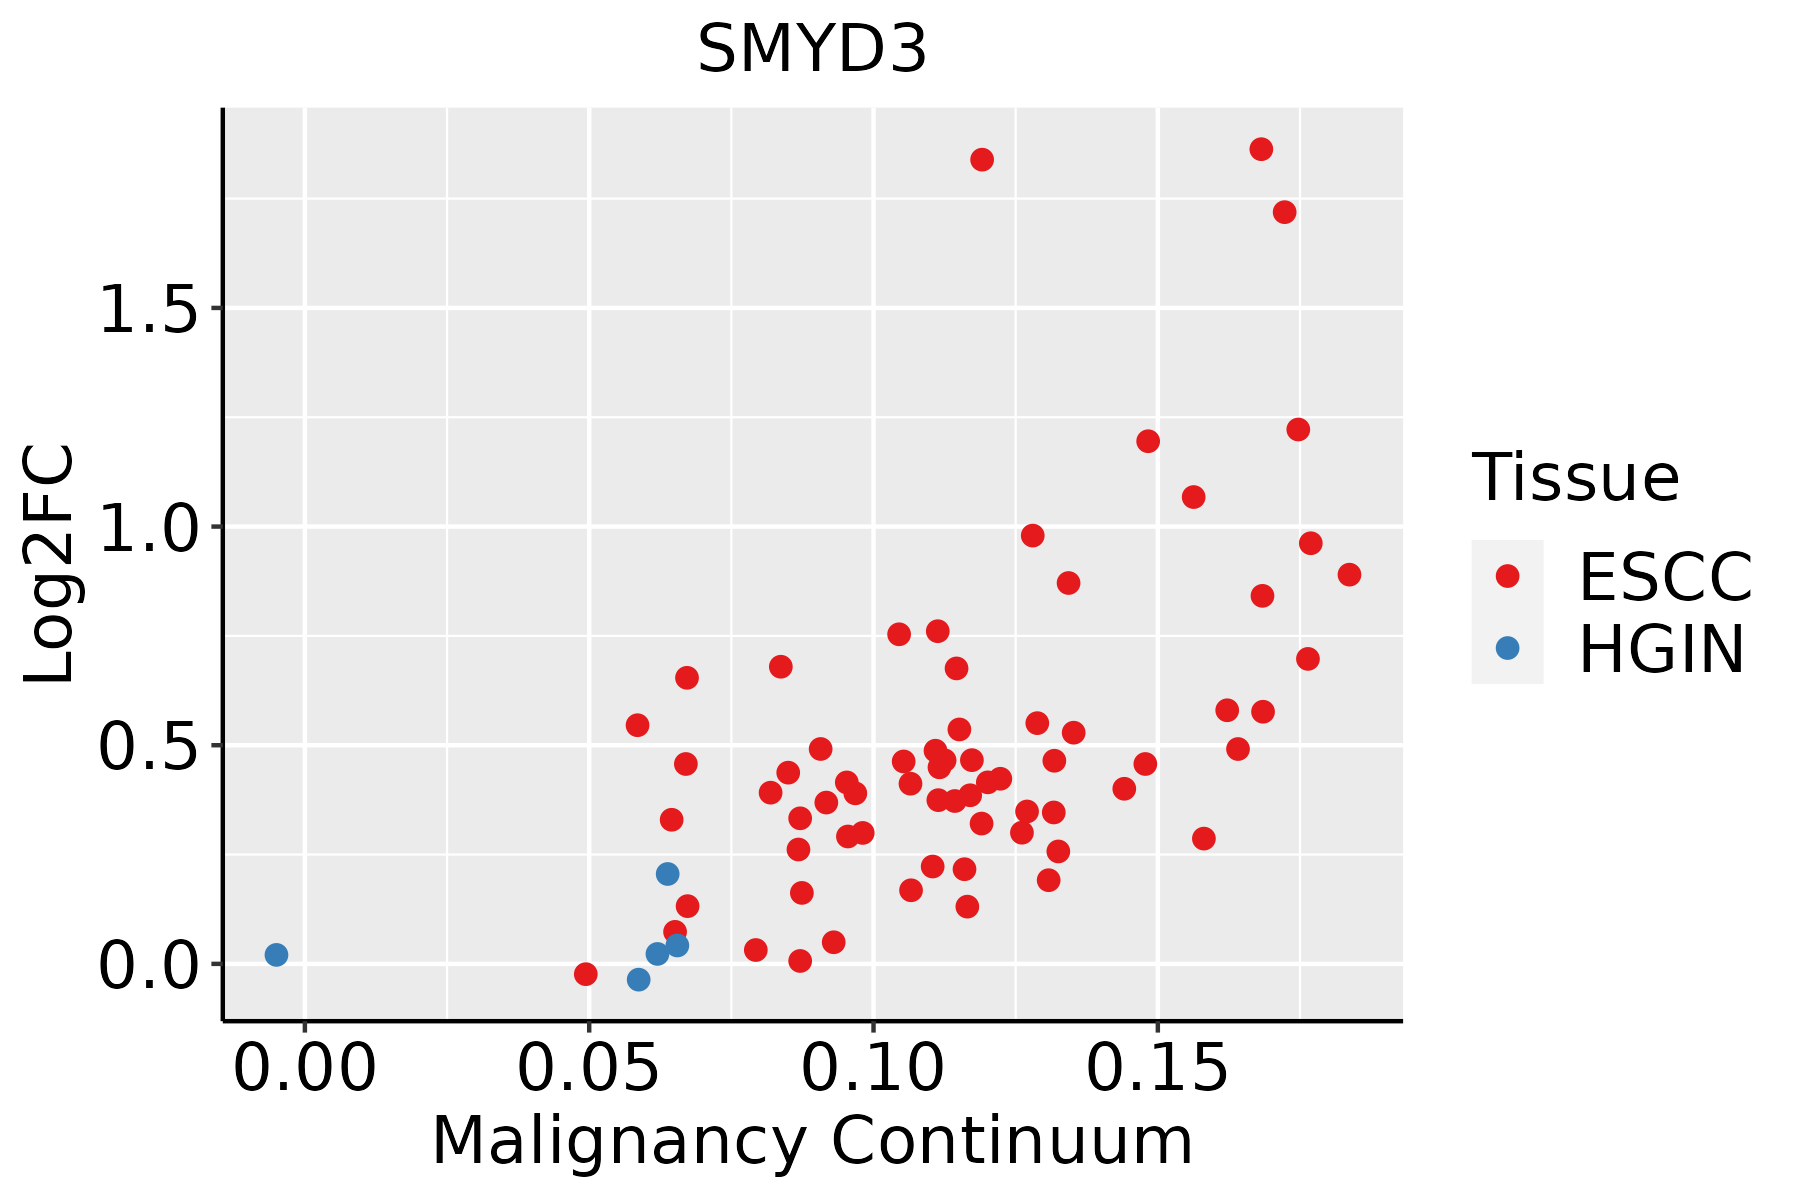 | ESCC: Esophageal squamous cell carcinoma |
| HGIN: High-grade intraepithelial neoplasias | ||
| LGIN: Low-grade intraepithelial neoplasias | ||
| GC |  | CAG: Chronic atrophic gastritis |
| CAG with IM: Chronic atrophic gastritis with intestinal metaplasia | ||
| CSG: Chronic superficial gastritis | ||
| GC: Gastric cancer | ||
| SIM: Severe intestinal metaplasia | ||
| WIM: Wild intestinal metaplasia | ||
| Liver | 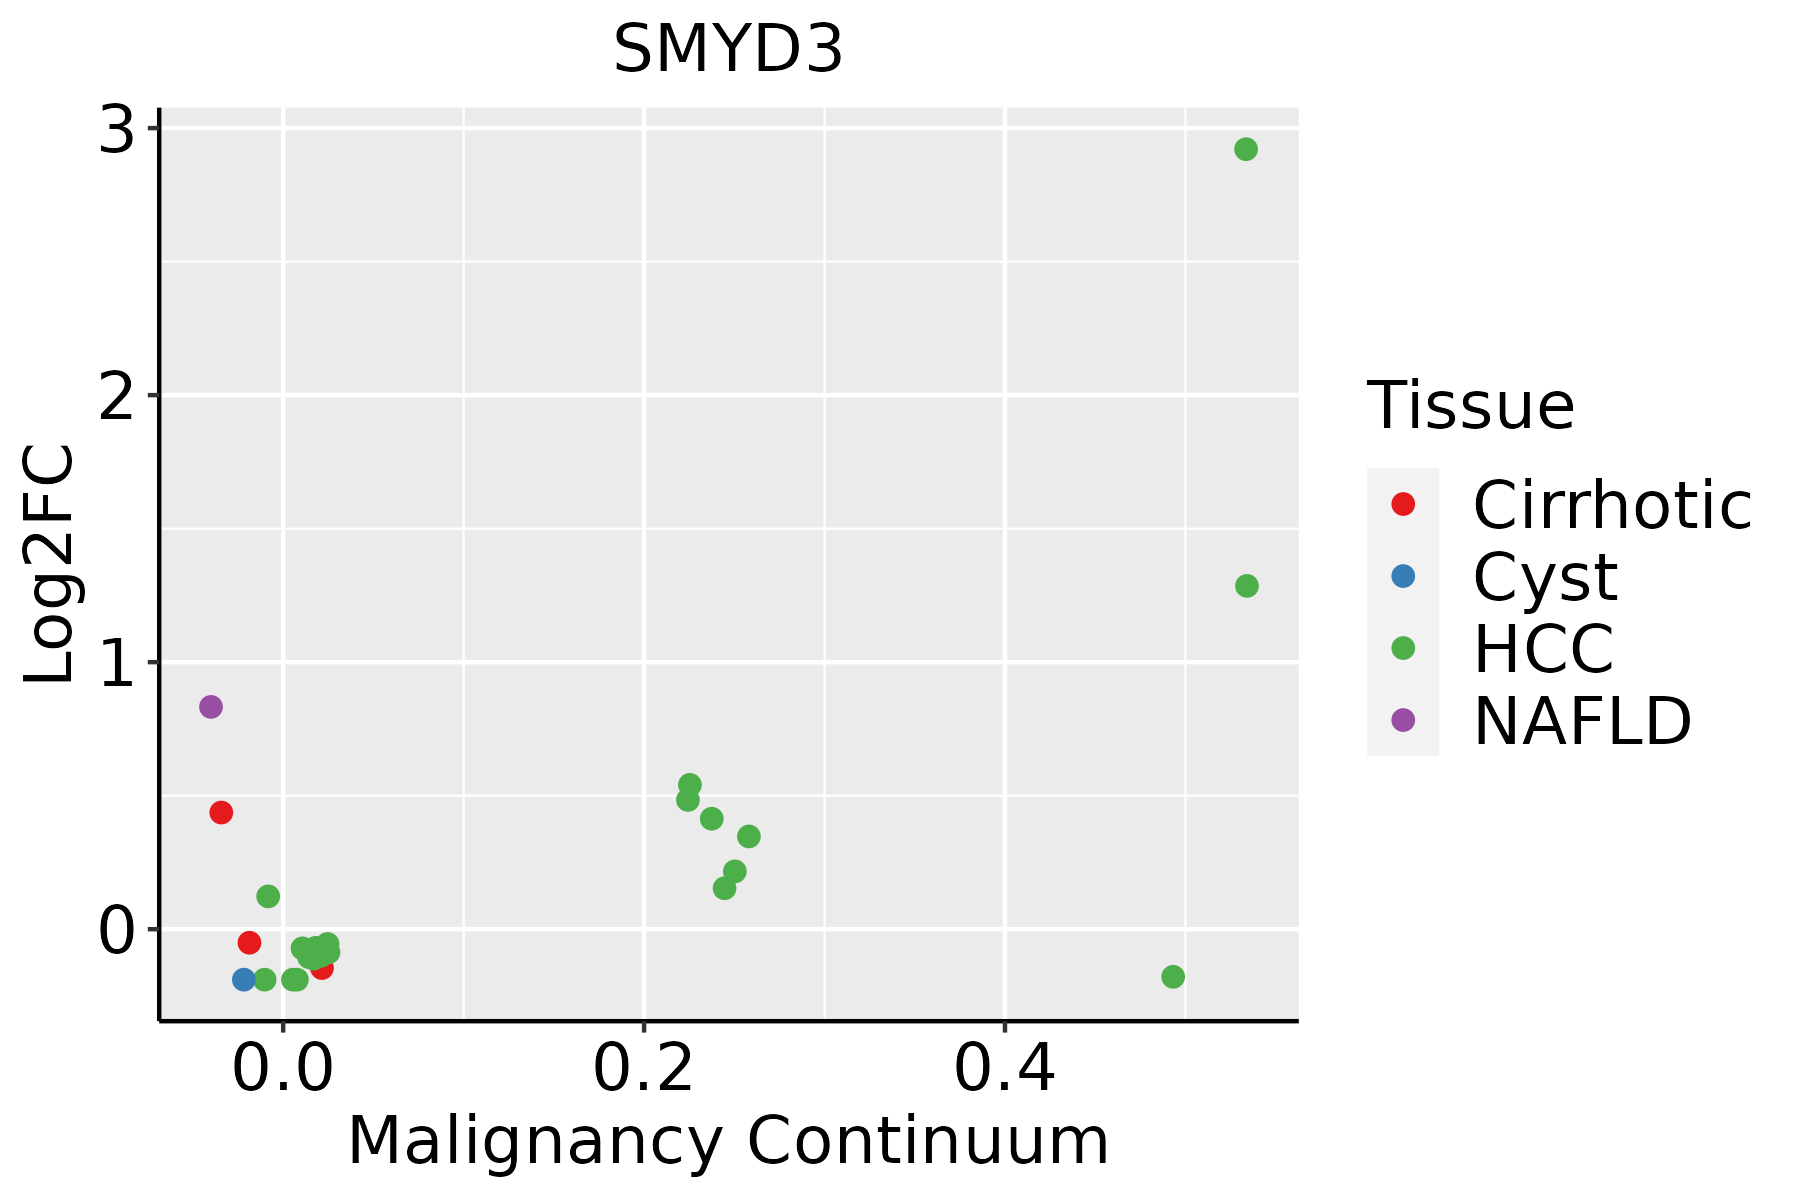 | HCC: Hepatocellular carcinoma |
| NAFLD: Non-alcoholic fatty liver disease | ||
| Lung | 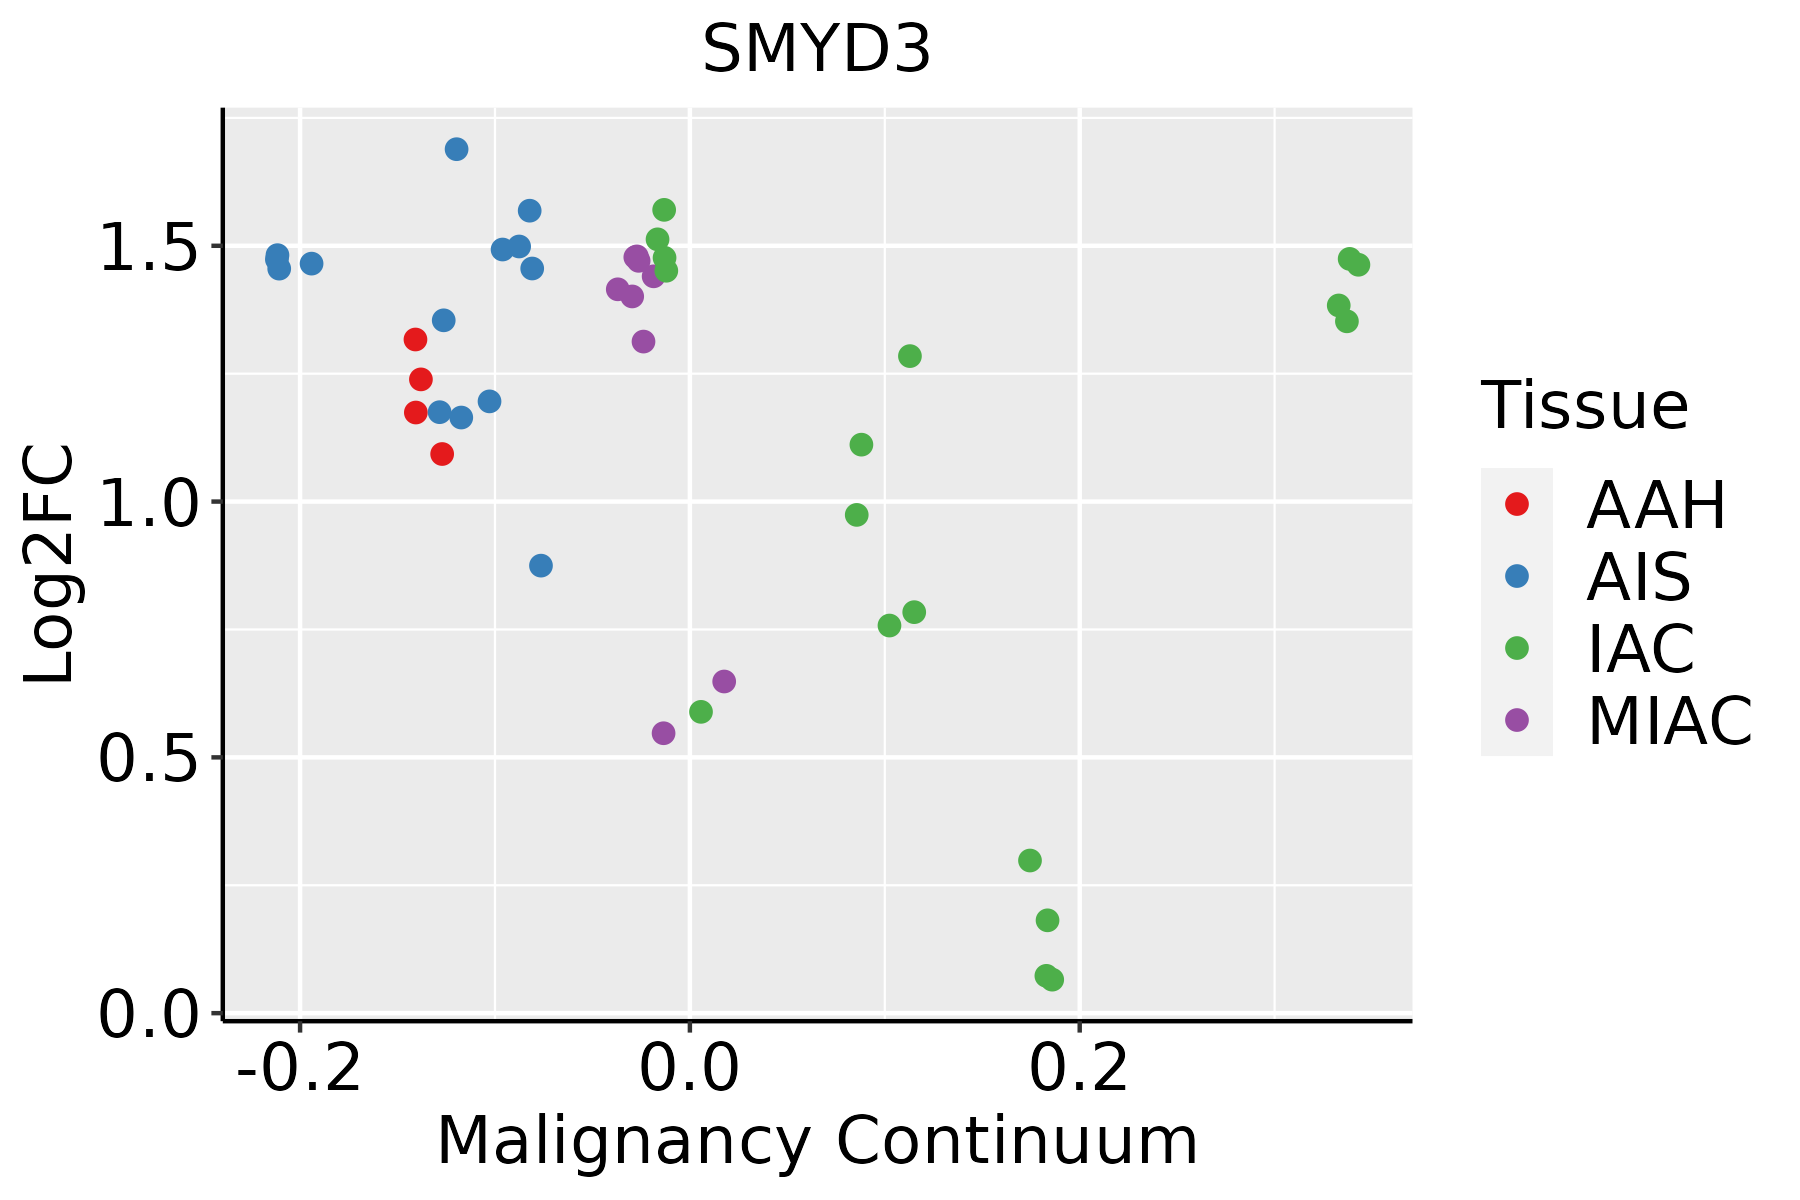 | AAH: Atypical adenomatous hyperplasia |
| AIS: Adenocarcinoma in situ | ||
| IAC: Invasive lung adenocarcinoma | ||
| MIA: Minimally invasive adenocarcinoma | ||
| Oral Cavity | 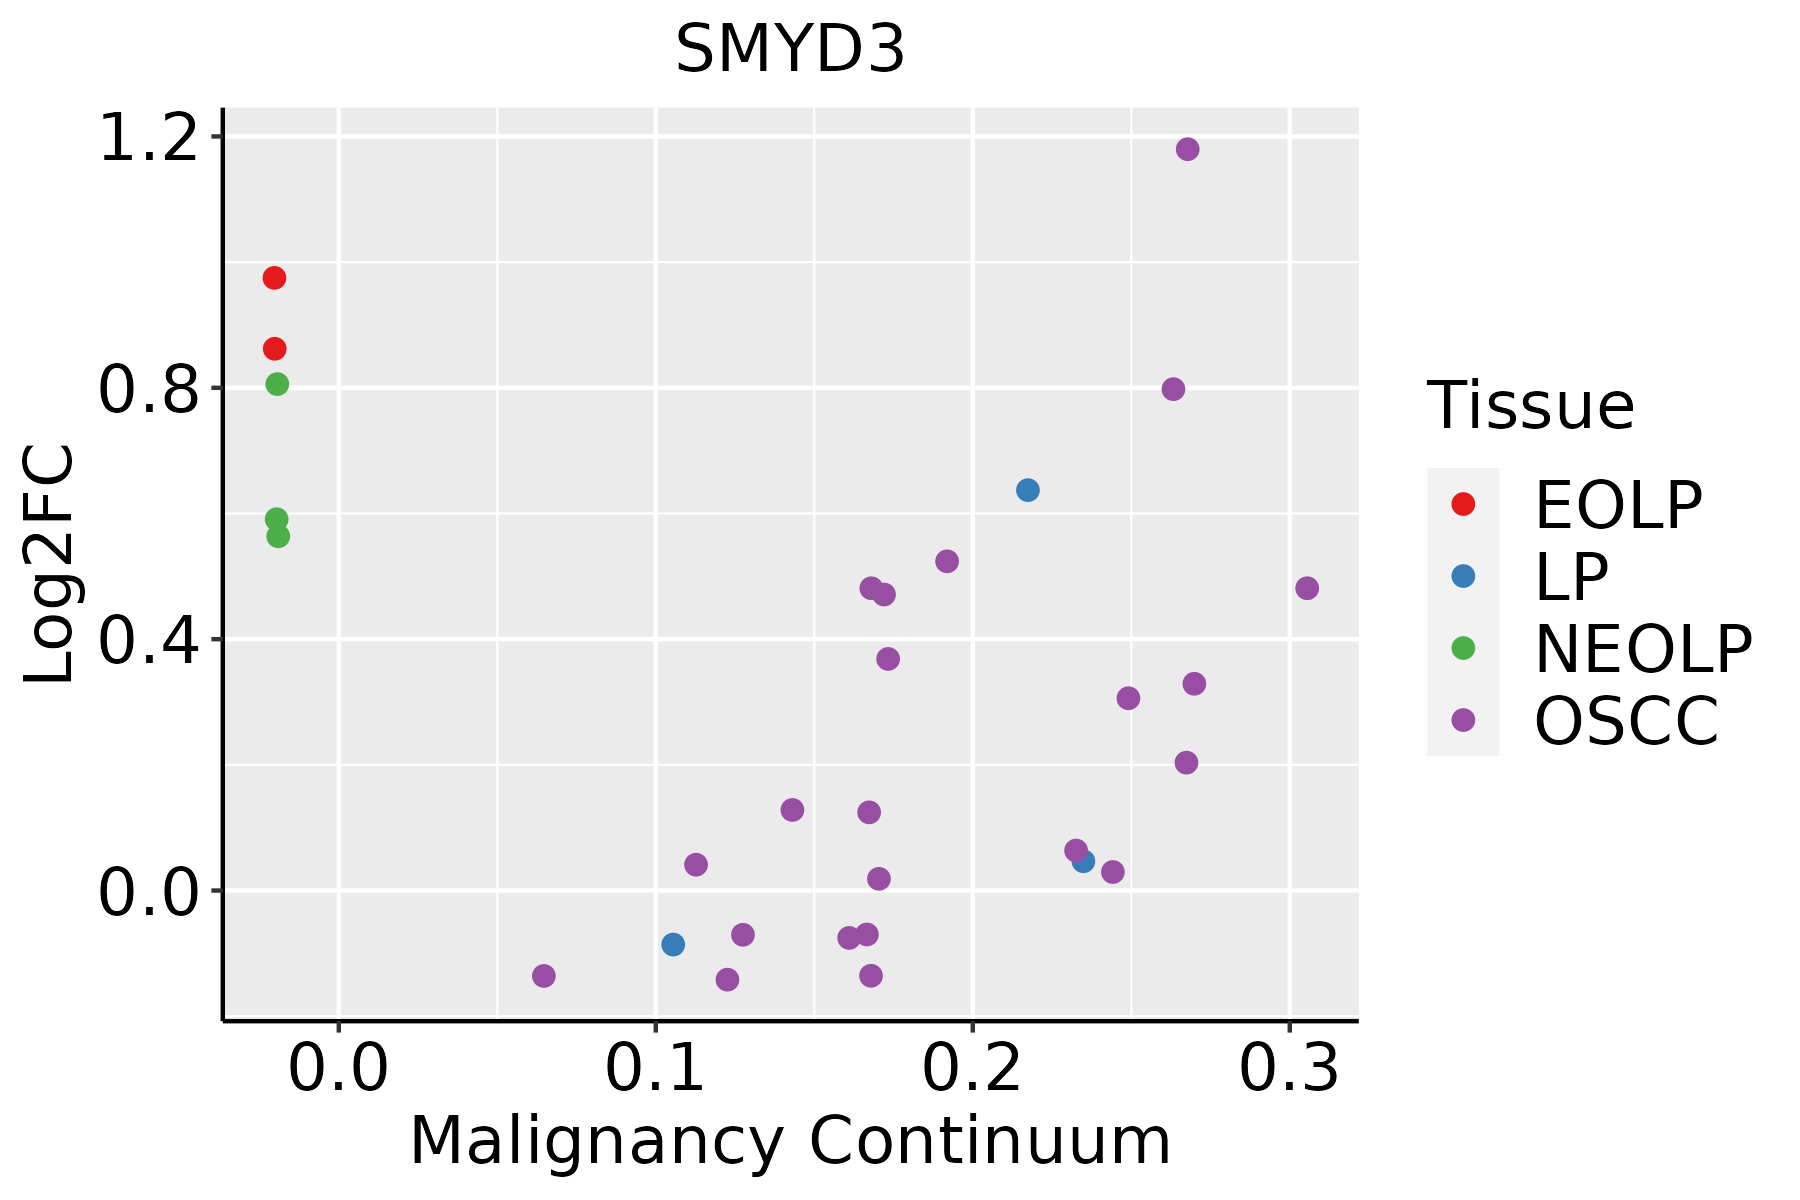 | EOLP: Erosive Oral lichen planus |
| LP: leukoplakia | ||
| NEOLP: Non-erosive oral lichen planus | ||
| OSCC: Oral squamous cell carcinoma | ||
| Prostate | 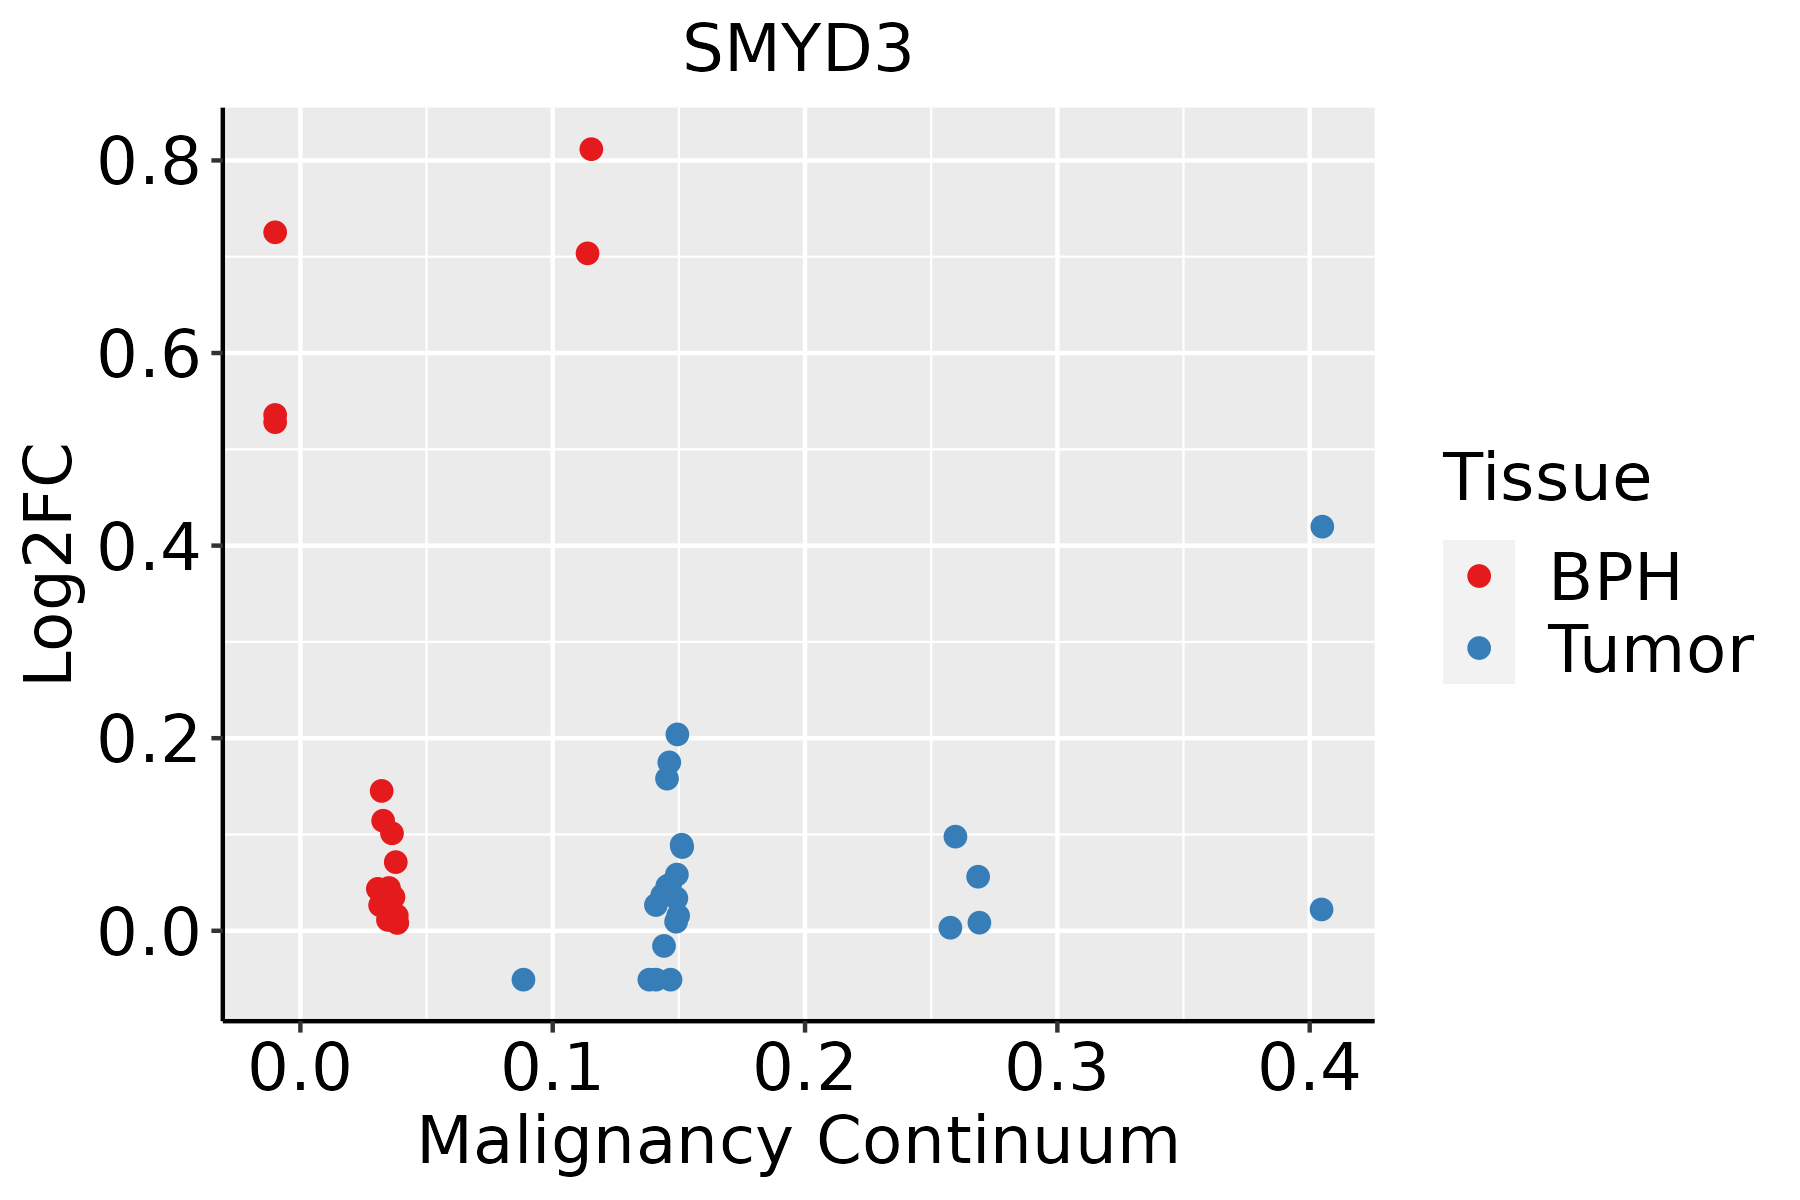 | BPH: Benign Prostatic Hyperplasia |
| Skin |  | AK: Actinic keratosis |
| cSCC: Cutaneous squamous cell carcinoma | ||
| SCCIS:squamous cell carcinoma in situ | ||
| Thyroid |  | ATC: Anaplastic thyroid cancer |
| HT: Hashimoto's thyroiditis | ||
| PTC: Papillary thyroid cancer |
| ∗log2FC in expression of this searched gene in stem-like cells from each diseased tissue sample relative to stem-like cells in normal samples in each tissue plotted against the malignancy continuum. Samples are colored based on if they are from different disease stage. |
Top |
Malignant transformation related pathway analysis |
| Find out the enriched GO biological processes and KEGG pathways involved in transition from healthy to precancer to cancer |
| Tissue | Disease Stage | Enriched GO biological Processes |
| Colorectum | AD |  |
| Colorectum | SER |  |
| Colorectum | MSS |  |
| Colorectum | MSI-H |  |
| Colorectum | FAP |  |
| ∗Top 15 enriched GO BP terms are showed in the bar plot of each disease state in each tissue. Each row represents a significant GO biological process which is colored according to the -log10(p.adjust). |
| Page: 1 2 3 4 5 6 7 8 9 |
| GO ID | Tissue | Disease Stage | Description | Gene Ratio | Bg Ratio | pvalue | p.adjust | Count |
| GO:004854510 | Cervix | CC | response to steroid hormone | 74/2311 | 339/18723 | 5.71e-07 | 2.09e-05 | 74 |
| GO:005134810 | Cervix | CC | negative regulation of transferase activity | 60/2311 | 268/18723 | 2.77e-06 | 8.02e-05 | 60 |
| GO:004593610 | Cervix | CC | negative regulation of phosphate metabolic process | 88/2311 | 441/18723 | 2.92e-06 | 8.27e-05 | 88 |
| GO:001056310 | Cervix | CC | negative regulation of phosphorus metabolic process | 88/2311 | 442/18723 | 3.21e-06 | 8.77e-05 | 88 |
| GO:004232610 | Cervix | CC | negative regulation of phosphorylation | 77/2311 | 385/18723 | 1.09e-05 | 2.38e-04 | 77 |
| GO:190165410 | Cervix | CC | response to ketone | 45/2311 | 194/18723 | 1.83e-05 | 3.44e-04 | 45 |
| GO:000193310 | Cervix | CC | negative regulation of protein phosphorylation | 69/2311 | 342/18723 | 2.29e-05 | 4.01e-04 | 69 |
| GO:000646910 | Cervix | CC | negative regulation of protein kinase activity | 47/2311 | 212/18723 | 4.13e-05 | 6.36e-04 | 47 |
| GO:00063257 | Cervix | CC | chromatin organization | 78/2311 | 409/18723 | 5.40e-05 | 8.02e-04 | 78 |
| GO:00319609 | Cervix | CC | response to corticosteroid | 39/2311 | 167/18723 | 5.48e-05 | 8.06e-04 | 39 |
| GO:00181057 | Cervix | CC | peptidyl-serine phosphorylation | 63/2311 | 315/18723 | 6.65e-05 | 9.47e-04 | 63 |
| GO:00336739 | Cervix | CC | negative regulation of kinase activity | 50/2311 | 237/18723 | 9.22e-05 | 1.21e-03 | 50 |
| GO:00182096 | Cervix | CC | peptidyl-serine modification | 66/2311 | 338/18723 | 9.58e-05 | 1.25e-03 | 66 |
| GO:00513849 | Cervix | CC | response to glucocorticoid | 35/2311 | 148/18723 | 9.87e-05 | 1.27e-03 | 35 |
| GO:00165705 | Cervix | CC | histone modification | 84/2311 | 463/18723 | 1.70e-04 | 2.01e-03 | 84 |
| GO:00349685 | Cervix | CC | histone lysine methylation | 27/2311 | 115/18723 | 6.61e-04 | 6.09e-03 | 27 |
| GO:00426924 | Cervix | CC | muscle cell differentiation | 69/2311 | 384/18723 | 8.12e-04 | 7.09e-03 | 69 |
| GO:00165715 | Cervix | CC | histone methylation | 30/2311 | 141/18723 | 1.88e-03 | 1.39e-02 | 30 |
| GO:00713839 | Cervix | CC | cellular response to steroid hormone stimulus | 40/2311 | 204/18723 | 1.93e-03 | 1.42e-02 | 40 |
| GO:00180224 | Cervix | CC | peptidyl-lysine methylation | 28/2311 | 131/18723 | 2.43e-03 | 1.71e-02 | 28 |
| Page: 1 2 3 4 5 6 7 8 9 10 11 12 13 14 15 16 17 18 19 20 21 22 23 24 25 26 27 28 29 30 31 |
| Pathway ID | Tissue | Disease Stage | Description | Gene Ratio | Bg Ratio | pvalue | p.adjust | qvalue | Count |
| hsa00310 | Colorectum | AD | Lysine degradation | 27/2092 | 63/8465 | 1.17e-03 | 7.75e-03 | 4.94e-03 | 27 |
| hsa003101 | Colorectum | AD | Lysine degradation | 27/2092 | 63/8465 | 1.17e-03 | 7.75e-03 | 4.94e-03 | 27 |
| hsa003102 | Colorectum | MSS | Lysine degradation | 24/1875 | 63/8465 | 2.94e-03 | 1.39e-02 | 8.50e-03 | 24 |
| hsa003103 | Colorectum | MSS | Lysine degradation | 24/1875 | 63/8465 | 2.94e-03 | 1.39e-02 | 8.50e-03 | 24 |
| hsa003104 | Colorectum | FAP | Lysine degradation | 23/1404 | 63/8465 | 1.04e-04 | 9.46e-04 | 5.76e-04 | 23 |
| hsa003105 | Colorectum | FAP | Lysine degradation | 23/1404 | 63/8465 | 1.04e-04 | 9.46e-04 | 5.76e-04 | 23 |
| hsa0031010 | Esophagus | ESCC | Lysine degradation | 41/4205 | 63/8465 | 9.63e-03 | 2.27e-02 | 1.16e-02 | 41 |
| hsa0031013 | Esophagus | ESCC | Lysine degradation | 41/4205 | 63/8465 | 9.63e-03 | 2.27e-02 | 1.16e-02 | 41 |
| hsa0031041 | Liver | HCC | Lysine degradation | 47/4020 | 63/8465 | 1.02e-05 | 7.58e-05 | 4.22e-05 | 47 |
| hsa0031051 | Liver | HCC | Lysine degradation | 47/4020 | 63/8465 | 1.02e-05 | 7.58e-05 | 4.22e-05 | 47 |
| hsa003109 | Lung | IAC | Lysine degradation | 17/1053 | 63/8465 | 1.35e-03 | 8.63e-03 | 5.73e-03 | 17 |
| hsa0031012 | Lung | IAC | Lysine degradation | 17/1053 | 63/8465 | 1.35e-03 | 8.63e-03 | 5.73e-03 | 17 |
| hsa0031022 | Lung | AIS | Lysine degradation | 16/961 | 63/8465 | 1.41e-03 | 9.49e-03 | 6.07e-03 | 16 |
| hsa0031032 | Lung | AIS | Lysine degradation | 16/961 | 63/8465 | 1.41e-03 | 9.49e-03 | 6.07e-03 | 16 |
| hsa0031042 | Lung | MIAC | Lysine degradation | 10/507 | 63/8465 | 3.93e-03 | 3.18e-02 | 2.30e-02 | 10 |
| hsa0031052 | Lung | MIAC | Lysine degradation | 10/507 | 63/8465 | 3.93e-03 | 3.18e-02 | 2.30e-02 | 10 |
| Page: 1 |
Top |
Cell-cell communication analysis |
| Identification of potential cell-cell interactions between two cell types and their ligand-receptor pairs for different disease states |
| Ligand | Receptor | LRpair | Pathway | Tissue | Disease Stage |
| Page: 1 |
Top |
Single-cell gene regulatory network inference analysis |
| Find out the significant the regulons (TFs) and the target genes of each regulon across cell types for different disease states |
| TF | Cell Type | Tissue | Disease Stage | Target Gene | RSS | Regulon Activity |
| ∗The dot plots of a searched regulon are shown for all cell subpopulations in each disease state of each tissue based on the regulon specific score inferred using pySCENIC and by calculating the average expression. |
| Page: 1 |
Top |
Somatic mutation of malignant transformation related genes |
| Annotation of somatic variants for genes involved in malignant transformation |
| Hugo Symbol | Variant Class | Variant Classification | dbSNP RS | HGVSc | HGVSp | HGVSp Short | SWISSPROT | BIOTYPE | SIFT | PolyPhen | Tumor Sample Barcode | Tissue | Histology | Sex | Age | Stage | Therapy Types | Drugs | Outcome |
| SMYD3 | SNV | Missense_Mutation | c.1217N>A | p.Arg406Lys | p.R406K | Q9H7B4 | protein_coding | tolerated(0.97) | benign(0.038) | TCGA-A2-A0EM-01 | Breast | breast invasive carcinoma | Female | >=65 | I/II | Hormone Therapy | tamoxiphen | SD | |
| SMYD3 | SNV | Missense_Mutation | novel | c.148N>A | p.Asp50Asn | p.D50N | Q9H7B4 | protein_coding | tolerated(0.11) | possibly_damaging(0.47) | TCGA-A2-A0YK-01 | Breast | breast invasive carcinoma | Female | <65 | I/II | Chemotherapy | cytoxan | SD |
| SMYD3 | SNV | Missense_Mutation | c.203C>T | p.Ala68Val | p.A68V | Q9H7B4 | protein_coding | deleterious(0) | probably_damaging(0.992) | TCGA-A8-A0A2-01 | Breast | breast invasive carcinoma | Female | >=65 | I/II | Hormone Therapy | tamoxiphen | SD | |
| SMYD3 | SNV | Missense_Mutation | novel | c.442G>C | p.Val148Leu | p.V148L | Q9H7B4 | protein_coding | tolerated(0.12) | benign(0.007) | TCGA-AC-A3W5-01 | Breast | breast invasive carcinoma | Female | >=65 | I/II | Chemotherapy | docetaxel | CR |
| SMYD3 | SNV | Missense_Mutation | novel | c.656C>A | p.Pro219His | p.P219H | Q9H7B4 | protein_coding | tolerated(0.26) | possibly_damaging(0.461) | TCGA-AO-A0J5-01 | Breast | breast invasive carcinoma | Female | <65 | III/IV | Other, specify in notesBisphosphonate | zoledronic | PD |
| SMYD3 | SNV | Missense_Mutation | c.620N>T | p.Ser207Ile | p.S207I | Q9H7B4 | protein_coding | deleterious(0.01) | possibly_damaging(0.538) | TCGA-B6-A0I2-01 | Breast | breast invasive carcinoma | Female | <65 | I/II | Unknown | Unknown | SD | |
| SMYD3 | SNV | Missense_Mutation | c.920N>T | p.Ala307Val | p.A307V | Q9H7B4 | protein_coding | tolerated(0.22) | benign(0.164) | TCGA-BH-A0HF-01 | Breast | breast invasive carcinoma | Female | >=65 | I/II | Hormone Therapy | arimidex | SD | |
| SMYD3 | SNV | Missense_Mutation | c.313N>G | p.Leu105Val | p.L105V | Q9H7B4 | protein_coding | tolerated(1) | benign(0.017) | TCGA-D8-A27G-01 | Breast | breast invasive carcinoma | Female | >=65 | I/II | Unknown | Unknown | SD | |
| SMYD3 | SNV | Missense_Mutation | novel | c.353C>T | p.Ser118Leu | p.S118L | Q9H7B4 | protein_coding | tolerated(0.08) | possibly_damaging(0.456) | TCGA-DS-A1OB-01 | Cervix | cervical & endocervical cancer | Female | <65 | I/II | Chemotherapy | carboplatin | PD |
| SMYD3 | SNV | Missense_Mutation | c.344G>T | p.Gly115Val | p.G115V | Q9H7B4 | protein_coding | tolerated(0.16) | benign(0.024) | TCGA-AA-A00N-01 | Colorectum | colon adenocarcinoma | Male | >=65 | I/II | Unknown | Unknown | PD |
| Page: 1 2 3 4 5 |
Top |
Related drugs of malignant transformation related genes |
| Identification of chemicals and drugs interact with genes involved in malignant transfromation |
| (DGIdb 4.0) |
| Entrez ID | Symbol | Category | Interaction Types | Drug Claim Name | Drug Name | PMIDs |
| Page: 1 |

Copyright 2023-Present -The University of Texas Health Science Center at Houston |