
|
|||||
|
 | |
| |
| |
| |
| |
| |
|
Gene: SMTN |
Gene summary for SMTN |
| Gene information | Species | Human | Gene symbol | SMTN | Gene ID | 6525 |
| Gene name | smoothelin | |
| Gene Alias | SMTN | |
| Cytomap | 22q12.2 | |
| Gene Type | protein-coding | GO ID | GO:0003008 | UniProtAcc | A0A087X1R1 |
Top |
Malignant transformation analysis |
| Identification of the aberrant gene expression in precancerous and cancerous lesions by comparing the gene expression of stem-like cells in diseased tissues with normal stem cells |
| Entrez ID | Symbol | Replicates | Species | Organ | Tissue | Adj P-value | Log2FC | Malignancy |
| 6525 | SMTN | HTA11_3410_2000001011 | Human | Colorectum | AD | 2.51e-03 | 9.19e-02 | 0.0155 |
| 6525 | SMTN | HTA11_1391_2000001011 | Human | Colorectum | AD | 1.29e-02 | 4.07e-01 | -0.059 |
| 6525 | SMTN | HTA11_7696_3000711011 | Human | Colorectum | AD | 1.16e-16 | 5.76e-01 | 0.0674 |
| 6525 | SMTN | HTA11_99999974143_84620 | Human | Colorectum | MSS | 6.14e-07 | 3.07e-01 | 0.3005 |
| 6525 | SMTN | A015-C-203 | Human | Colorectum | FAP | 2.68e-03 | 1.36e-01 | -0.1294 |
| 6525 | SMTN | A002-C-116 | Human | Colorectum | FAP | 5.97e-04 | -1.74e-01 | -0.0452 |
| 6525 | SMTN | LZE4T | Human | Esophagus | ESCC | 1.24e-08 | 1.90e-01 | 0.0811 |
| 6525 | SMTN | LZE7T | Human | Esophagus | ESCC | 1.67e-02 | 8.67e-02 | 0.0667 |
| 6525 | SMTN | LZE20T | Human | Esophagus | ESCC | 4.73e-02 | 5.19e-02 | 0.0662 |
| 6525 | SMTN | LZE24T | Human | Esophagus | ESCC | 7.56e-08 | 8.76e-02 | 0.0596 |
| 6525 | SMTN | P1T-E | Human | Esophagus | ESCC | 5.85e-08 | 3.25e-01 | 0.0875 |
| 6525 | SMTN | P2T-E | Human | Esophagus | ESCC | 6.40e-03 | 3.68e-02 | 0.1177 |
| 6525 | SMTN | P4T-E | Human | Esophagus | ESCC | 1.49e-07 | 1.95e-01 | 0.1323 |
| 6525 | SMTN | P5T-E | Human | Esophagus | ESCC | 6.87e-04 | 3.33e-02 | 0.1327 |
| 6525 | SMTN | P8T-E | Human | Esophagus | ESCC | 6.01e-09 | 4.29e-02 | 0.0889 |
| 6525 | SMTN | P9T-E | Human | Esophagus | ESCC | 5.73e-10 | 1.50e-01 | 0.1131 |
| 6525 | SMTN | P10T-E | Human | Esophagus | ESCC | 4.26e-09 | 2.11e-01 | 0.116 |
| 6525 | SMTN | P11T-E | Human | Esophagus | ESCC | 8.39e-15 | 5.18e-01 | 0.1426 |
| 6525 | SMTN | P12T-E | Human | Esophagus | ESCC | 4.88e-11 | 1.57e-01 | 0.1122 |
| 6525 | SMTN | P15T-E | Human | Esophagus | ESCC | 1.11e-05 | 1.68e-01 | 0.1149 |
| Page: 1 2 3 4 5 |
| Tissue | Expression Dynamics | Abbreviation |
| Colorectum (GSE201348) |  | FAP: Familial adenomatous polyposis |
| CRC: Colorectal cancer | ||
| Colorectum (HTA11) |  | AD: Adenomas |
| SER: Sessile serrated lesions | ||
| MSI-H: Microsatellite-high colorectal cancer | ||
| MSS: Microsatellite stable colorectal cancer | ||
| Esophagus | 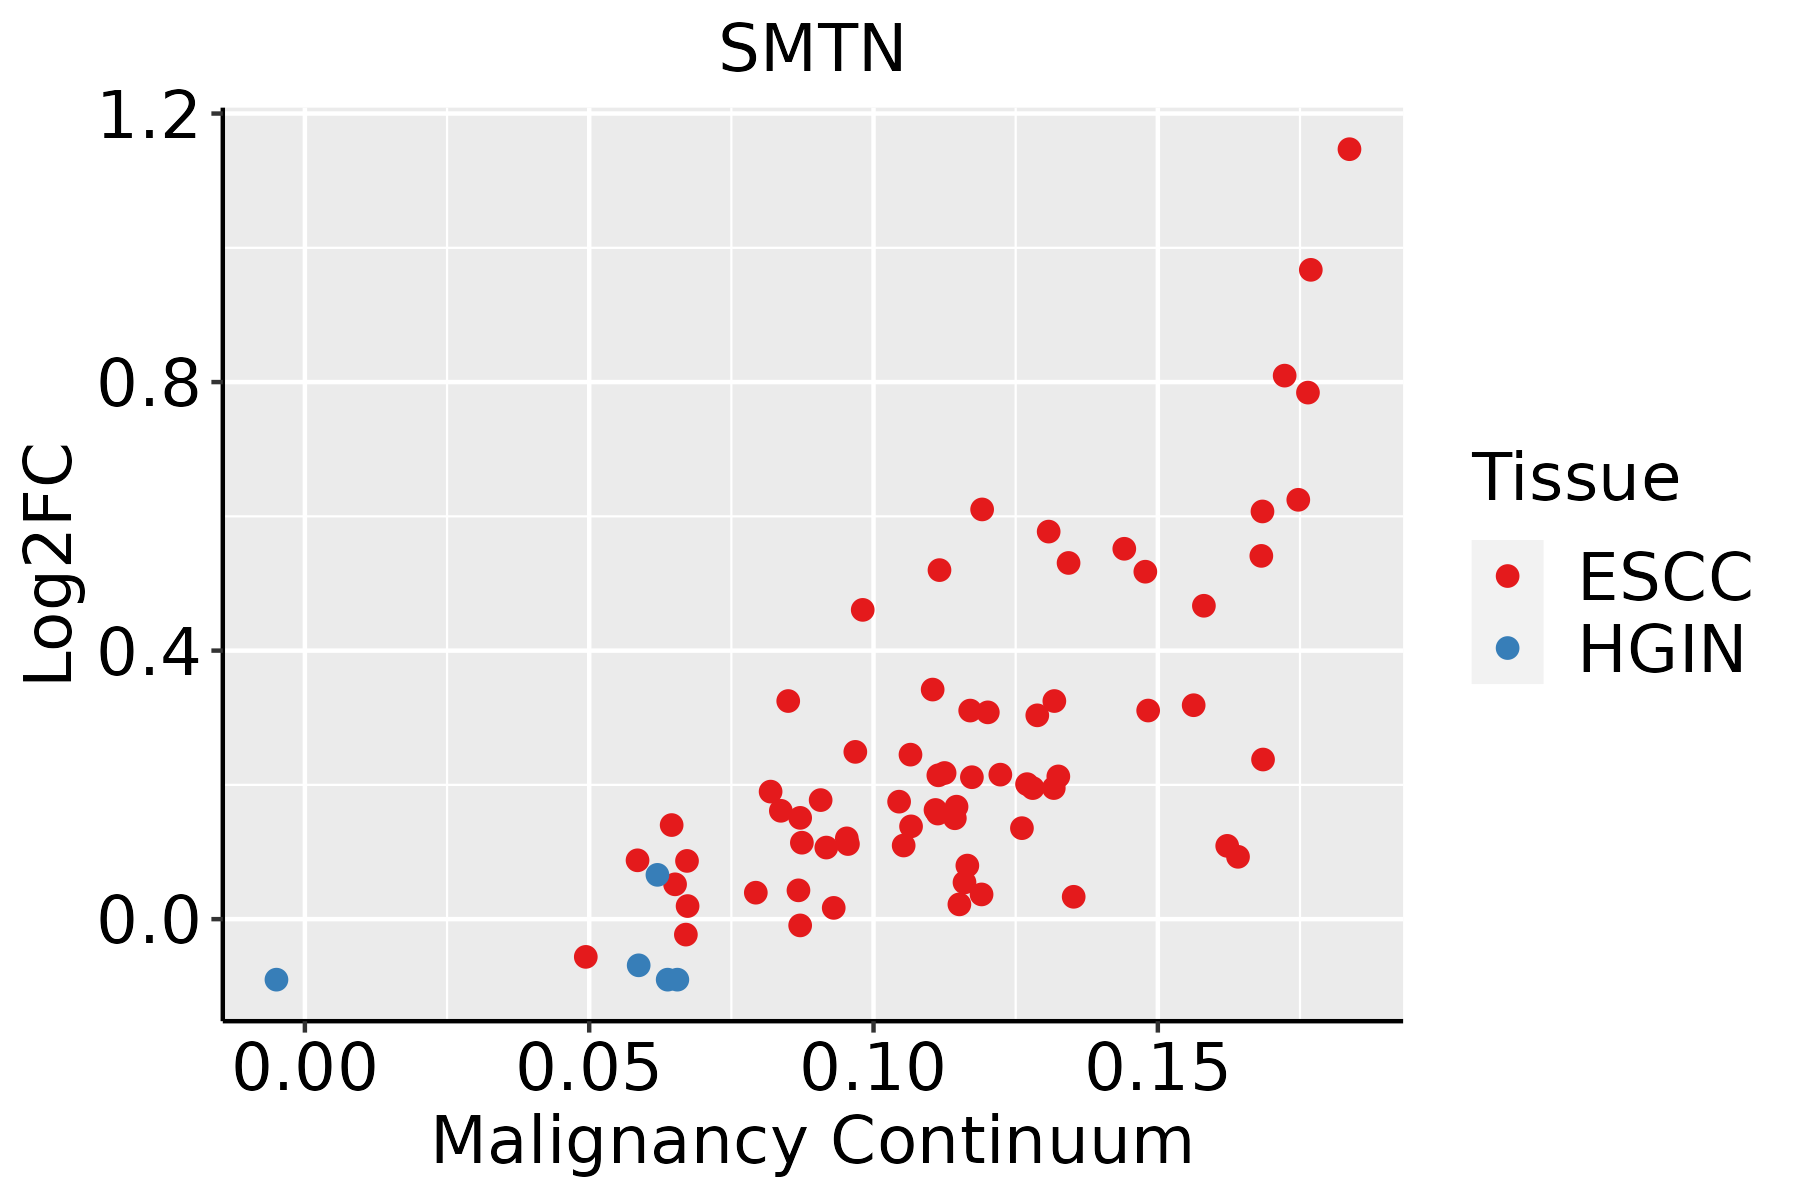 | ESCC: Esophageal squamous cell carcinoma |
| HGIN: High-grade intraepithelial neoplasias | ||
| LGIN: Low-grade intraepithelial neoplasias | ||
| Liver | 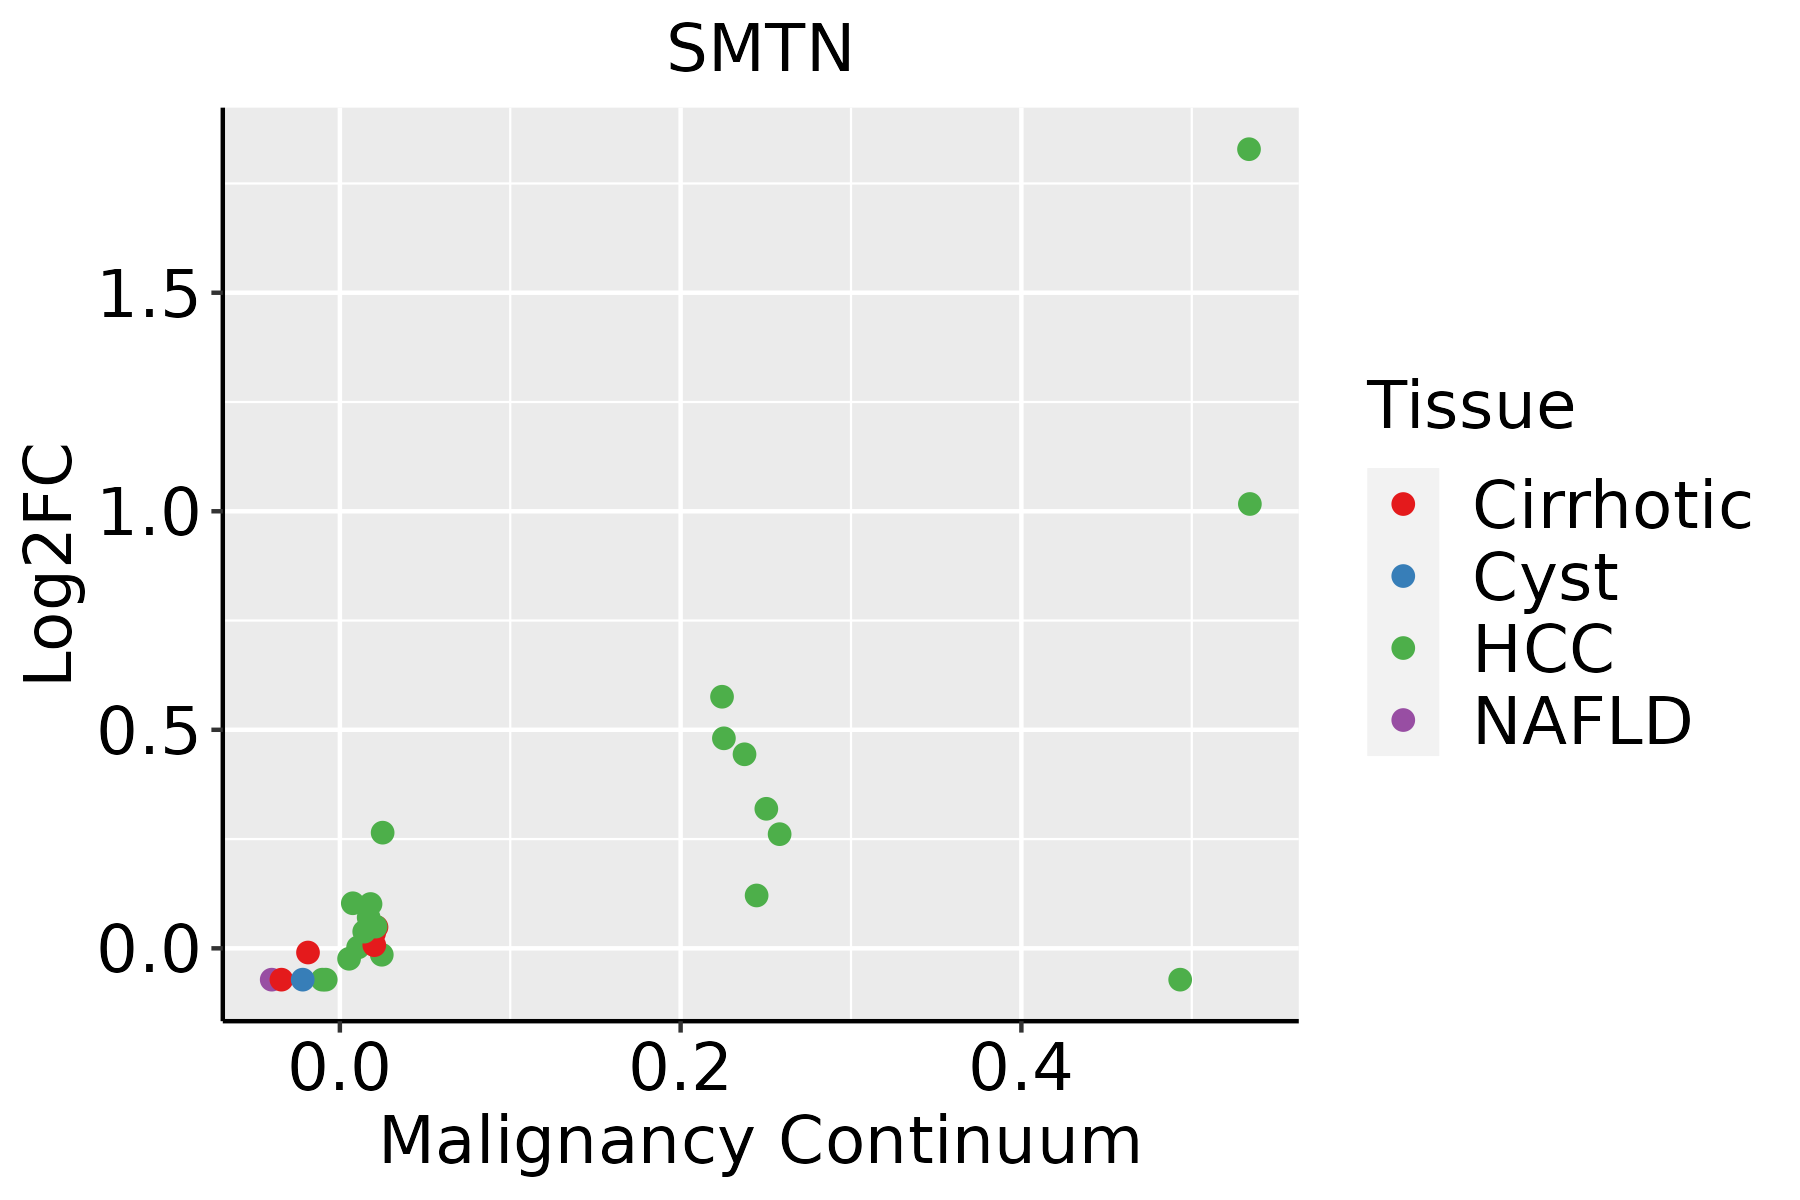 | HCC: Hepatocellular carcinoma |
| NAFLD: Non-alcoholic fatty liver disease | ||
| Oral Cavity | 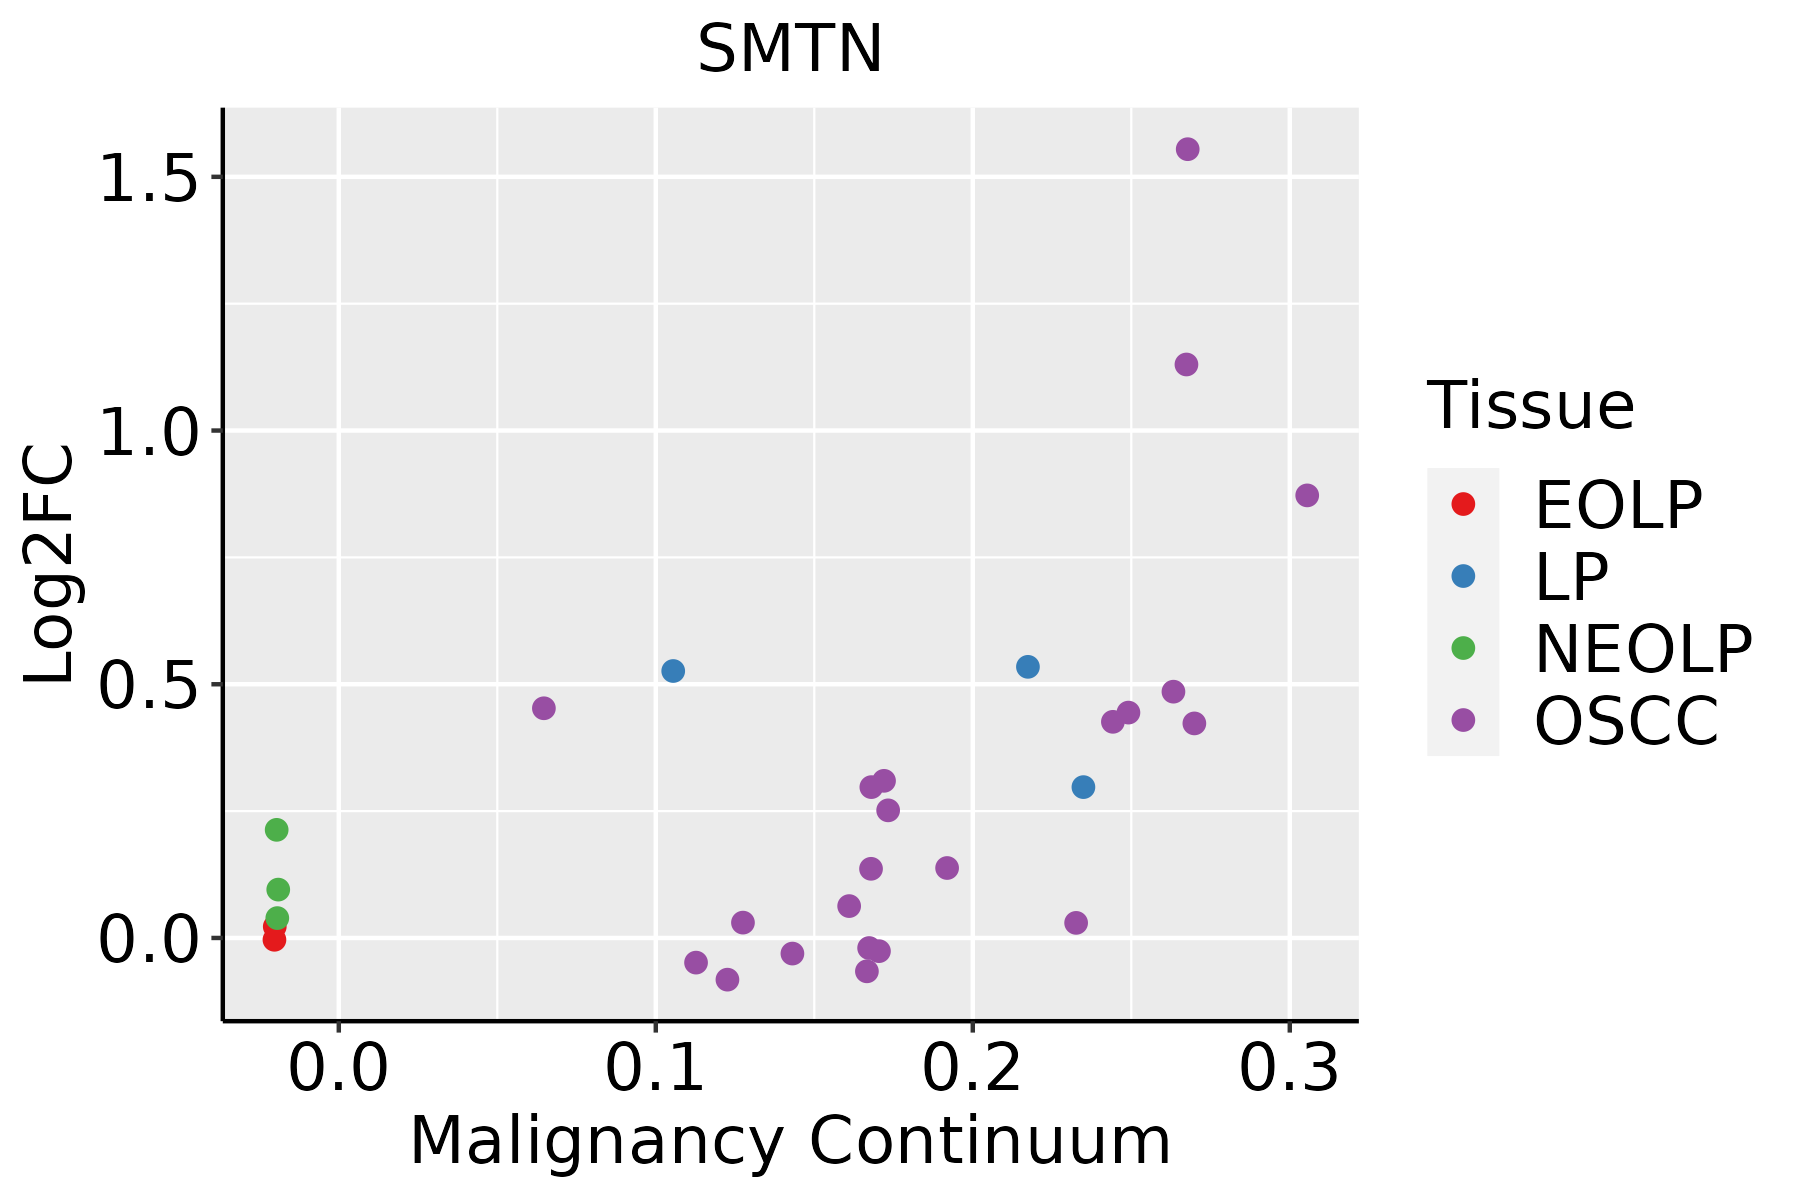 | EOLP: Erosive Oral lichen planus |
| LP: leukoplakia | ||
| NEOLP: Non-erosive oral lichen planus | ||
| OSCC: Oral squamous cell carcinoma | ||
| Skin | 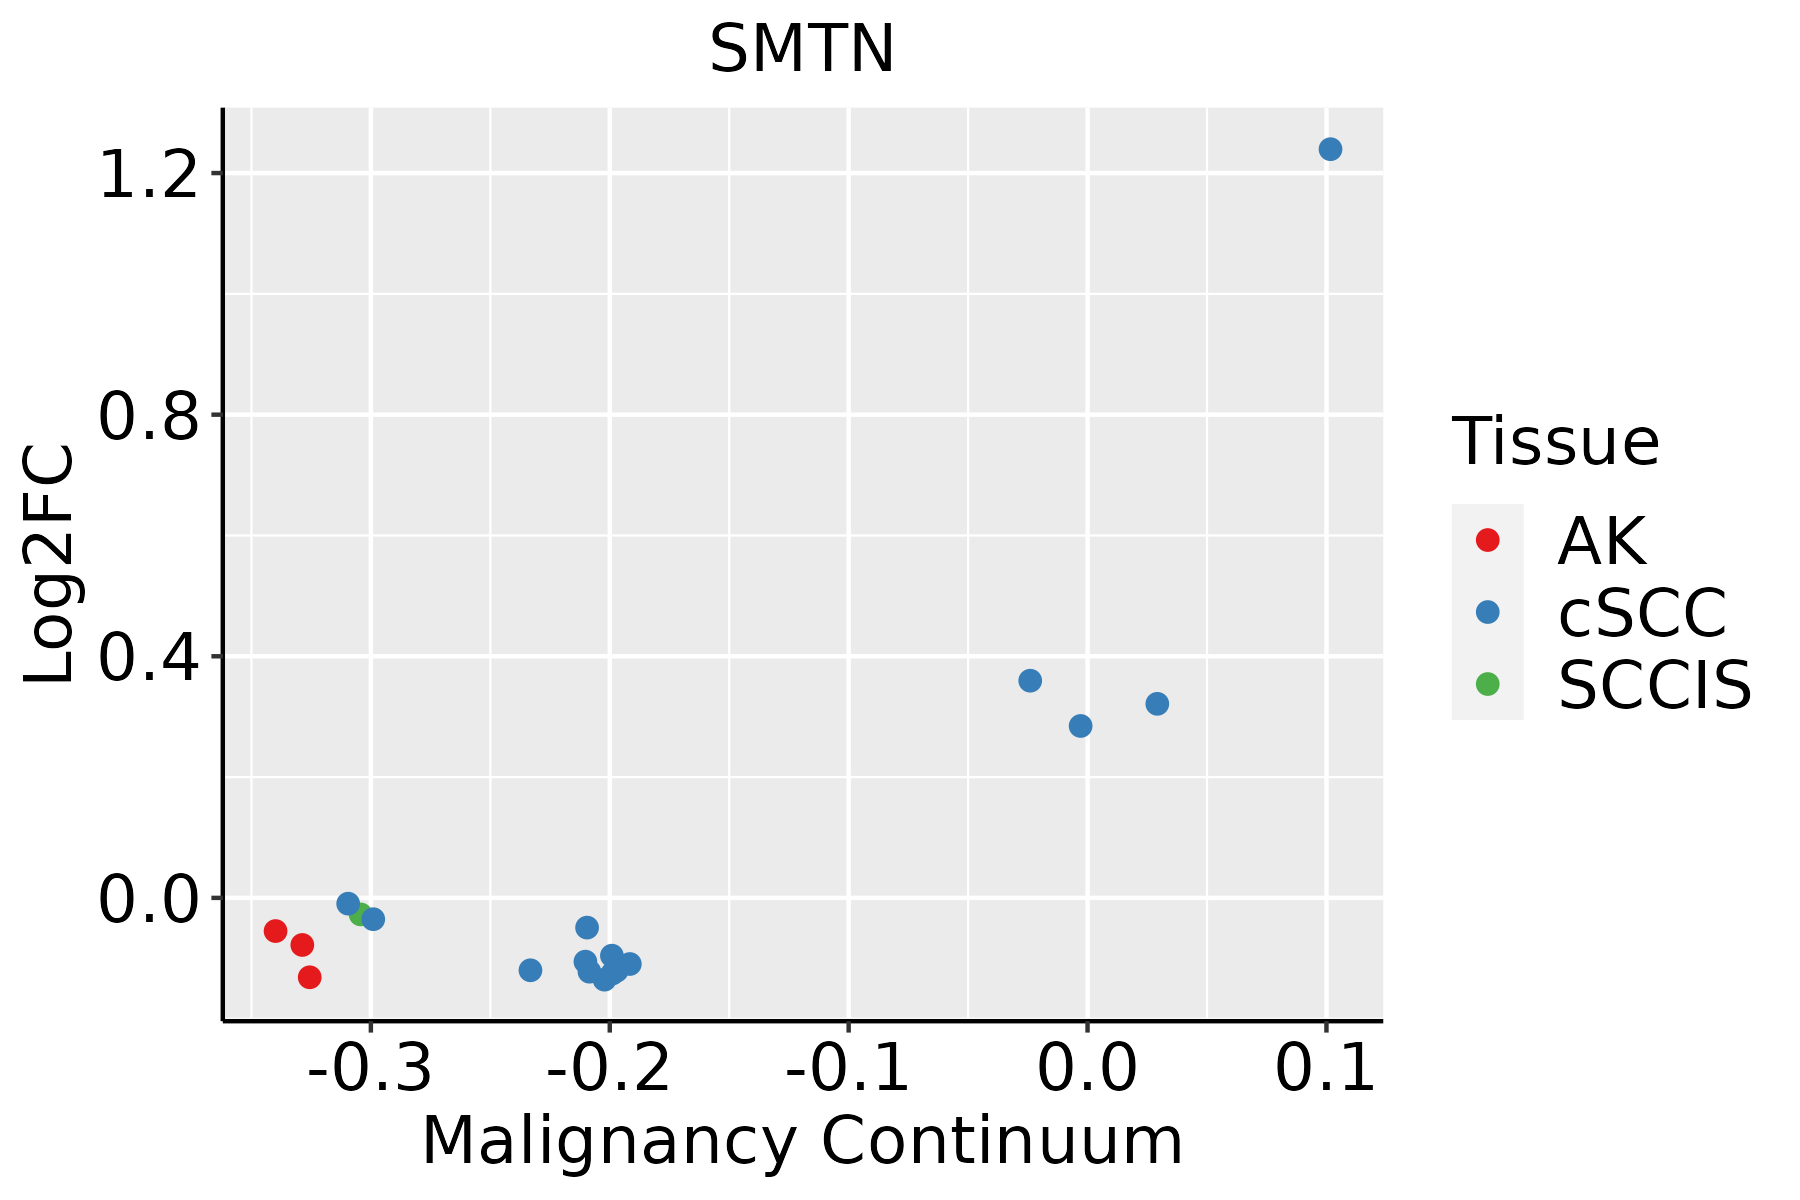 | AK: Actinic keratosis |
| cSCC: Cutaneous squamous cell carcinoma | ||
| SCCIS:squamous cell carcinoma in situ | ||
| Thyroid | 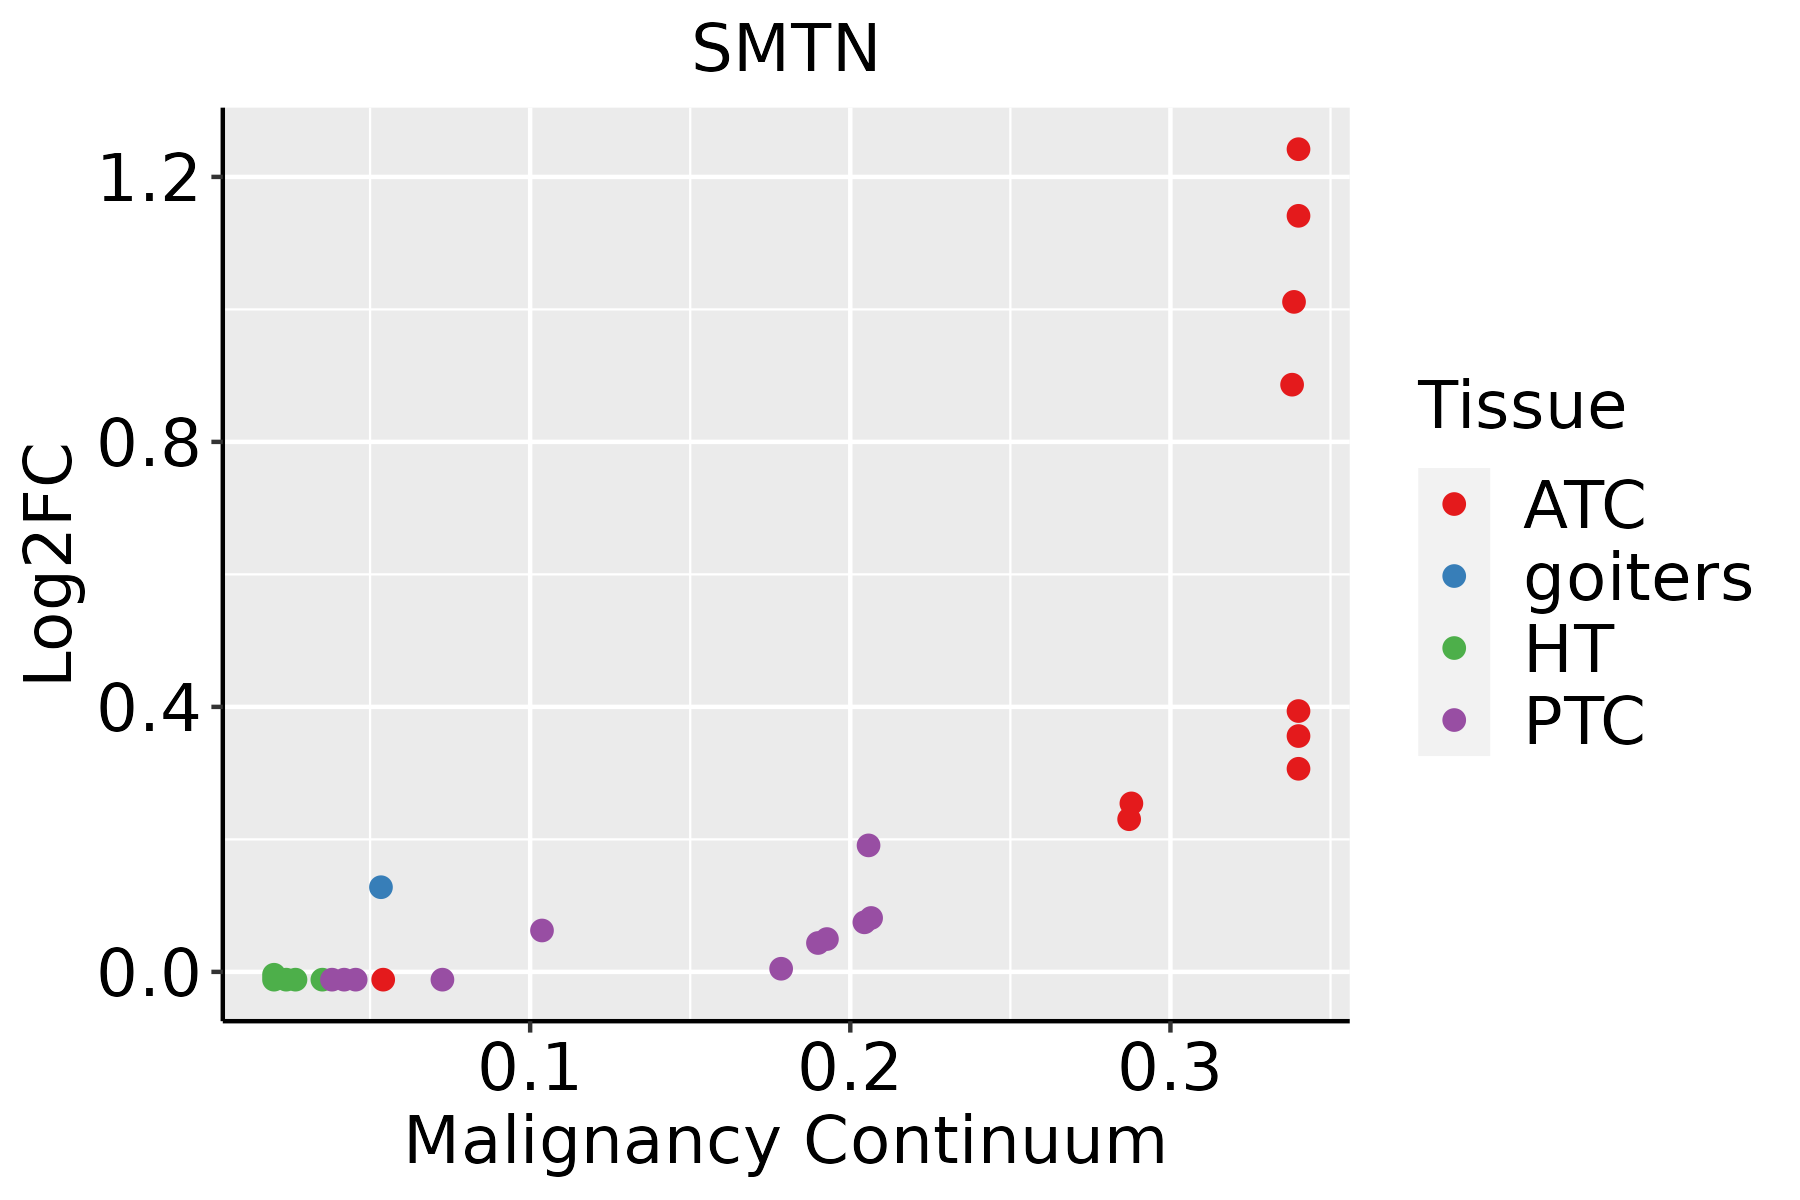 | ATC: Anaplastic thyroid cancer |
| HT: Hashimoto's thyroiditis | ||
| PTC: Papillary thyroid cancer |
| ∗log2FC in expression of this searched gene in stem-like cells from each diseased tissue sample relative to stem-like cells in normal samples in each tissue plotted against the malignancy continuum. Samples are colored based on if they are from different disease stage. |
Top |
Malignant transformation related pathway analysis |
| Find out the enriched GO biological processes and KEGG pathways involved in transition from healthy to precancer to cancer |
| Tissue | Disease Stage | Enriched GO biological Processes |
| Colorectum | AD |  |
| Colorectum | SER |  |
| Colorectum | MSS |  |
| Colorectum | MSI-H |  |
| Colorectum | FAP |  |
| ∗Top 15 enriched GO BP terms are showed in the bar plot of each disease state in each tissue. Each row represents a significant GO biological process which is colored according to the -log10(p.adjust). |
| Page: 1 2 3 4 5 6 7 8 9 |
| GO ID | Tissue | Disease Stage | Description | Gene Ratio | Bg Ratio | pvalue | p.adjust | Count |
| GO:00030121 | Colorectum | MSS | muscle system process | 105/3467 | 452/18723 | 6.39e-03 | 4.26e-02 | 105 |
| GO:00030122 | Colorectum | FAP | muscle system process | 89/2622 | 452/18723 | 4.63e-04 | 5.39e-03 | 89 |
| GO:000751716 | Thyroid | ATC | muscle organ development | 139/6293 | 327/18723 | 4.45e-04 | 2.64e-03 | 139 |
| Page: 1 |
| Pathway ID | Tissue | Disease Stage | Description | Gene Ratio | Bg Ratio | pvalue | p.adjust | qvalue | Count |
| Page: 1 |
Top |
Cell-cell communication analysis |
| Identification of potential cell-cell interactions between two cell types and their ligand-receptor pairs for different disease states |
| Ligand | Receptor | LRpair | Pathway | Tissue | Disease Stage |
| Page: 1 |
Top |
Single-cell gene regulatory network inference analysis |
| Find out the significant the regulons (TFs) and the target genes of each regulon across cell types for different disease states |
| TF | Cell Type | Tissue | Disease Stage | Target Gene | RSS | Regulon Activity |
| ∗The dot plots of a searched regulon are shown for all cell subpopulations in each disease state of each tissue based on the regulon specific score inferred using pySCENIC and by calculating the average expression. |
| Page: 1 |
Top |
Somatic mutation of malignant transformation related genes |
| Annotation of somatic variants for genes involved in malignant transformation |
| Hugo Symbol | Variant Class | Variant Classification | dbSNP RS | HGVSc | HGVSp | HGVSp Short | SWISSPROT | BIOTYPE | SIFT | PolyPhen | Tumor Sample Barcode | Tissue | Histology | Sex | Age | Stage | Therapy Types | Drugs | Outcome |
| SMTN | SNV | Missense_Mutation | novel | c.2514N>C | p.Gln838His | p.Q838H | protein_coding | deleterious(0) | probably_damaging(0.997) | TCGA-5L-AAT1-01 | Breast | breast invasive carcinoma | Female | <65 | III/IV | Hormone Therapy | letrozol | SD | |
| SMTN | SNV | Missense_Mutation | c.847N>A | p.Glu283Lys | p.E283K | protein_coding | tolerated(0.2) | benign(0.045) | TCGA-AC-A23H-01 | Breast | breast invasive carcinoma | Female | >=65 | I/II | Unknown | Unknown | PD | ||
| SMTN | SNV | Missense_Mutation | c.320N>A | p.Arg107His | p.R107H | protein_coding | deleterious(0) | probably_damaging(0.999) | TCGA-AO-A0J4-01 | Breast | breast invasive carcinoma | Female | <65 | I/II | Chemotherapy | doxorubicin | SD | ||
| SMTN | SNV | Missense_Mutation | c.586N>G | p.Arg196Gly | p.R196G | protein_coding | deleterious(0.02) | benign(0.018) | TCGA-B6-A0IJ-01 | Breast | breast invasive carcinoma | Female | <65 | I/II | Unknown | Unknown | SD | ||
| SMTN | SNV | Missense_Mutation | c.2987N>A | p.Arg996His | p.R996H | protein_coding | deleterious(0) | benign(0.36) | TCGA-BH-A18G-01 | Breast | breast invasive carcinoma | Female | >=65 | I/II | Unknown | Unknown | SD | ||
| SMTN | SNV | Missense_Mutation | novel | c.1699N>C | p.Asn567His | p.N567H | protein_coding | tolerated(0.07) | possibly_damaging(0.712) | TCGA-PL-A8LV-01 | Breast | breast invasive carcinoma | Female | <65 | III/IV | Unknown | Unknown | SD | |
| SMTN | SNV | Missense_Mutation | rs760671053 | c.244N>T | p.Arg82Trp | p.R82W | protein_coding | deleterious(0) | probably_damaging(0.999) | TCGA-2W-A8YY-01 | Cervix | cervical & endocervical cancer | Female | <65 | I/II | Chemotherapy | cisplatin | CR | |
| SMTN | SNV | Missense_Mutation | novel | c.485N>A | p.Arg162His | p.R162H | protein_coding | deleterious(0) | probably_damaging(0.91) | TCGA-EA-A3HS-01 | Cervix | cervical & endocervical cancer | Female | <65 | I/II | Unknown | Unknown | SD | |
| SMTN | SNV | Missense_Mutation | c.2801N>T | p.Gly934Val | p.G934V | protein_coding | deleterious(0.01) | probably_damaging(0.974) | TCGA-A6-2686-01 | Colorectum | colon adenocarcinoma | Female | >=65 | I/II | Unknown | Unknown | SD | ||
| SMTN | SNV | Missense_Mutation | c.2024N>T | p.Gly675Val | p.G675V | protein_coding | tolerated(0.12) | possibly_damaging(0.667) | TCGA-AA-3492-01 | Colorectum | colon adenocarcinoma | Female | >=65 | I/II | Unknown | Unknown | SD |
| Page: 1 2 3 4 5 6 7 8 9 10 11 12 |
Top |
Related drugs of malignant transformation related genes |
| Identification of chemicals and drugs interact with genes involved in malignant transfromation |
| (DGIdb 4.0) |
| Entrez ID | Symbol | Category | Interaction Types | Drug Claim Name | Drug Name | PMIDs |
| 6525 | SMTN | NA | TRANSFORMING GROWTH FACTOR | 12390831 |
| Page: 1 |

Copyright 2023-Present -The University of Texas Health Science Center at Houston |