
|
|||||
|
 | |
| |
| |
| |
| |
| |
|
Gene: SMS |
Gene summary for SMS |
| Gene information | Species | Human | Gene symbol | SMS | Gene ID | 6611 |
| Gene name | spermine synthase | |
| Gene Alias | MRSR | |
| Cytomap | Xp22.11 | |
| Gene Type | protein-coding | GO ID | GO:0000096 | UniProtAcc | P52788 |
Top |
Malignant transformation analysis |
| Identification of the aberrant gene expression in precancerous and cancerous lesions by comparing the gene expression of stem-like cells in diseased tissues with normal stem cells |
| Entrez ID | Symbol | Replicates | Species | Organ | Tissue | Adj P-value | Log2FC | Malignancy |
| 6611 | SMS | GSM4909285 | Human | Breast | IDC | 2.18e-02 | -2.17e-01 | 0.21 |
| 6611 | SMS | GSM4909286 | Human | Breast | IDC | 5.50e-03 | -3.74e-02 | 0.1081 |
| 6611 | SMS | GSM4909294 | Human | Breast | IDC | 2.53e-03 | -2.89e-02 | 0.2022 |
| 6611 | SMS | GSM4909296 | Human | Breast | IDC | 1.04e-14 | -4.99e-01 | 0.1524 |
| 6611 | SMS | GSM4909297 | Human | Breast | IDC | 8.64e-16 | -2.80e-01 | 0.1517 |
| 6611 | SMS | GSM4909301 | Human | Breast | IDC | 5.79e-09 | -3.71e-01 | 0.1577 |
| 6611 | SMS | GSM4909304 | Human | Breast | IDC | 2.98e-17 | 4.92e-01 | 0.1636 |
| 6611 | SMS | GSM4909308 | Human | Breast | IDC | 3.19e-04 | 1.15e-01 | 0.158 |
| 6611 | SMS | GSM4909309 | Human | Breast | IDC | 5.04e-04 | -3.63e-01 | 0.0483 |
| 6611 | SMS | GSM4909311 | Human | Breast | IDC | 4.92e-37 | -5.05e-01 | 0.1534 |
| 6611 | SMS | GSM4909312 | Human | Breast | IDC | 4.00e-07 | 3.17e-02 | 0.1552 |
| 6611 | SMS | GSM4909318 | Human | Breast | IDC | 1.72e-05 | 4.65e-01 | 0.2031 |
| 6611 | SMS | GSM4909319 | Human | Breast | IDC | 1.24e-43 | -4.63e-01 | 0.1563 |
| 6611 | SMS | GSM4909321 | Human | Breast | IDC | 5.47e-11 | -7.61e-02 | 0.1559 |
| 6611 | SMS | brca1 | Human | Breast | Precancer | 2.60e-17 | 5.75e-01 | -0.0338 |
| 6611 | SMS | brca2 | Human | Breast | Precancer | 7.15e-04 | 1.67e-01 | -0.024 |
| 6611 | SMS | brca3 | Human | Breast | Precancer | 1.12e-09 | 3.90e-01 | -0.0263 |
| 6611 | SMS | NCCBC14 | Human | Breast | DCIS | 2.69e-08 | -1.50e-01 | 0.2021 |
| 6611 | SMS | NCCBC3 | Human | Breast | DCIS | 1.36e-04 | -3.06e-01 | 0.1198 |
| 6611 | SMS | NCCBC5 | Human | Breast | DCIS | 5.19e-14 | 9.19e-02 | 0.2046 |
| Page: 1 2 3 4 5 6 7 8 9 10 11 12 |
| Tissue | Expression Dynamics | Abbreviation |
| Breast | 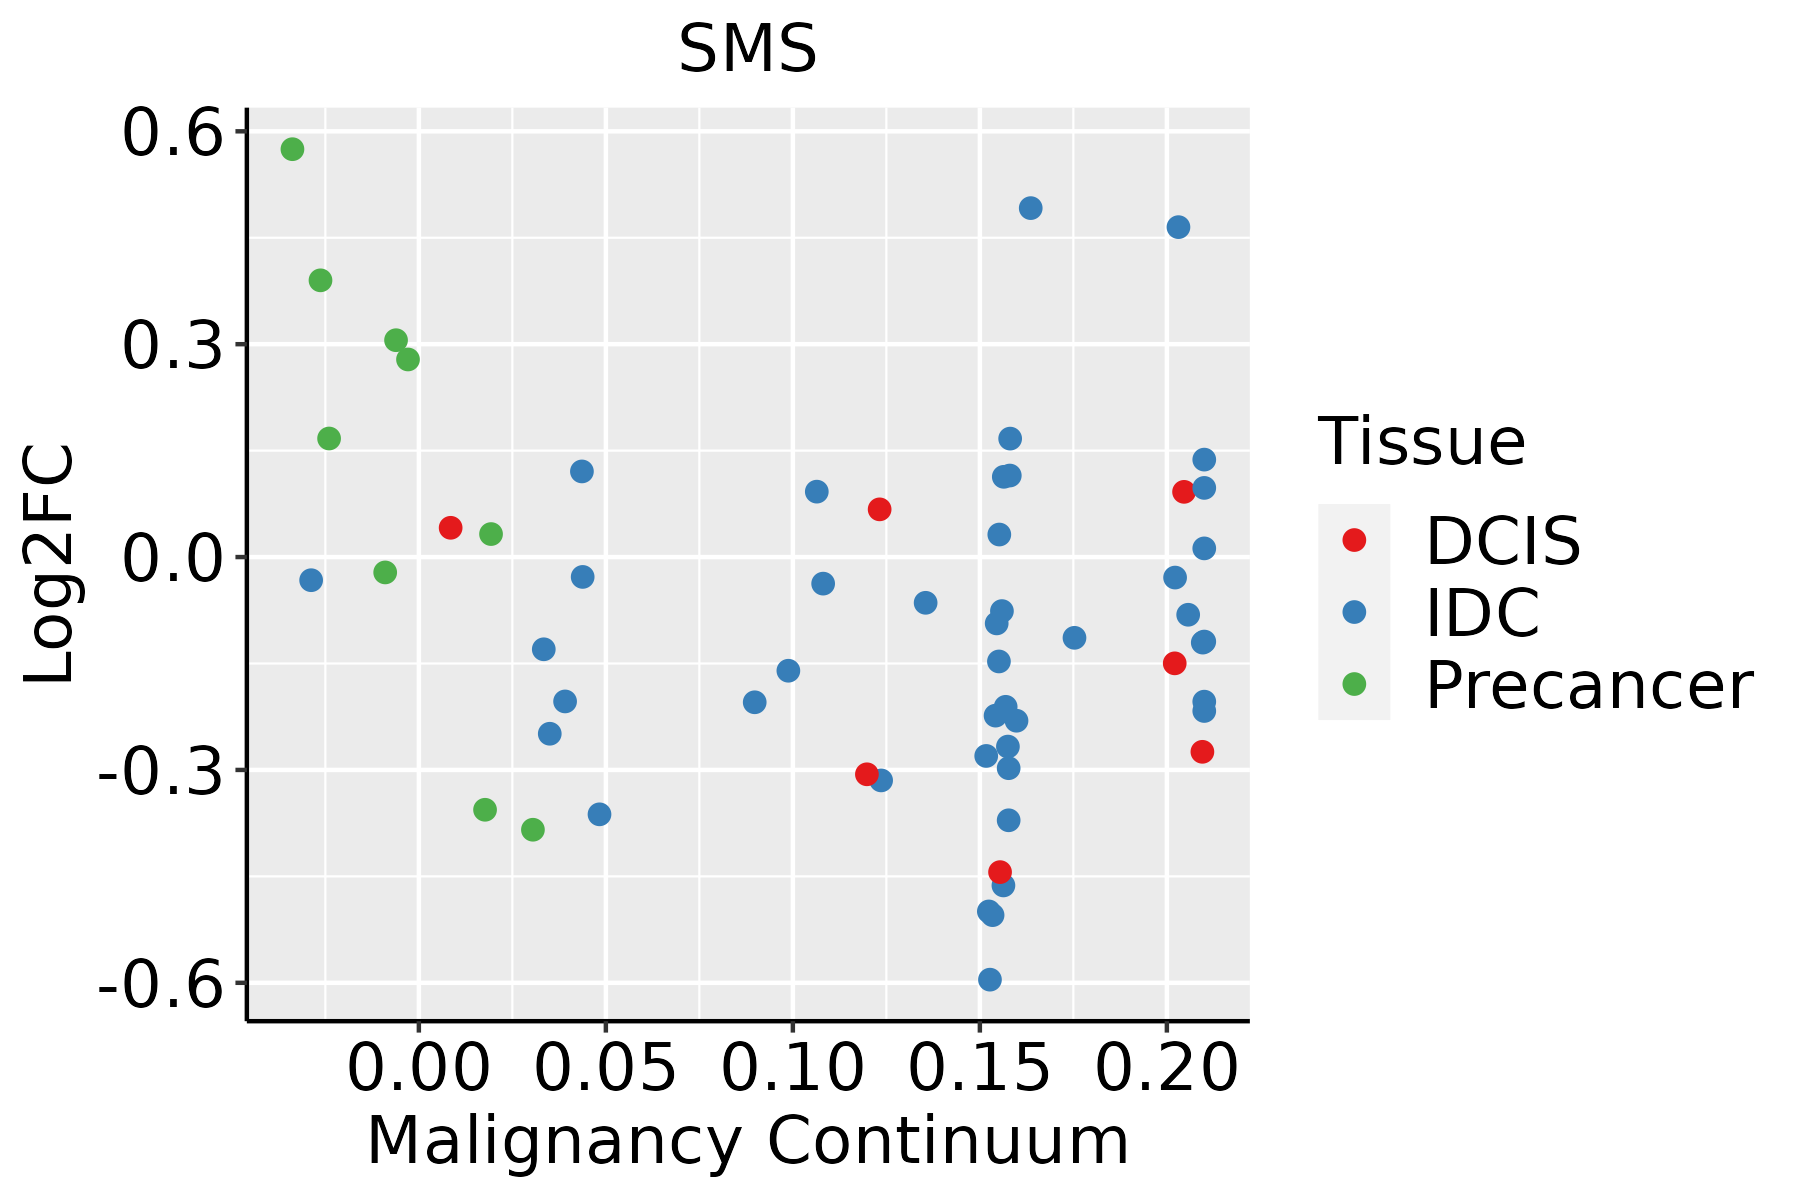 | IDC: Invasive ductal carcinoma |
| DCIS: Ductal carcinoma in situ | ||
| Precancer(BRCA1-mut): Precancerous lesion from BRCA1 mutation carriers | ||
| Colorectum (GSE201348) |  | FAP: Familial adenomatous polyposis |
| CRC: Colorectal cancer | ||
| Colorectum (HTA11) |  | AD: Adenomas |
| SER: Sessile serrated lesions | ||
| MSI-H: Microsatellite-high colorectal cancer | ||
| MSS: Microsatellite stable colorectal cancer | ||
| Endometrium | 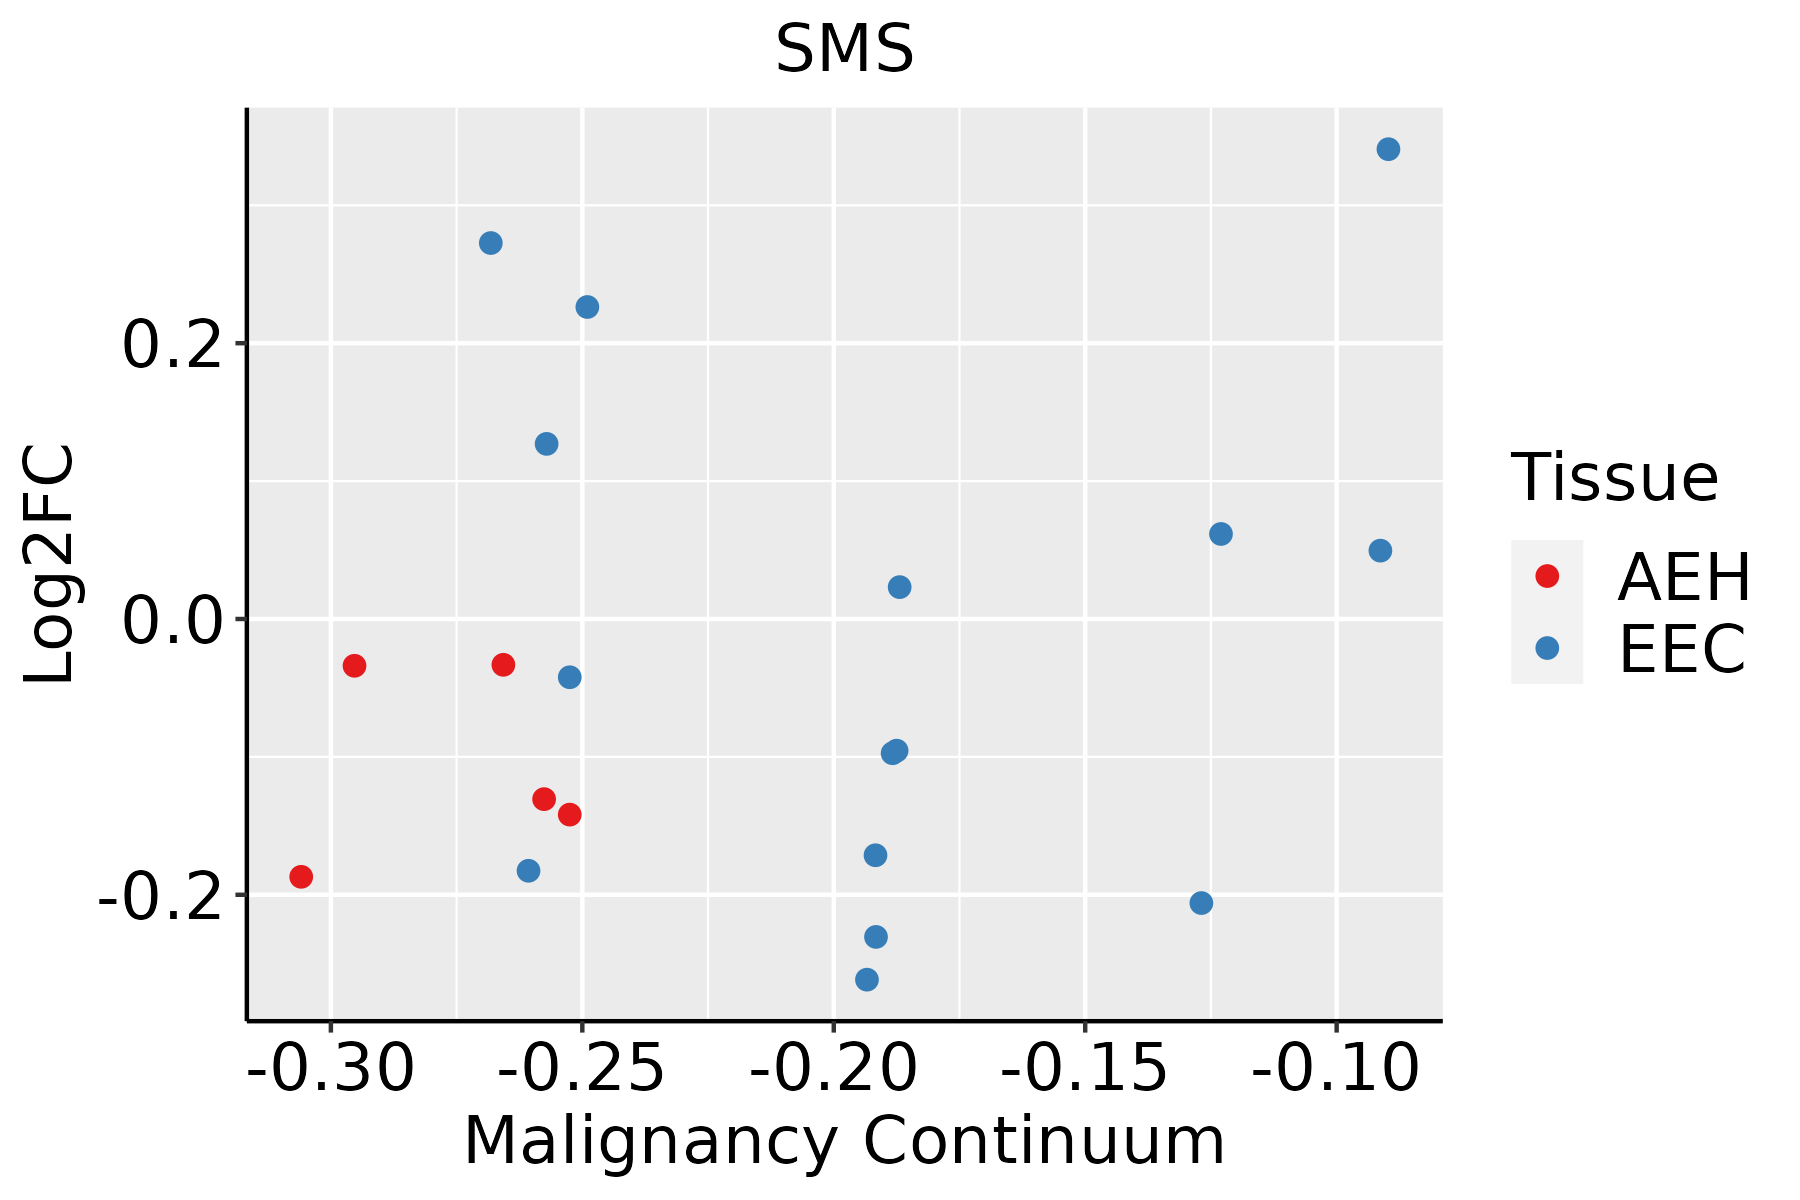 | AEH: Atypical endometrial hyperplasia |
| EEC: Endometrioid Cancer | ||
| Esophagus |  | ESCC: Esophageal squamous cell carcinoma |
| HGIN: High-grade intraepithelial neoplasias | ||
| LGIN: Low-grade intraepithelial neoplasias | ||
| GC | 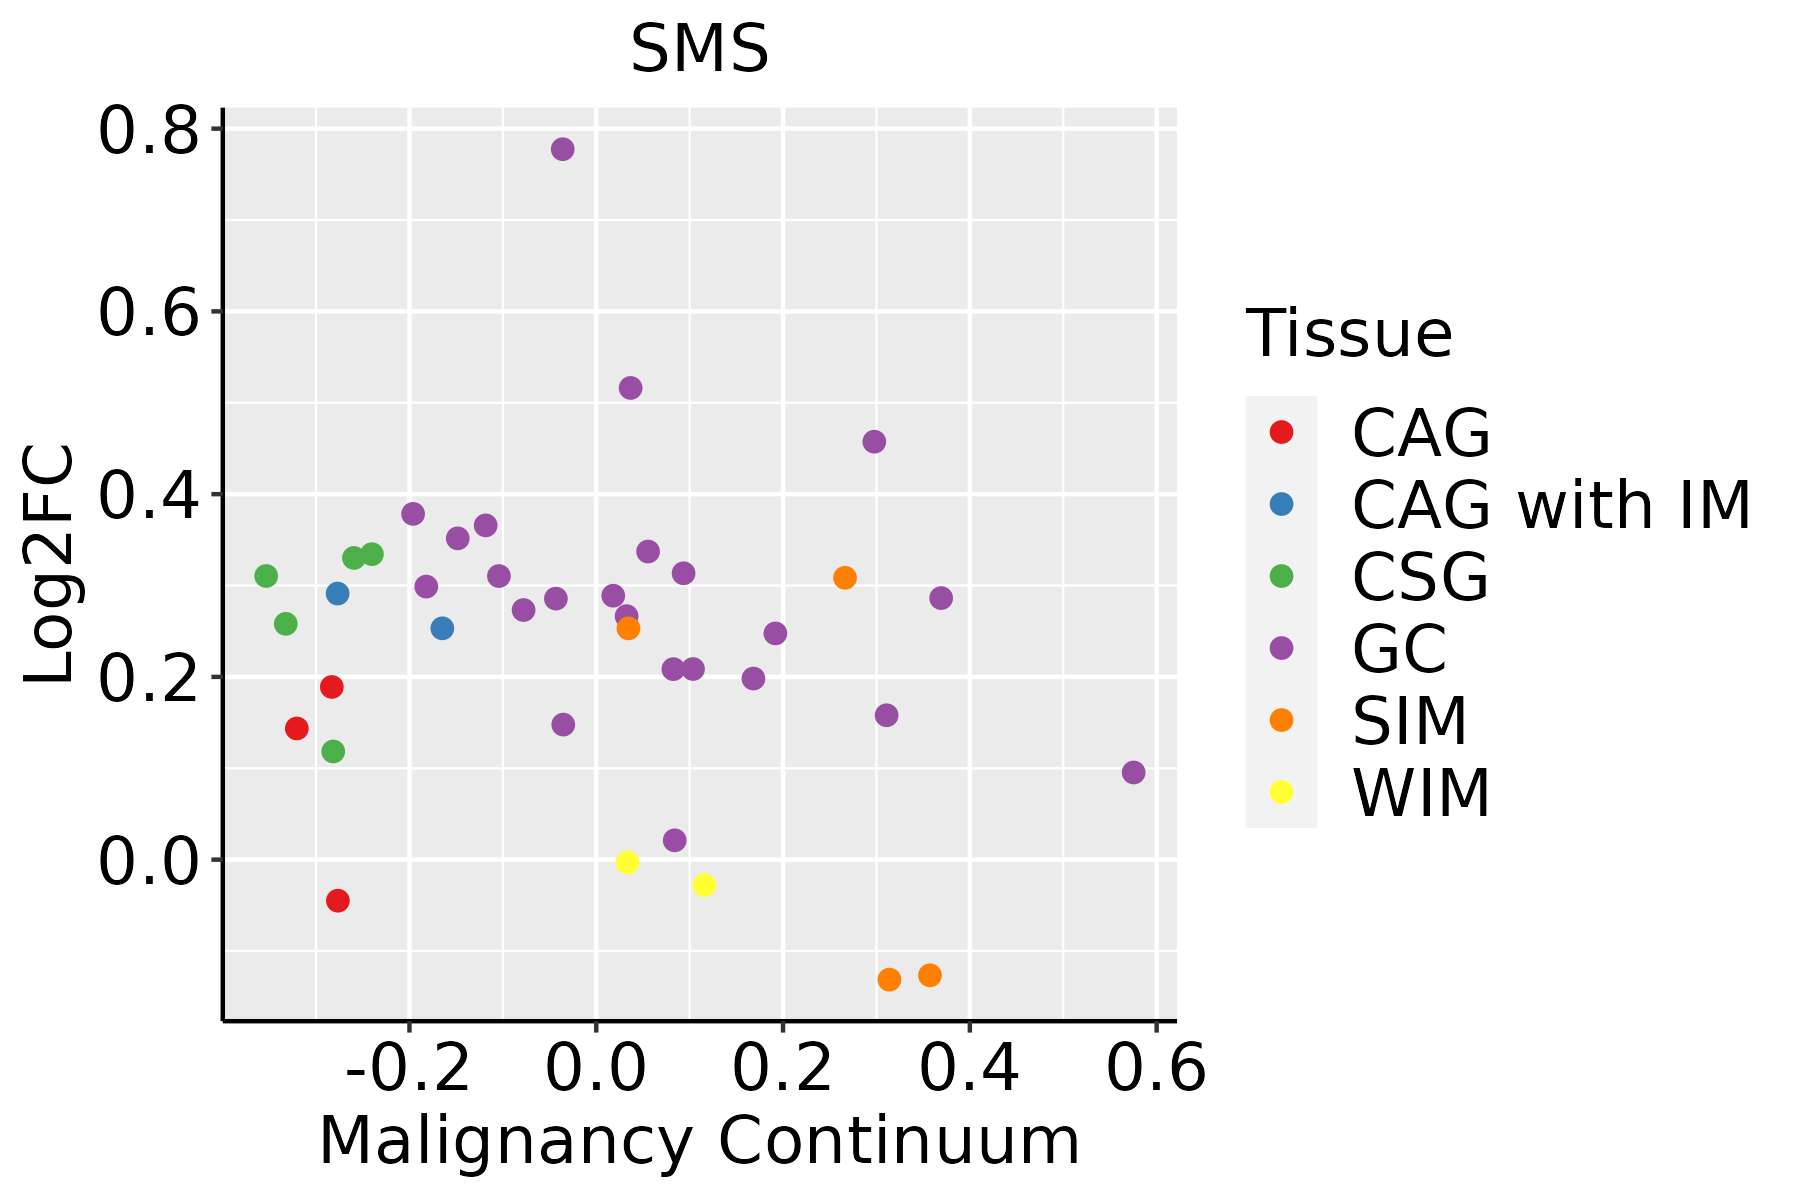 | CAG: Chronic atrophic gastritis |
| CAG with IM: Chronic atrophic gastritis with intestinal metaplasia | ||
| CSG: Chronic superficial gastritis | ||
| GC: Gastric cancer | ||
| SIM: Severe intestinal metaplasia | ||
| WIM: Wild intestinal metaplasia | ||
| Liver | 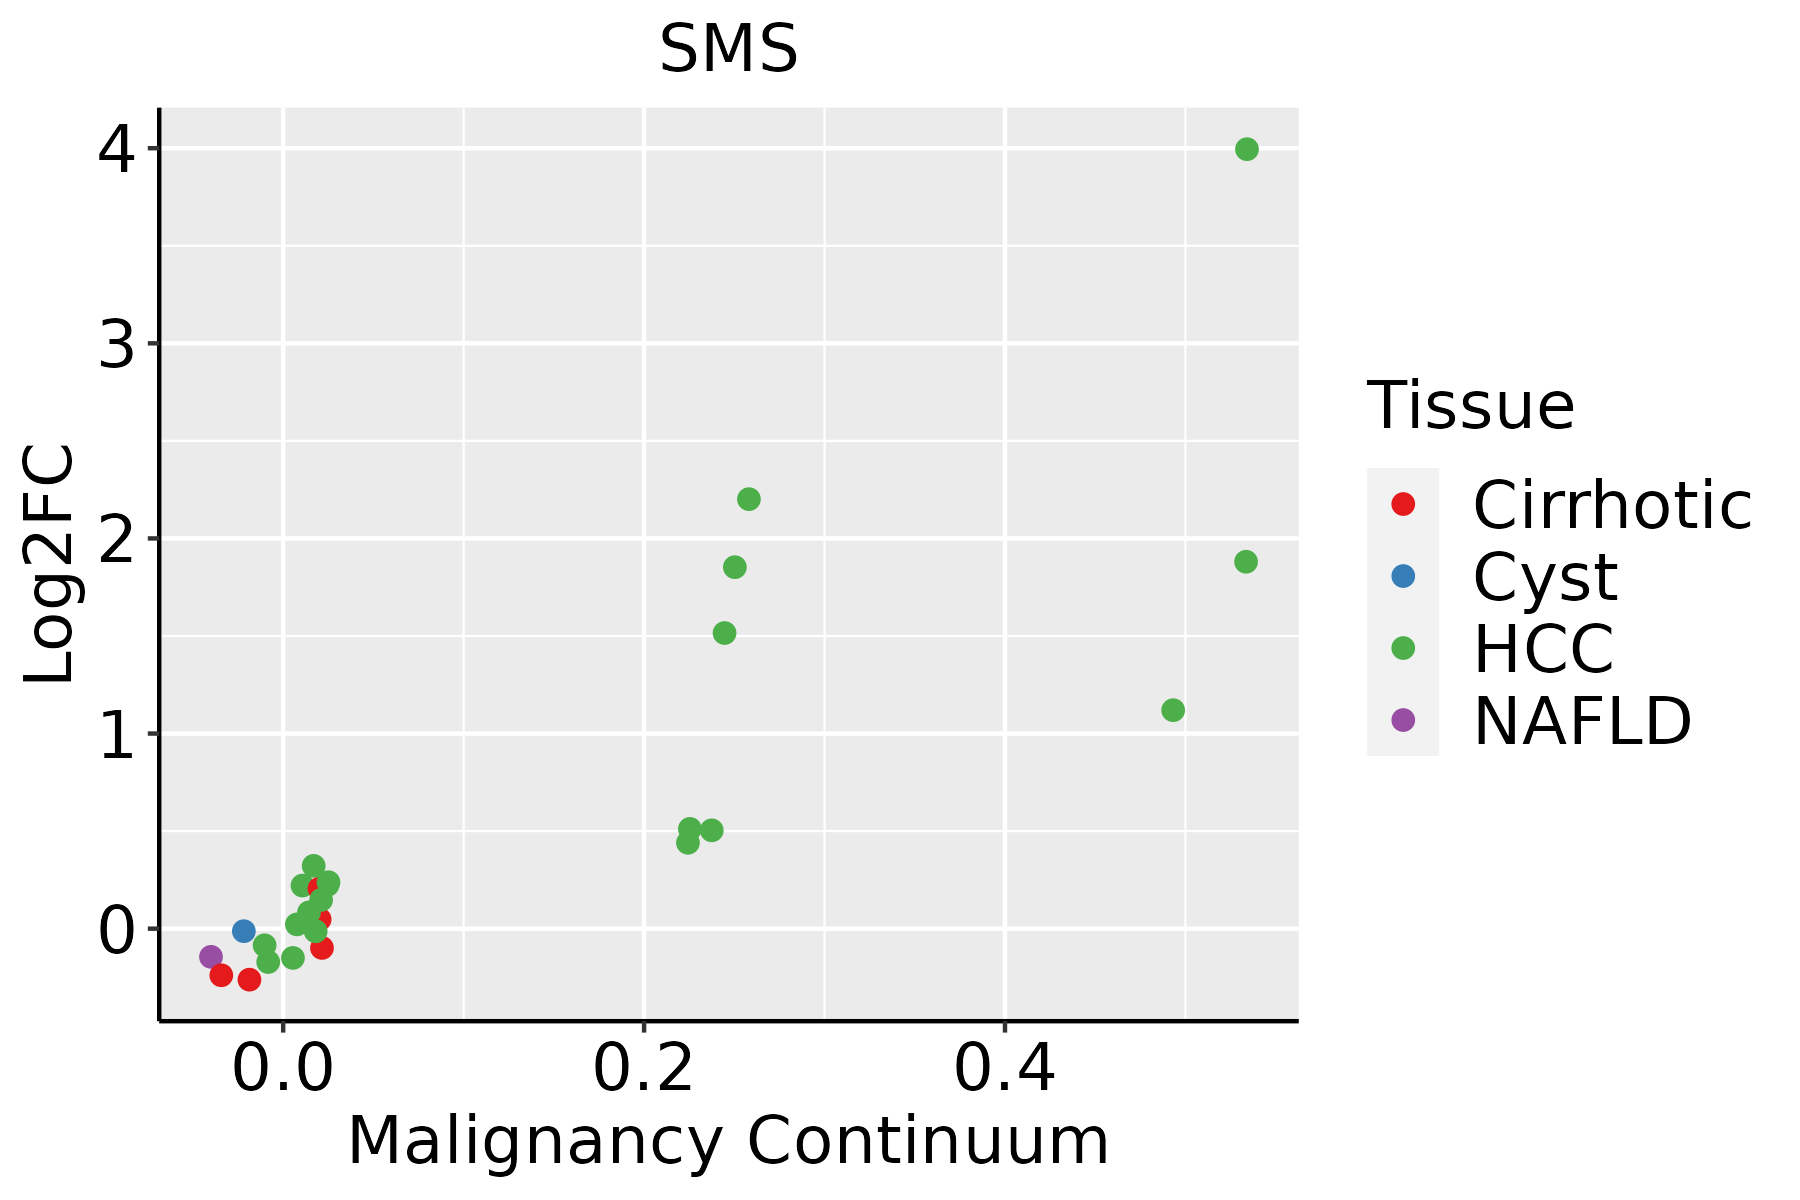 | HCC: Hepatocellular carcinoma |
| NAFLD: Non-alcoholic fatty liver disease | ||
| Oral Cavity | 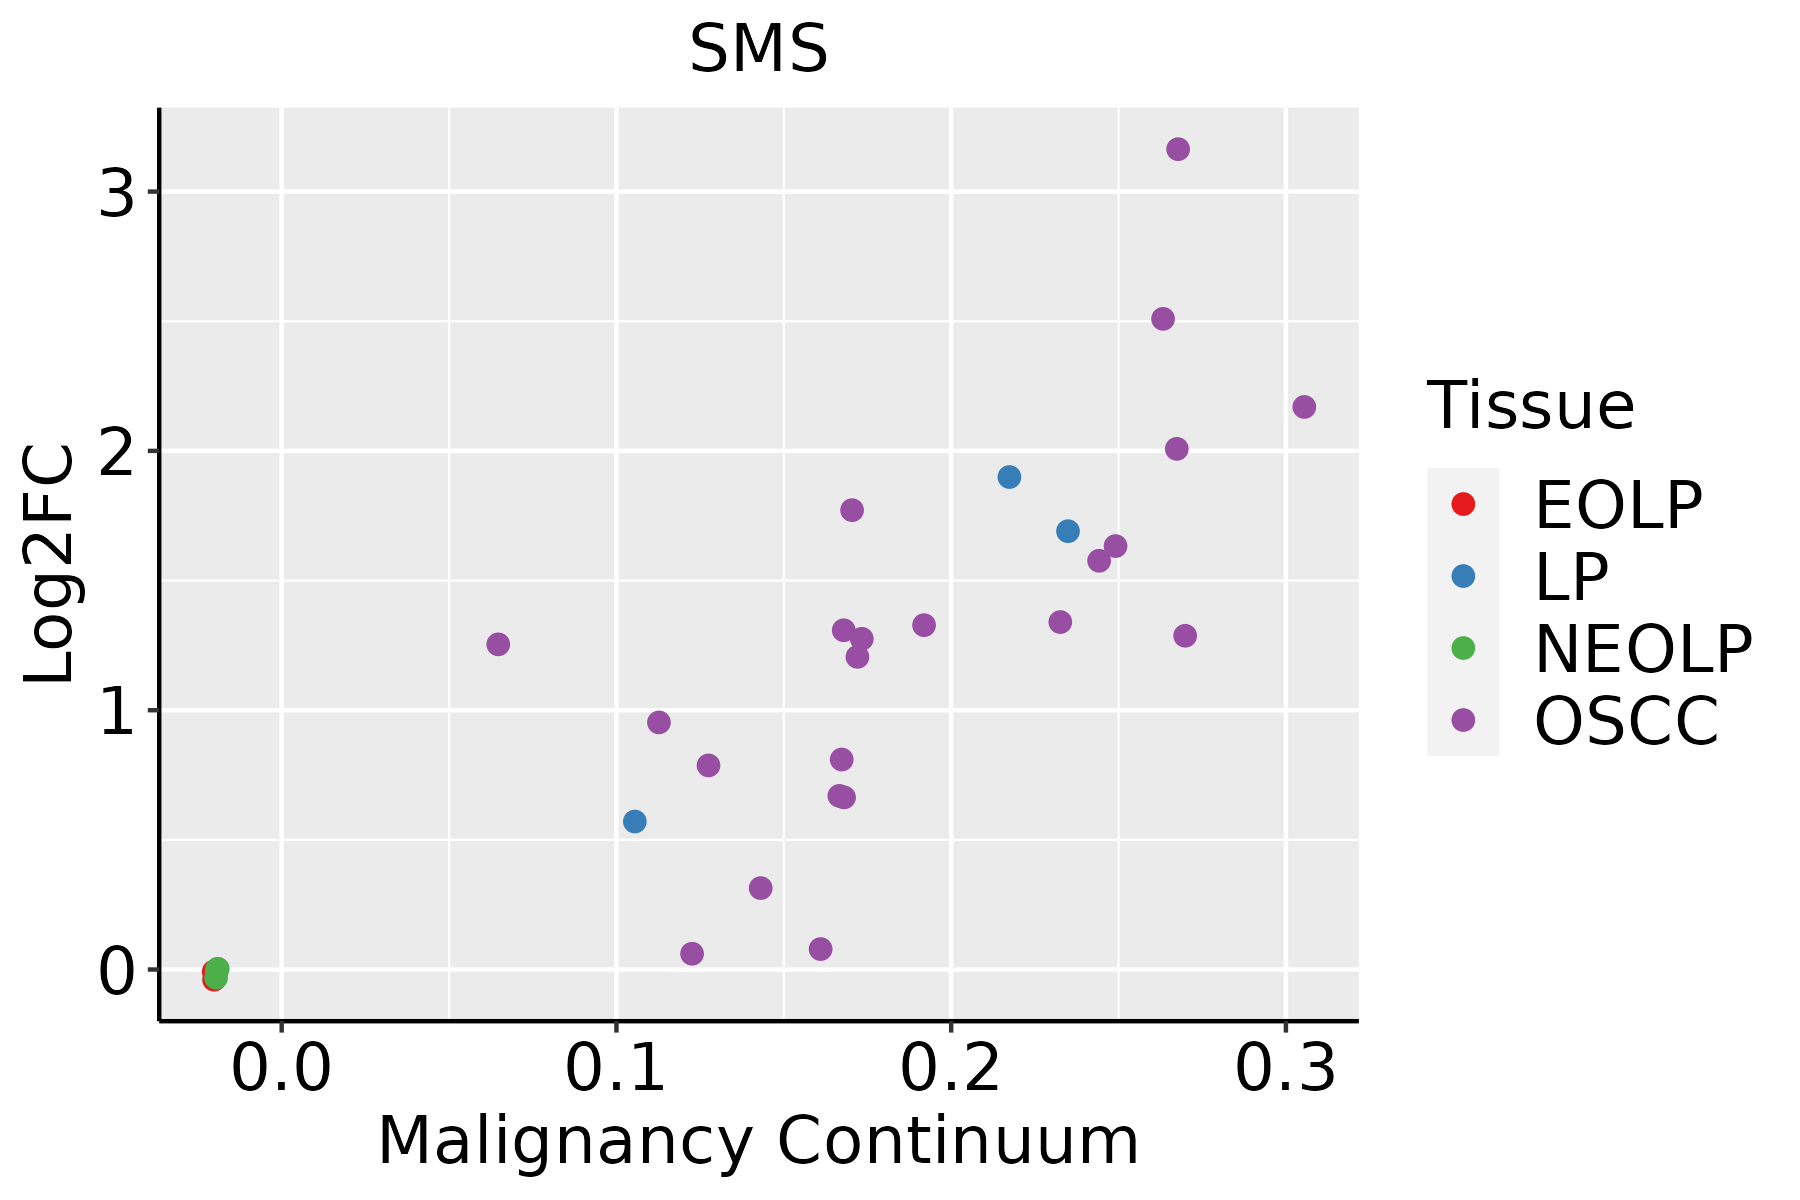 | EOLP: Erosive Oral lichen planus |
| LP: leukoplakia | ||
| NEOLP: Non-erosive oral lichen planus | ||
| OSCC: Oral squamous cell carcinoma | ||
| Prostate |  | BPH: Benign Prostatic Hyperplasia |
| Skin |  | AK: Actinic keratosis |
| cSCC: Cutaneous squamous cell carcinoma | ||
| SCCIS:squamous cell carcinoma in situ | ||
| Thyroid |  | ATC: Anaplastic thyroid cancer |
| HT: Hashimoto's thyroiditis | ||
| PTC: Papillary thyroid cancer |
| ∗log2FC in expression of this searched gene in stem-like cells from each diseased tissue sample relative to stem-like cells in normal samples in each tissue plotted against the malignancy continuum. Samples are colored based on if they are from different disease stage. |
Top |
Malignant transformation related pathway analysis |
| Find out the enriched GO biological processes and KEGG pathways involved in transition from healthy to precancer to cancer |
| Tissue | Disease Stage | Enriched GO biological Processes |
| Colorectum | AD |  |
| Colorectum | SER |  |
| Colorectum | MSS |  |
| Colorectum | MSI-H |  |
| Colorectum | FAP |  |
| ∗Top 15 enriched GO BP terms are showed in the bar plot of each disease state in each tissue. Each row represents a significant GO biological process which is colored according to the -log10(p.adjust). |
| Page: 1 2 3 4 5 6 7 8 9 |
| GO ID | Tissue | Disease Stage | Description | Gene Ratio | Bg Ratio | pvalue | p.adjust | Count |
| GO:0042401 | Breast | Precancer | cellular biogenic amine biosynthetic process | 7/1080 | 37/18723 | 4.68e-03 | 3.60e-02 | 7 |
| GO:0009309 | Breast | Precancer | amine biosynthetic process | 7/1080 | 38/18723 | 5.46e-03 | 4.01e-02 | 7 |
| GO:00065963 | Breast | Precancer | polyamine biosynthetic process | 4/1080 | 14/18723 | 6.92e-03 | 4.67e-02 | 4 |
| GO:00424011 | Breast | IDC | cellular biogenic amine biosynthetic process | 8/1434 | 37/18723 | 6.04e-03 | 4.33e-02 | 8 |
| GO:00093091 | Breast | IDC | amine biosynthetic process | 8/1434 | 38/18723 | 7.15e-03 | 4.92e-02 | 8 |
| GO:00424012 | Breast | DCIS | cellular biogenic amine biosynthetic process | 8/1390 | 37/18723 | 5.01e-03 | 3.72e-02 | 8 |
| GO:00093092 | Breast | DCIS | amine biosynthetic process | 8/1390 | 38/18723 | 5.94e-03 | 4.25e-02 | 8 |
| GO:0006790 | Colorectum | AD | sulfur compound metabolic process | 101/3918 | 339/18723 | 6.46e-05 | 1.07e-03 | 101 |
| GO:0006520 | Colorectum | AD | cellular amino acid metabolic process | 81/3918 | 284/18723 | 1.37e-03 | 1.19e-02 | 81 |
| GO:00067902 | Colorectum | MSS | sulfur compound metabolic process | 85/3467 | 339/18723 | 1.52e-03 | 1.39e-02 | 85 |
| GO:0006596 | Colorectum | MSS | polyamine biosynthetic process | 7/3467 | 14/18723 | 7.51e-03 | 4.72e-02 | 7 |
| GO:1901605 | Colorectum | MSI-H | alpha-amino acid metabolic process | 26/1319 | 195/18723 | 1.26e-03 | 2.02e-02 | 26 |
| GO:00065952 | Endometrium | EEC | polyamine metabolic process | 7/2168 | 18/18723 | 2.76e-03 | 1.97e-02 | 7 |
| GO:00067906 | Esophagus | ESCC | sulfur compound metabolic process | 201/8552 | 339/18723 | 2.64e-07 | 3.94e-06 | 201 |
| GO:000679011 | Liver | Cirrhotic | sulfur compound metabolic process | 129/4634 | 339/18723 | 3.06e-08 | 1.04e-06 | 129 |
| GO:19016051 | Liver | Cirrhotic | alpha-amino acid metabolic process | 82/4634 | 195/18723 | 7.72e-08 | 2.30e-06 | 82 |
| GO:000652011 | Liver | Cirrhotic | cellular amino acid metabolic process | 103/4634 | 284/18723 | 8.88e-06 | 1.30e-04 | 103 |
| GO:00000961 | Liver | Cirrhotic | sulfur amino acid metabolic process | 19/4634 | 34/18723 | 1.01e-04 | 1.05e-03 | 19 |
| GO:0006595 | Liver | Cirrhotic | polyamine metabolic process | 12/4634 | 18/18723 | 2.07e-04 | 1.90e-03 | 12 |
| GO:00065962 | Liver | Cirrhotic | polyamine biosynthetic process | 10/4634 | 14/18723 | 3.11e-04 | 2.72e-03 | 10 |
| Page: 1 2 3 |
| Pathway ID | Tissue | Disease Stage | Description | Gene Ratio | Bg Ratio | pvalue | p.adjust | qvalue | Count |
| hsa0048010 | Breast | Precancer | Glutathione metabolism | 12/684 | 57/8465 | 1.68e-03 | 1.08e-02 | 8.30e-03 | 12 |
| hsa0048013 | Breast | Precancer | Glutathione metabolism | 12/684 | 57/8465 | 1.68e-03 | 1.08e-02 | 8.30e-03 | 12 |
| hsa0048023 | Breast | IDC | Glutathione metabolism | 13/867 | 57/8465 | 4.25e-03 | 2.56e-02 | 1.91e-02 | 13 |
| hsa0048033 | Breast | IDC | Glutathione metabolism | 13/867 | 57/8465 | 4.25e-03 | 2.56e-02 | 1.91e-02 | 13 |
| hsa0048041 | Breast | DCIS | Glutathione metabolism | 13/846 | 57/8465 | 3.44e-03 | 1.98e-02 | 1.46e-02 | 13 |
| hsa0048051 | Breast | DCIS | Glutathione metabolism | 13/846 | 57/8465 | 3.44e-03 | 1.98e-02 | 1.46e-02 | 13 |
| hsa00330 | Colorectum | AD | Arginine and proline metabolism | 23/2092 | 50/8465 | 8.27e-04 | 5.90e-03 | 3.76e-03 | 23 |
| hsa00480 | Colorectum | AD | Glutathione metabolism | 23/2092 | 57/8465 | 6.52e-03 | 2.76e-02 | 1.76e-02 | 23 |
| hsa003301 | Colorectum | AD | Arginine and proline metabolism | 23/2092 | 50/8465 | 8.27e-04 | 5.90e-03 | 3.76e-03 | 23 |
| hsa004801 | Colorectum | AD | Glutathione metabolism | 23/2092 | 57/8465 | 6.52e-03 | 2.76e-02 | 1.76e-02 | 23 |
| hsa003304 | Colorectum | MSS | Arginine and proline metabolism | 23/1875 | 50/8465 | 1.52e-04 | 1.24e-03 | 7.61e-04 | 23 |
| hsa004802 | Colorectum | MSS | Glutathione metabolism | 22/1875 | 57/8465 | 3.58e-03 | 1.64e-02 | 1.01e-02 | 22 |
| hsa003305 | Colorectum | MSS | Arginine and proline metabolism | 23/1875 | 50/8465 | 1.52e-04 | 1.24e-03 | 7.61e-04 | 23 |
| hsa004803 | Colorectum | MSS | Glutathione metabolism | 22/1875 | 57/8465 | 3.58e-03 | 1.64e-02 | 1.01e-02 | 22 |
| hsa003306 | Colorectum | FAP | Arginine and proline metabolism | 16/1404 | 50/8465 | 5.33e-03 | 2.10e-02 | 1.27e-02 | 16 |
| hsa003307 | Colorectum | FAP | Arginine and proline metabolism | 16/1404 | 50/8465 | 5.33e-03 | 2.10e-02 | 1.27e-02 | 16 |
| hsa002704 | Endometrium | EEC | Cysteine and methionine metabolism | 15/1237 | 52/8465 | 6.02e-03 | 3.12e-02 | 2.33e-02 | 15 |
| hsa0027011 | Endometrium | EEC | Cysteine and methionine metabolism | 15/1237 | 52/8465 | 6.02e-03 | 3.12e-02 | 2.33e-02 | 15 |
| hsa0048018 | Esophagus | ESCC | Glutathione metabolism | 44/4205 | 57/8465 | 1.81e-05 | 9.03e-05 | 4.63e-05 | 44 |
| hsa0048019 | Esophagus | ESCC | Glutathione metabolism | 44/4205 | 57/8465 | 1.81e-05 | 9.03e-05 | 4.63e-05 | 44 |
| Page: 1 2 3 |
Top |
Cell-cell communication analysis |
| Identification of potential cell-cell interactions between two cell types and their ligand-receptor pairs for different disease states |
| Ligand | Receptor | LRpair | Pathway | Tissue | Disease Stage |
| Page: 1 |
Top |
Single-cell gene regulatory network inference analysis |
| Find out the significant the regulons (TFs) and the target genes of each regulon across cell types for different disease states |
| TF | Cell Type | Tissue | Disease Stage | Target Gene | RSS | Regulon Activity |
| ∗The dot plots of a searched regulon are shown for all cell subpopulations in each disease state of each tissue based on the regulon specific score inferred using pySCENIC and by calculating the average expression. |
| Page: 1 |
Top |
Somatic mutation of malignant transformation related genes |
| Annotation of somatic variants for genes involved in malignant transformation |
| Hugo Symbol | Variant Class | Variant Classification | dbSNP RS | HGVSc | HGVSp | HGVSp Short | SWISSPROT | BIOTYPE | SIFT | PolyPhen | Tumor Sample Barcode | Tissue | Histology | Sex | Age | Stage | Therapy Types | Drugs | Outcome |
| SMS | SNV | Missense_Mutation | novel | c.887N>A | p.Arg296Lys | p.R296K | P52788 | protein_coding | deleterious(0.04) | probably_damaging(0.979) | TCGA-D8-A146-01 | Breast | breast invasive carcinoma | Female | <65 | I/II | Unknown | Unknown | SD |
| SMS | SNV | Missense_Mutation | novel | c.253G>A | p.Glu85Lys | p.E85K | P52788 | protein_coding | tolerated(0.31) | benign(0.131) | TCGA-4J-AA1J-01 | Cervix | cervical & endocervical cancer | Female | <65 | I/II | Unknown | Unknown | SD |
| SMS | SNV | Missense_Mutation | c.58G>A | p.Glu20Lys | p.E20K | P52788 | protein_coding | tolerated(0.14) | benign(0) | TCGA-ZJ-AAXA-01 | Cervix | cervical & endocervical cancer | Female | <65 | I/II | Unknown | Unknown | SD | |
| SMS | SNV | Missense_Mutation | c.338C>A | p.Pro113His | p.P113H | P52788 | protein_coding | deleterious(0) | possibly_damaging(0.505) | TCGA-A6-5661-01 | Colorectum | colon adenocarcinoma | Female | >=65 | I/II | Unknown | Unknown | SD | |
| SMS | SNV | Missense_Mutation | novel | c.883N>A | p.Leu295Ile | p.L295I | P52788 | protein_coding | tolerated(0.45) | probably_damaging(0.991) | TCGA-AA-3984-01 | Colorectum | colon adenocarcinoma | Female | <65 | I/II | Unknown | Unknown | SD |
| SMS | SNV | Missense_Mutation | c.464N>T | p.Ser155Leu | p.S155L | P52788 | protein_coding | deleterious(0.01) | probably_damaging(0.997) | TCGA-AA-A00N-01 | Colorectum | colon adenocarcinoma | Male | >=65 | I/II | Unknown | Unknown | PD | |
| SMS | SNV | Missense_Mutation | novel | c.548N>A | p.Gly183Asp | p.G183D | P52788 | protein_coding | deleterious(0.04) | probably_damaging(1) | TCGA-AJ-A3EL-01 | Endometrium | uterine corpus endometrioid carcinoma | Female | <65 | I/II | Unknown | Unknown | SD |
| SMS | SNV | Missense_Mutation | novel | c.754N>A | p.Leu252Ile | p.L252I | P52788 | protein_coding | tolerated(0.61) | benign(0.363) | TCGA-AJ-A5DW-01 | Endometrium | uterine corpus endometrioid carcinoma | Female | <65 | I/II | Unknown | Unknown | SD |
| SMS | SNV | Missense_Mutation | c.934N>A | p.Tyr312Asn | p.Y312N | P52788 | protein_coding | deleterious(0) | probably_damaging(1) | TCGA-AP-A054-01 | Endometrium | uterine corpus endometrioid carcinoma | Female | <65 | III/IV | Chemotherapy | carboplatin | PD | |
| SMS | SNV | Missense_Mutation | c.267N>G | p.Ile89Met | p.I89M | P52788 | protein_coding | deleterious(0.04) | benign(0.08) | TCGA-AX-A0J0-01 | Endometrium | uterine corpus endometrioid carcinoma | Female | <65 | I/II | Unknown | Unknown | SD |
| Page: 1 2 3 4 |
Top |
Related drugs of malignant transformation related genes |
| Identification of chemicals and drugs interact with genes involved in malignant transfromation |
| (DGIdb 4.0) |
| Entrez ID | Symbol | Category | Interaction Types | Drug Claim Name | Drug Name | PMIDs |
| 6611 | SMS | DRUGGABLE GENOME | 2-hydroxyoleic acid |
| Page: 1 |

Copyright 2023-Present -The University of Texas Health Science Center at Houston |