
|
|||||
|
 | |
| |
| |
| |
| |
| |
|
Gene: SMPDL3B |
Gene summary for SMPDL3B |
| Gene information | Species | Human | Gene symbol | SMPDL3B | Gene ID | 27293 |
| Gene name | sphingomyelin phosphodiesterase acid like 3B | |
| Gene Alias | ASML3B | |
| Cytomap | 1p35.3 | |
| Gene Type | protein-coding | GO ID | GO:0002221 | UniProtAcc | Q92485 |
Top |
Malignant transformation analysis |
| Identification of the aberrant gene expression in precancerous and cancerous lesions by comparing the gene expression of stem-like cells in diseased tissues with normal stem cells |
| Entrez ID | Symbol | Replicates | Species | Organ | Tissue | Adj P-value | Log2FC | Malignancy |
| 27293 | SMPDL3B | P4T-E | Human | Esophagus | ESCC | 2.86e-06 | 1.74e-01 | 0.1323 |
| 27293 | SMPDL3B | P8T-E | Human | Esophagus | ESCC | 6.84e-04 | 5.62e-02 | 0.0889 |
| 27293 | SMPDL3B | P23T-E | Human | Esophagus | ESCC | 1.56e-04 | 8.18e-02 | 0.108 |
| 27293 | SMPDL3B | P48T-E | Human | Esophagus | ESCC | 1.23e-03 | 3.56e-02 | 0.0959 |
| 27293 | SMPDL3B | P57T-E | Human | Esophagus | ESCC | 3.82e-02 | 1.01e-01 | 0.0926 |
| 27293 | SMPDL3B | P65T-E | Human | Esophagus | ESCC | 2.16e-04 | 5.57e-02 | 0.0978 |
| 27293 | SMPDL3B | P74T-E | Human | Esophagus | ESCC | 5.99e-26 | 5.78e-01 | 0.1479 |
| 27293 | SMPDL3B | P75T-E | Human | Esophagus | ESCC | 4.28e-07 | 2.60e-01 | 0.1125 |
| 27293 | SMPDL3B | P76T-E | Human | Esophagus | ESCC | 9.74e-19 | 4.19e-01 | 0.1207 |
| 27293 | SMPDL3B | P79T-E | Human | Esophagus | ESCC | 2.12e-08 | 2.00e-01 | 0.1154 |
| 27293 | SMPDL3B | P82T-E | Human | Esophagus | ESCC | 1.23e-06 | 5.33e-01 | 0.1072 |
| 27293 | SMPDL3B | P94T-E | Human | Esophagus | ESCC | 4.72e-04 | 4.18e-01 | 0.0879 |
| 27293 | SMPDL3B | P104T-E | Human | Esophagus | ESCC | 2.66e-04 | 4.40e-01 | 0.0931 |
| 27293 | SMPDL3B | P128T-E | Human | Esophagus | ESCC | 4.18e-20 | 4.85e-01 | 0.1241 |
| 27293 | SMPDL3B | P130T-E | Human | Esophagus | ESCC | 1.38e-46 | 8.98e-01 | 0.1676 |
| Page: 1 |
| Tissue | Expression Dynamics | Abbreviation |
| Esophagus | 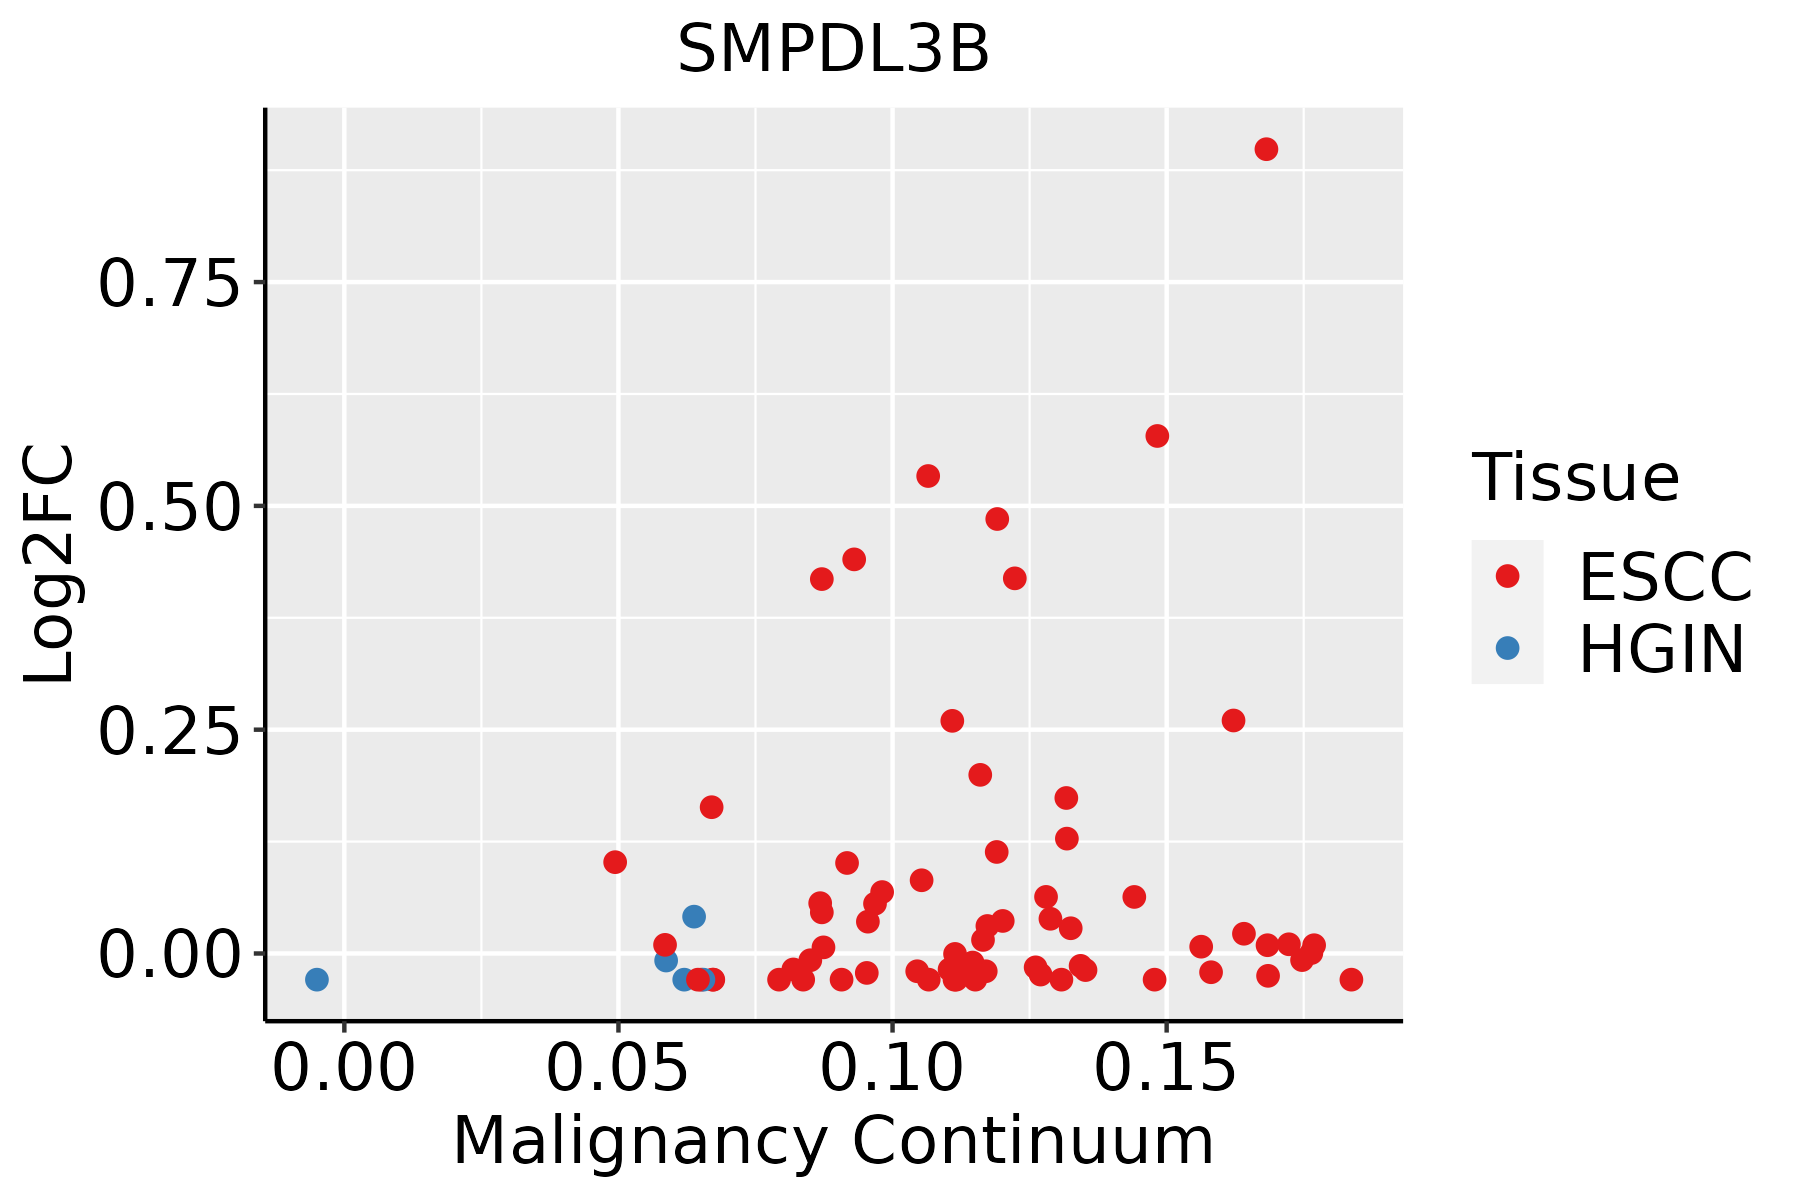 | ESCC: Esophageal squamous cell carcinoma |
| HGIN: High-grade intraepithelial neoplasias | ||
| LGIN: Low-grade intraepithelial neoplasias |
| ∗log2FC in expression of this searched gene in stem-like cells from each diseased tissue sample relative to stem-like cells in normal samples in each tissue plotted against the malignancy continuum. Samples are colored based on if they are from different disease stage. |
Top |
Malignant transformation related pathway analysis |
| Find out the enriched GO biological processes and KEGG pathways involved in transition from healthy to precancer to cancer |
| Tissue | Disease Stage | Enriched GO biological Processes |
| Colorectum | AD |  |
| Colorectum | SER |  |
| Colorectum | MSS |  |
| Colorectum | MSI-H |  |
| Colorectum | FAP |  |
| ∗Top 15 enriched GO BP terms are showed in the bar plot of each disease state in each tissue. Each row represents a significant GO biological process which is colored according to the -log10(p.adjust). |
| Page: 1 2 3 4 5 6 7 8 9 |
| GO ID | Tissue | Disease Stage | Description | Gene Ratio | Bg Ratio | pvalue | p.adjust | Count |
| GO:00066433 | Esophagus | ESCC | membrane lipid metabolic process | 130/8552 | 203/18723 | 9.29e-08 | 1.54e-06 | 130 |
| GO:00066446 | Esophagus | ESCC | phospholipid metabolic process | 218/8552 | 383/18723 | 5.37e-06 | 5.59e-05 | 218 |
| GO:00066652 | Esophagus | ESCC | sphingolipid metabolic process | 96/8552 | 155/18723 | 3.21e-05 | 2.66e-04 | 96 |
| GO:00442427 | Esophagus | ESCC | cellular lipid catabolic process | 121/8552 | 214/18723 | 8.63e-04 | 4.43e-03 | 121 |
| GO:00160427 | Esophagus | ESCC | lipid catabolic process | 168/8552 | 320/18723 | 7.97e-03 | 2.84e-02 | 168 |
| Page: 1 |
| Pathway ID | Tissue | Disease Stage | Description | Gene Ratio | Bg Ratio | pvalue | p.adjust | qvalue | Count |
| Page: 1 |
Top |
Cell-cell communication analysis |
| Identification of potential cell-cell interactions between two cell types and their ligand-receptor pairs for different disease states |
| Ligand | Receptor | LRpair | Pathway | Tissue | Disease Stage |
| Page: 1 |
Top |
Single-cell gene regulatory network inference analysis |
| Find out the significant the regulons (TFs) and the target genes of each regulon across cell types for different disease states |
| TF | Cell Type | Tissue | Disease Stage | Target Gene | RSS | Regulon Activity |
| ∗The dot plots of a searched regulon are shown for all cell subpopulations in each disease state of each tissue based on the regulon specific score inferred using pySCENIC and by calculating the average expression. |
| Page: 1 |
Top |
Somatic mutation of malignant transformation related genes |
| Annotation of somatic variants for genes involved in malignant transformation |
| Hugo Symbol | Variant Class | Variant Classification | dbSNP RS | HGVSc | HGVSp | HGVSp Short | SWISSPROT | BIOTYPE | SIFT | PolyPhen | Tumor Sample Barcode | Tissue | Histology | Sex | Age | Stage | Therapy Types | Drugs | Outcome |
| SMPDL3B | SNV | Missense_Mutation | novel | c.1295C>T | p.Ser432Phe | p.S432F | Q92485 | protein_coding | tolerated(0.06) | benign(0.055) | TCGA-C5-A902-01 | Cervix | cervical & endocervical cancer | Female | <65 | I/II | Chemotherapy | cisplatin | SD |
| SMPDL3B | SNV | Missense_Mutation | c.765N>G | p.Phe255Leu | p.F255L | Q92485 | protein_coding | deleterious(0.02) | probably_damaging(0.984) | TCGA-LP-A5U2-01 | Cervix | cervical & endocervical cancer | Female | <65 | III/IV | Unknown | Unknown | SD | |
| SMPDL3B | SNV | Missense_Mutation | c.149C>T | p.Ser50Phe | p.S50F | Q92485 | protein_coding | deleterious(0.04) | benign(0.039) | TCGA-VS-A958-01 | Cervix | cervical & endocervical cancer | Female | <65 | I/II | Chemotherapy | cisplatin | CR | |
| SMPDL3B | SNV | Missense_Mutation | c.1060C>T | p.Arg354Cys | p.R354C | Q92485 | protein_coding | tolerated(0.07) | possibly_damaging(0.634) | TCGA-AA-3864-01 | Colorectum | colon adenocarcinoma | Male | >=65 | I/II | Unknown | Unknown | SD | |
| SMPDL3B | SNV | Missense_Mutation | rs145333269 | c.298N>A | p.Asp100Asn | p.D100N | Q92485 | protein_coding | tolerated(1) | benign(0.015) | TCGA-AA-3975-01 | Colorectum | colon adenocarcinoma | Male | >=65 | I/II | Unknown | Unknown | SD |
| SMPDL3B | SNV | Missense_Mutation | c.230C>A | p.Ala77Asp | p.A77D | Q92485 | protein_coding | tolerated(0.1) | probably_damaging(1) | TCGA-CK-4951-01 | Colorectum | colon adenocarcinoma | Female | >=65 | I/II | Unknown | Unknown | PD | |
| SMPDL3B | SNV | Missense_Mutation | c.280G>A | p.Asp94Asn | p.D94N | Q92485 | protein_coding | deleterious(0.02) | benign(0.253) | TCGA-CK-4951-01 | Colorectum | colon adenocarcinoma | Female | >=65 | I/II | Unknown | Unknown | PD | |
| SMPDL3B | SNV | Missense_Mutation | rs759717841 | c.1103C>T | p.Pro368Leu | p.P368L | Q92485 | protein_coding | deleterious(0.02) | possibly_damaging(0.561) | TCGA-CK-4951-01 | Colorectum | colon adenocarcinoma | Female | >=65 | I/II | Unknown | Unknown | PD |
| SMPDL3B | SNV | Missense_Mutation | rs753870251 | c.886N>A | p.Ala296Thr | p.A296T | Q92485 | protein_coding | tolerated(0.77) | benign(0.009) | TCGA-CK-5916-01 | Colorectum | colon adenocarcinoma | Female | >=65 | I/II | Unknown | Unknown | PD |
| SMPDL3B | deletion | Frame_Shift_Del | c.516delA | p.Gly173ValfsTer31 | p.G173Vfs*31 | Q92485 | protein_coding | TCGA-AA-A022-01 | Colorectum | colon adenocarcinoma | Female | >=65 | I/II | Unknown | Unknown | SD |
| Page: 1 2 3 4 |
Top |
Related drugs of malignant transformation related genes |
| Identification of chemicals and drugs interact with genes involved in malignant transfromation |
| (DGIdb 4.0) |
| Entrez ID | Symbol | Category | Interaction Types | Drug Claim Name | Drug Name | PMIDs |
| Page: 1 |

Copyright 2023-Present -The University of Texas Health Science Center at Houston |