
|
|||||
|
 | |
| |
| |
| |
| |
| |
|
Gene: SMPD4 |
Gene summary for SMPD4 |
| Gene information | Species | Human | Gene symbol | SMPD4 | Gene ID | 55627 |
| Gene name | sphingomyelin phosphodiesterase 4 | |
| Gene Alias | NEDMABA | |
| Cytomap | 2q21.1 | |
| Gene Type | protein-coding | GO ID | GO:0006629 | UniProtAcc | Q9NXE4 |
Top |
Malignant transformation analysis |
| Identification of the aberrant gene expression in precancerous and cancerous lesions by comparing the gene expression of stem-like cells in diseased tissues with normal stem cells |
| Entrez ID | Symbol | Replicates | Species | Organ | Tissue | Adj P-value | Log2FC | Malignancy |
| 55627 | SMPD4 | LZE7T | Human | Esophagus | ESCC | 3.20e-13 | 6.14e-01 | 0.0667 |
| 55627 | SMPD4 | LZE8T | Human | Esophagus | ESCC | 1.64e-06 | 1.82e-01 | 0.067 |
| 55627 | SMPD4 | LZE20T | Human | Esophagus | ESCC | 4.47e-08 | 2.00e-01 | 0.0662 |
| 55627 | SMPD4 | LZE22T | Human | Esophagus | ESCC | 1.70e-04 | 3.96e-01 | 0.068 |
| 55627 | SMPD4 | LZE24T | Human | Esophagus | ESCC | 8.91e-09 | 2.14e-01 | 0.0596 |
| 55627 | SMPD4 | LZE21T | Human | Esophagus | ESCC | 3.82e-03 | 4.10e-01 | 0.0655 |
| 55627 | SMPD4 | LZE6T | Human | Esophagus | ESCC | 6.39e-05 | 1.69e-01 | 0.0845 |
| 55627 | SMPD4 | P1T-E | Human | Esophagus | ESCC | 1.28e-12 | 5.07e-01 | 0.0875 |
| 55627 | SMPD4 | P2T-E | Human | Esophagus | ESCC | 1.39e-18 | 4.04e-01 | 0.1177 |
| 55627 | SMPD4 | P4T-E | Human | Esophagus | ESCC | 1.88e-21 | 4.19e-01 | 0.1323 |
| 55627 | SMPD4 | P5T-E | Human | Esophagus | ESCC | 7.22e-15 | 2.92e-01 | 0.1327 |
| 55627 | SMPD4 | P8T-E | Human | Esophagus | ESCC | 2.02e-22 | 3.91e-01 | 0.0889 |
| 55627 | SMPD4 | P9T-E | Human | Esophagus | ESCC | 2.39e-07 | 2.28e-01 | 0.1131 |
| 55627 | SMPD4 | P10T-E | Human | Esophagus | ESCC | 1.48e-29 | 5.23e-01 | 0.116 |
| 55627 | SMPD4 | P11T-E | Human | Esophagus | ESCC | 5.86e-15 | 5.89e-01 | 0.1426 |
| 55627 | SMPD4 | P12T-E | Human | Esophagus | ESCC | 2.40e-23 | 5.36e-01 | 0.1122 |
| 55627 | SMPD4 | P15T-E | Human | Esophagus | ESCC | 4.04e-30 | 6.27e-01 | 0.1149 |
| 55627 | SMPD4 | P16T-E | Human | Esophagus | ESCC | 4.17e-26 | 4.43e-01 | 0.1153 |
| 55627 | SMPD4 | P17T-E | Human | Esophagus | ESCC | 1.31e-09 | 3.68e-01 | 0.1278 |
| 55627 | SMPD4 | P19T-E | Human | Esophagus | ESCC | 1.31e-06 | 4.16e-01 | 0.1662 |
| Page: 1 2 3 4 5 6 |
| Tissue | Expression Dynamics | Abbreviation |
| Esophagus | 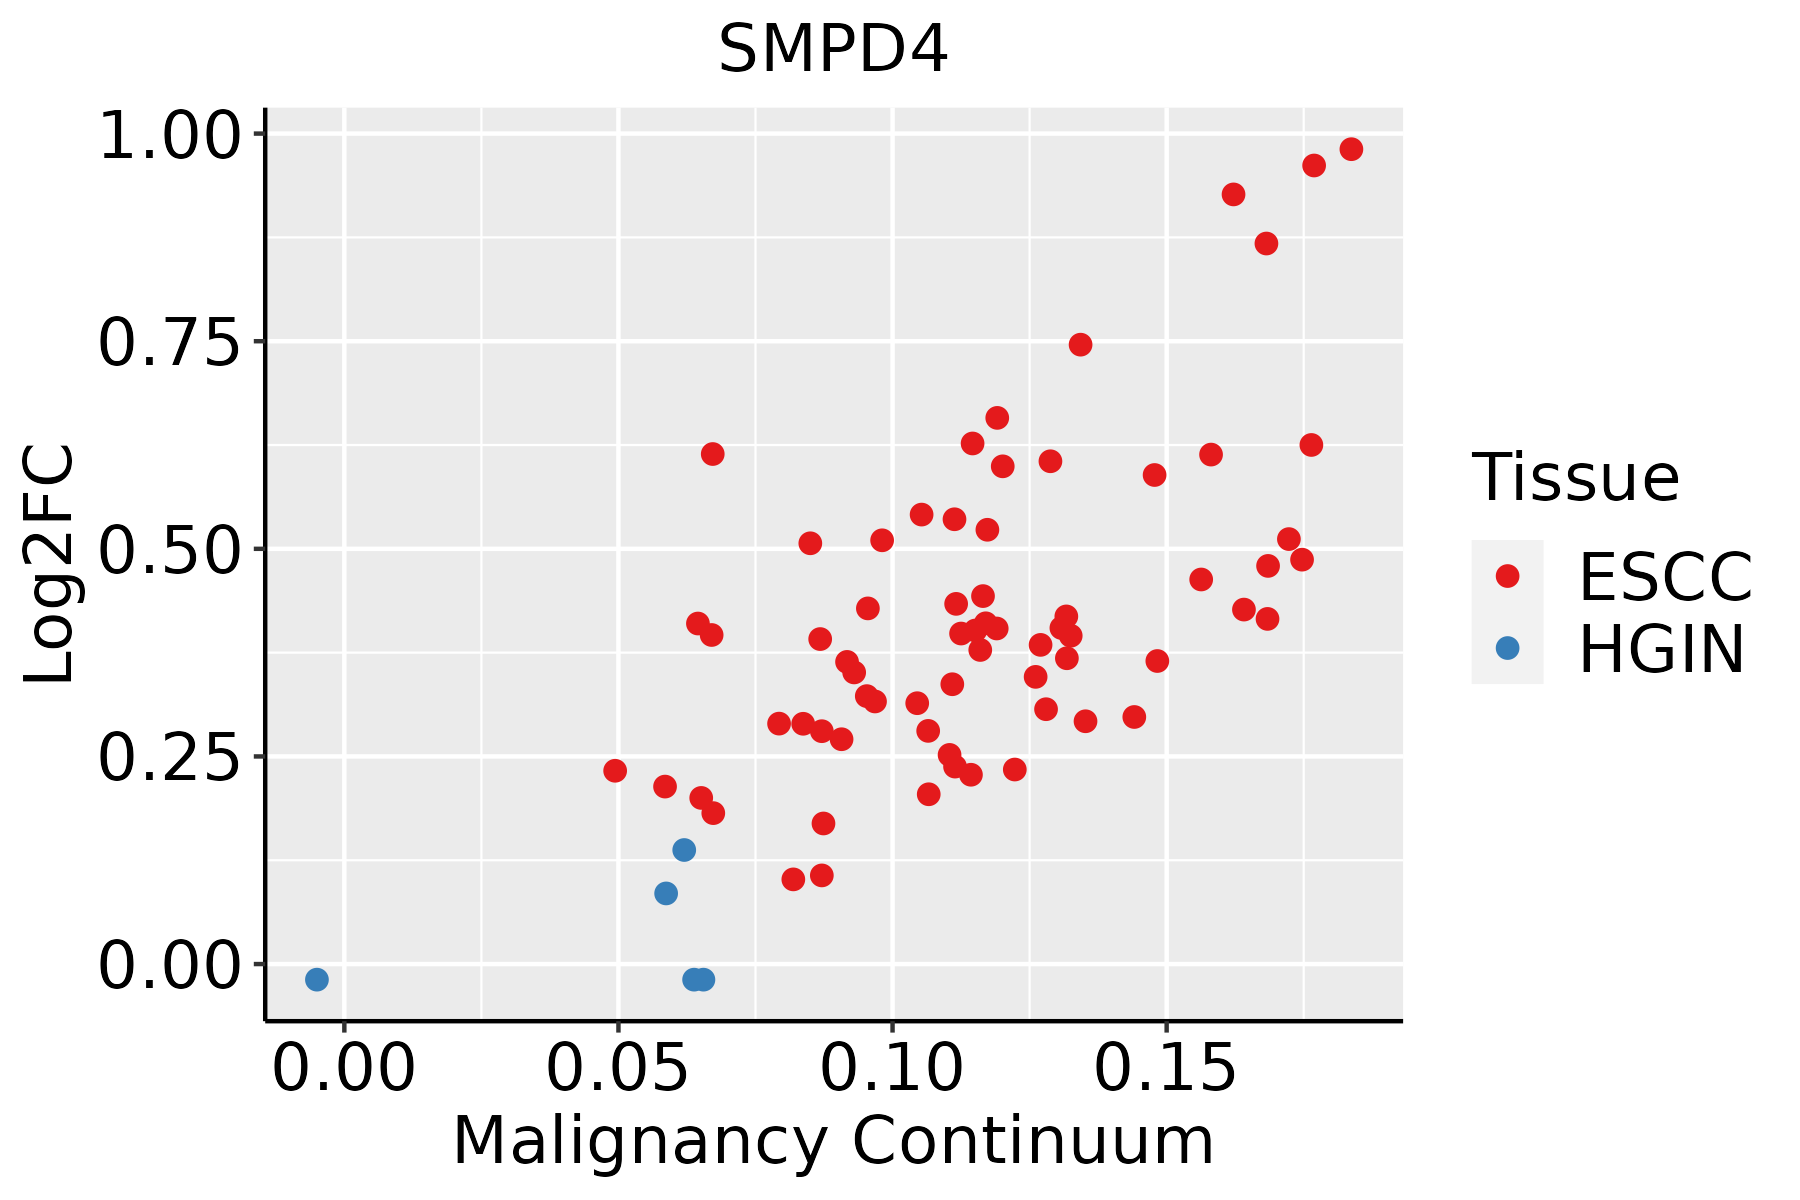 | ESCC: Esophageal squamous cell carcinoma |
| HGIN: High-grade intraepithelial neoplasias | ||
| LGIN: Low-grade intraepithelial neoplasias | ||
| Liver | 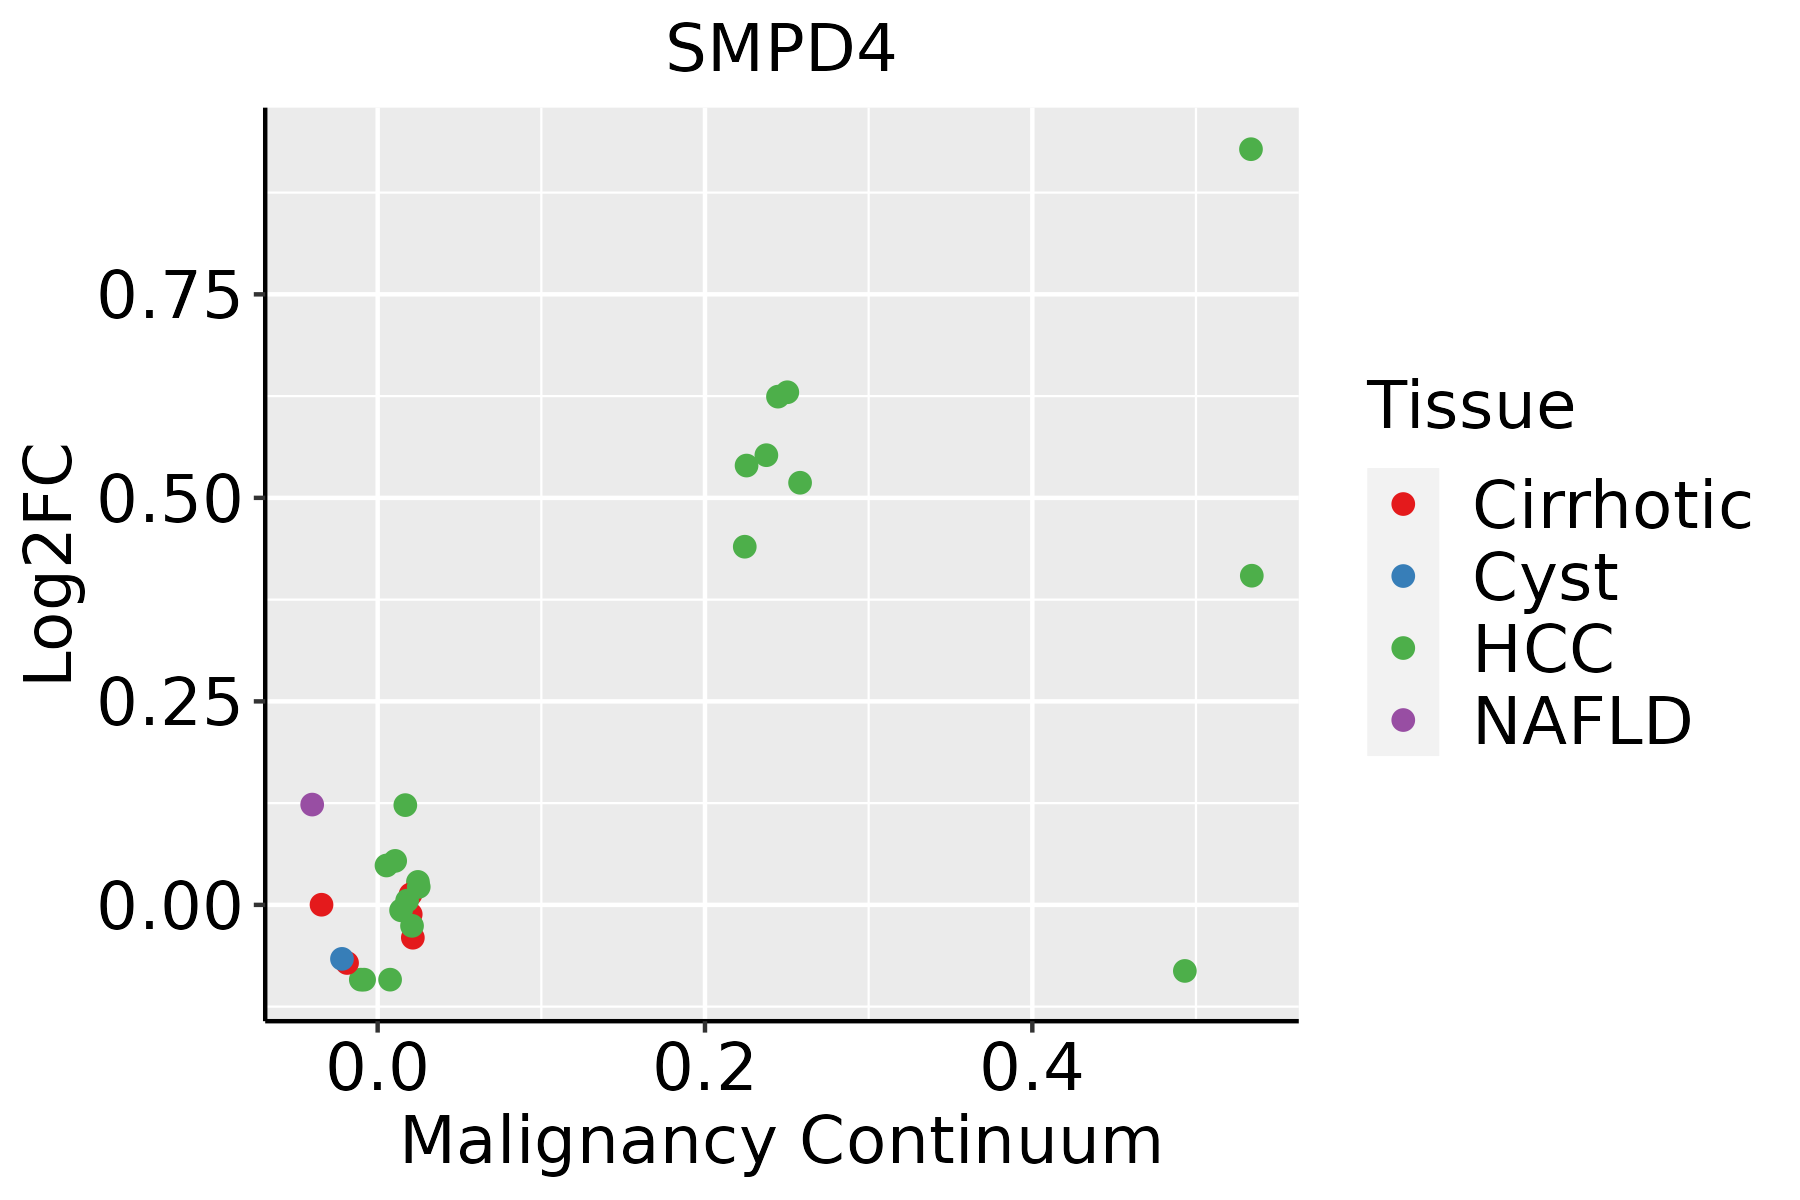 | HCC: Hepatocellular carcinoma |
| NAFLD: Non-alcoholic fatty liver disease | ||
| Oral Cavity |  | EOLP: Erosive Oral lichen planus |
| LP: leukoplakia | ||
| NEOLP: Non-erosive oral lichen planus | ||
| OSCC: Oral squamous cell carcinoma | ||
| Skin | 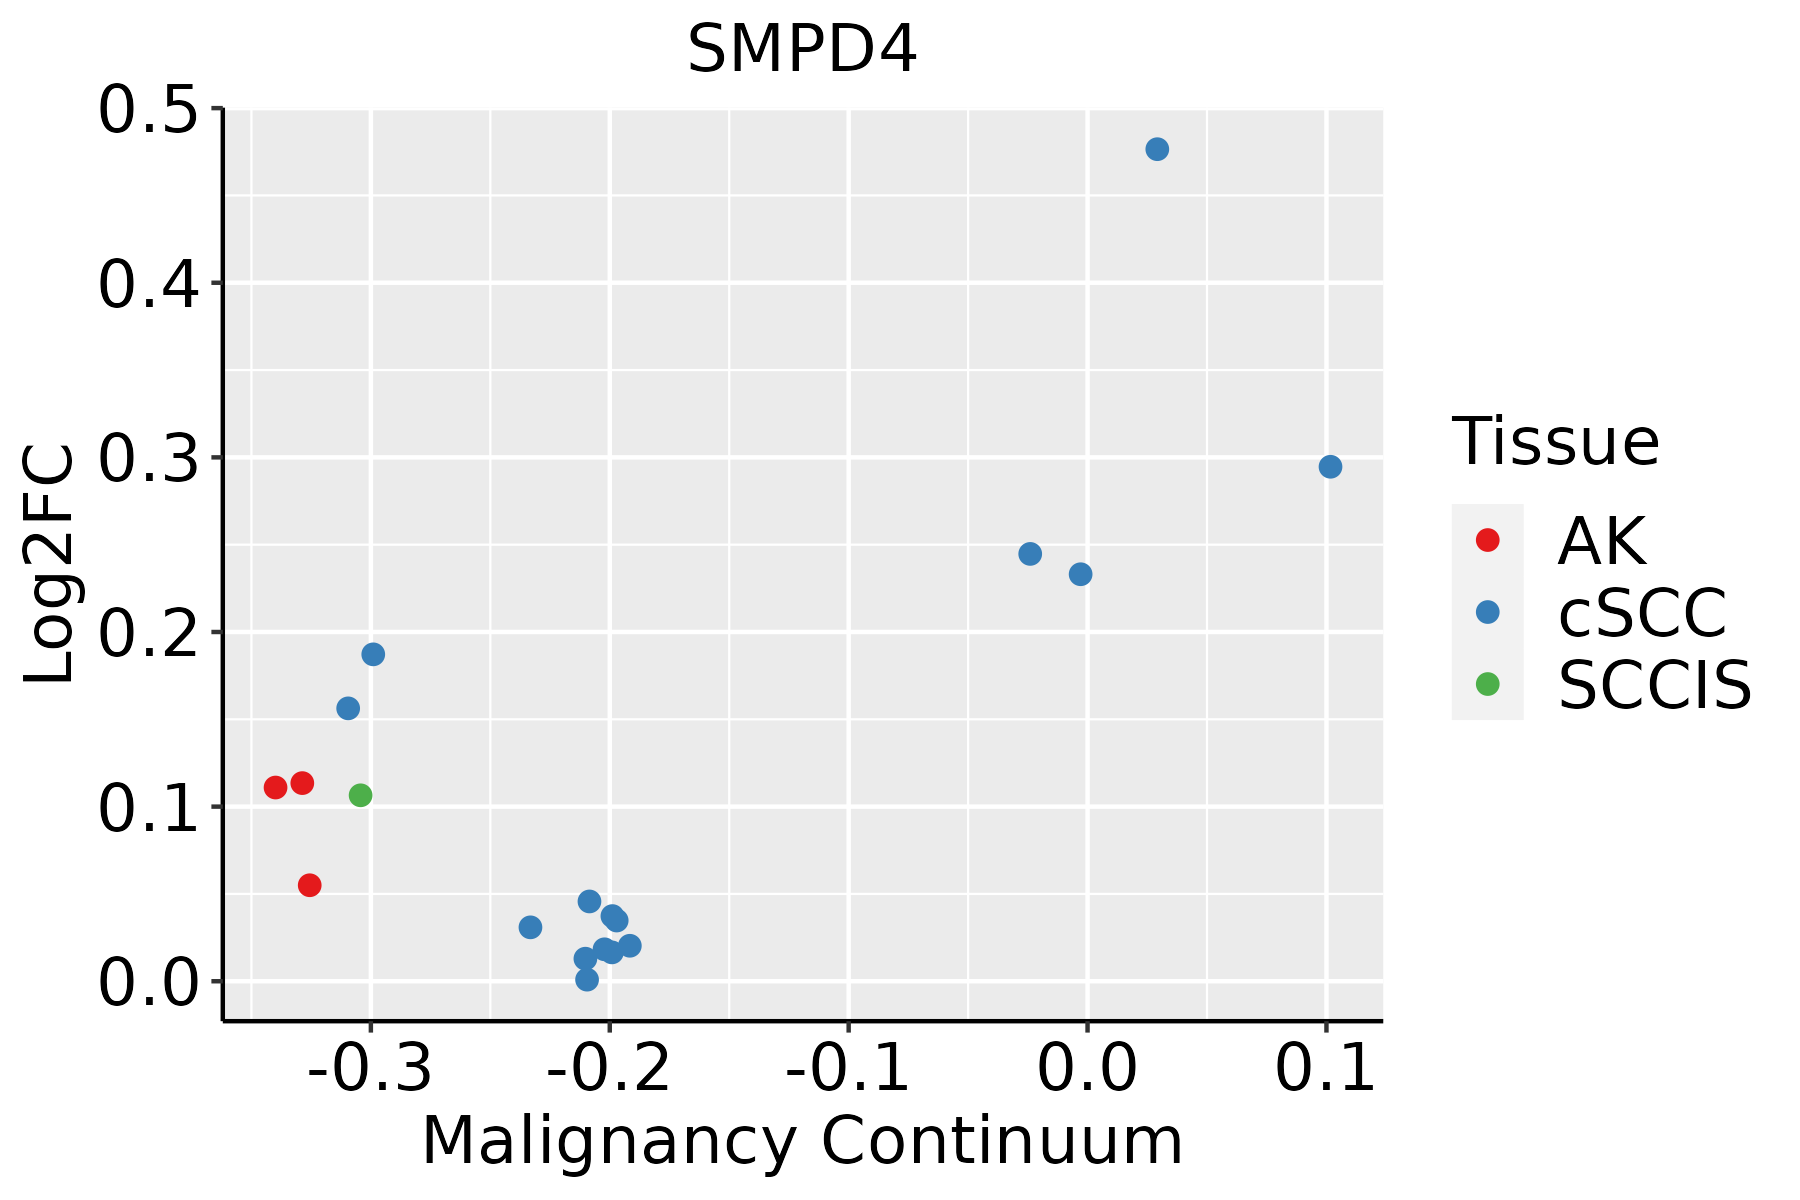 | AK: Actinic keratosis |
| cSCC: Cutaneous squamous cell carcinoma | ||
| SCCIS:squamous cell carcinoma in situ | ||
| Thyroid | 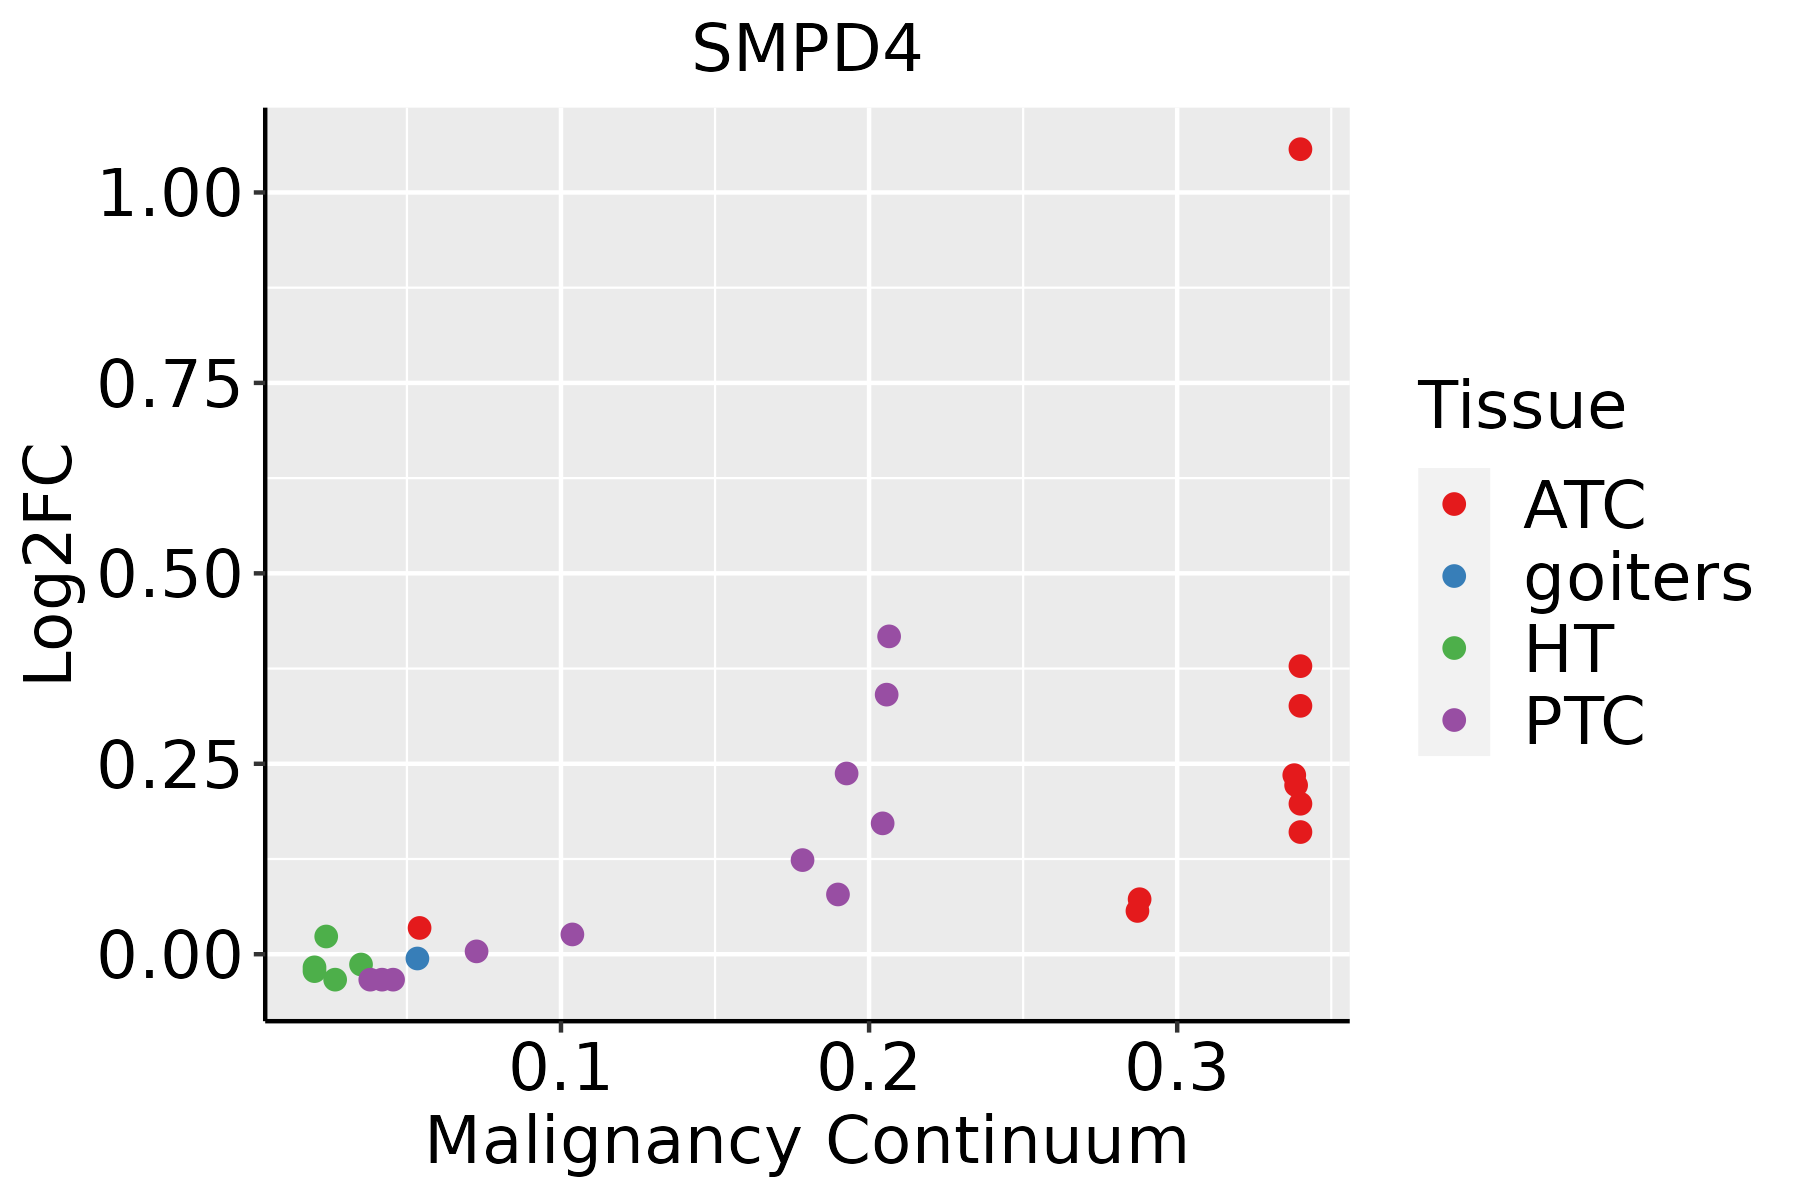 | ATC: Anaplastic thyroid cancer |
| HT: Hashimoto's thyroiditis | ||
| PTC: Papillary thyroid cancer |
| ∗log2FC in expression of this searched gene in stem-like cells from each diseased tissue sample relative to stem-like cells in normal samples in each tissue plotted against the malignancy continuum. Samples are colored based on if they are from different disease stage. |
Top |
Malignant transformation related pathway analysis |
| Find out the enriched GO biological processes and KEGG pathways involved in transition from healthy to precancer to cancer |
| Tissue | Disease Stage | Enriched GO biological Processes |
| Colorectum | AD |  |
| Colorectum | SER |  |
| Colorectum | MSS |  |
| Colorectum | MSI-H |  |
| Colorectum | FAP |  |
| ∗Top 15 enriched GO BP terms are showed in the bar plot of each disease state in each tissue. Each row represents a significant GO biological process which is colored according to the -log10(p.adjust). |
| Page: 1 2 3 4 5 6 7 8 9 |
| GO ID | Tissue | Disease Stage | Description | Gene Ratio | Bg Ratio | pvalue | p.adjust | Count |
| GO:000702914 | Esophagus | ESCC | endoplasmic reticulum organization | 65/8552 | 87/18723 | 3.28e-08 | 6.08e-07 | 65 |
| GO:00066433 | Esophagus | ESCC | membrane lipid metabolic process | 130/8552 | 203/18723 | 9.29e-08 | 1.54e-06 | 130 |
| GO:00066446 | Esophagus | ESCC | phospholipid metabolic process | 218/8552 | 383/18723 | 5.37e-06 | 5.59e-05 | 218 |
| GO:00464673 | Esophagus | ESCC | membrane lipid biosynthetic process | 91/8552 | 142/18723 | 7.19e-06 | 7.19e-05 | 91 |
| GO:003461220 | Esophagus | ESCC | response to tumor necrosis factor | 149/8552 | 253/18723 | 1.47e-05 | 1.33e-04 | 149 |
| GO:00066652 | Esophagus | ESCC | sphingolipid metabolic process | 96/8552 | 155/18723 | 3.21e-05 | 2.66e-04 | 96 |
| GO:00066505 | Esophagus | ESCC | glycerophospholipid metabolic process | 174/8552 | 306/18723 | 4.92e-05 | 3.85e-04 | 174 |
| GO:007135620 | Esophagus | ESCC | cellular response to tumor necrosis factor | 132/8552 | 229/18723 | 1.69e-04 | 1.11e-03 | 132 |
| GO:00464864 | Esophagus | ESCC | glycerolipid metabolic process | 211/8552 | 392/18723 | 6.51e-04 | 3.46e-03 | 211 |
| GO:00442427 | Esophagus | ESCC | cellular lipid catabolic process | 121/8552 | 214/18723 | 8.63e-04 | 4.43e-03 | 121 |
| GO:00301481 | Esophagus | ESCC | sphingolipid biosynthetic process | 62/8552 | 103/18723 | 2.10e-03 | 9.38e-03 | 62 |
| GO:00066721 | Esophagus | ESCC | ceramide metabolic process | 61/8552 | 102/18723 | 2.82e-03 | 1.19e-02 | 61 |
| GO:0046513 | Esophagus | ESCC | ceramide biosynthetic process | 40/8552 | 65/18723 | 7.25e-03 | 2.63e-02 | 40 |
| GO:00160427 | Esophagus | ESCC | lipid catabolic process | 168/8552 | 320/18723 | 7.97e-03 | 2.84e-02 | 168 |
| GO:004424222 | Liver | HCC | cellular lipid catabolic process | 134/7958 | 214/18723 | 2.07e-09 | 5.79e-08 | 134 |
| GO:000702911 | Liver | HCC | endoplasmic reticulum organization | 64/7958 | 87/18723 | 3.92e-09 | 1.04e-07 | 64 |
| GO:00066444 | Liver | HCC | phospholipid metabolic process | 214/7958 | 383/18723 | 7.25e-08 | 1.48e-06 | 214 |
| GO:004648611 | Liver | HCC | glycerolipid metabolic process | 215/7958 | 392/18723 | 4.54e-07 | 7.49e-06 | 215 |
| GO:001604221 | Liver | HCC | lipid catabolic process | 175/7958 | 320/18723 | 6.50e-06 | 7.88e-05 | 175 |
| GO:00066504 | Liver | HCC | glycerophospholipid metabolic process | 168/7958 | 306/18723 | 7.27e-06 | 8.62e-05 | 168 |
| Page: 1 2 3 |
| Pathway ID | Tissue | Disease Stage | Description | Gene Ratio | Bg Ratio | pvalue | p.adjust | qvalue | Count |
| hsa006003 | Esophagus | ESCC | Sphingolipid metabolism | 36/4205 | 53/8465 | 5.41e-03 | 1.36e-02 | 6.99e-03 | 36 |
| hsa0060012 | Esophagus | ESCC | Sphingolipid metabolism | 36/4205 | 53/8465 | 5.41e-03 | 1.36e-02 | 6.99e-03 | 36 |
| hsa00600 | Liver | HCC | Sphingolipid metabolism | 34/4020 | 53/8465 | 1.06e-02 | 2.71e-02 | 1.51e-02 | 34 |
| hsa006001 | Liver | HCC | Sphingolipid metabolism | 34/4020 | 53/8465 | 1.06e-02 | 2.71e-02 | 1.51e-02 | 34 |
| hsa006002 | Oral cavity | OSCC | Sphingolipid metabolism | 33/3704 | 53/8465 | 5.00e-03 | 1.20e-02 | 6.13e-03 | 33 |
| hsa0060011 | Oral cavity | OSCC | Sphingolipid metabolism | 33/3704 | 53/8465 | 5.00e-03 | 1.20e-02 | 6.13e-03 | 33 |
| Page: 1 |
Top |
Cell-cell communication analysis |
| Identification of potential cell-cell interactions between two cell types and their ligand-receptor pairs for different disease states |
| Ligand | Receptor | LRpair | Pathway | Tissue | Disease Stage |
| Page: 1 |
Top |
Single-cell gene regulatory network inference analysis |
| Find out the significant the regulons (TFs) and the target genes of each regulon across cell types for different disease states |
| TF | Cell Type | Tissue | Disease Stage | Target Gene | RSS | Regulon Activity |
| ∗The dot plots of a searched regulon are shown for all cell subpopulations in each disease state of each tissue based on the regulon specific score inferred using pySCENIC and by calculating the average expression. |
| Page: 1 |
Top |
Somatic mutation of malignant transformation related genes |
| Annotation of somatic variants for genes involved in malignant transformation |
| Hugo Symbol | Variant Class | Variant Classification | dbSNP RS | HGVSc | HGVSp | HGVSp Short | SWISSPROT | BIOTYPE | SIFT | PolyPhen | Tumor Sample Barcode | Tissue | Histology | Sex | Age | Stage | Therapy Types | Drugs | Outcome |
| SMPD4 | SNV | Missense_Mutation | c.2175N>C | p.Glu725Asp | p.E725D | protein_coding | tolerated(0.4) | benign(0.295) | TCGA-AC-A23H-01 | Breast | breast invasive carcinoma | Female | >=65 | I/II | Unknown | Unknown | PD | ||
| SMPD4 | SNV | Missense_Mutation | novel | c.754N>C | p.Thr252Pro | p.T252P | protein_coding | tolerated(0.52) | benign(0) | TCGA-AR-A1AP-01 | Breast | breast invasive carcinoma | Female | >=65 | I/II | Hormone Therapy | anastrozole | SD | |
| SMPD4 | SNV | Missense_Mutation | novel | c.1966G>A | p.Glu656Lys | p.E656K | protein_coding | tolerated(0.08) | possibly_damaging(0.638) | TCGA-D8-A27V-01 | Breast | breast invasive carcinoma | Female | <65 | I/II | Hormone Therapy | tamoxiphen | SD | |
| SMPD4 | SNV | Missense_Mutation | rs750058171 | c.272N>G | p.Val91Gly | p.V91G | protein_coding | deleterious(0) | probably_damaging(0.911) | TCGA-E9-A22A-01 | Breast | breast invasive carcinoma | Female | >=65 | I/II | Hormone Therapy | tamoxiphen | SD | |
| SMPD4 | SNV | Missense_Mutation | novel | c.198G>T | p.Gln66His | p.Q66H | protein_coding | deleterious(0) | probably_damaging(0.999) | TCGA-2W-A8YY-01 | Cervix | cervical & endocervical cancer | Female | <65 | I/II | Chemotherapy | cisplatin | CR | |
| SMPD4 | SNV | Missense_Mutation | c.2329N>G | p.Arg777Gly | p.R777G | protein_coding | deleterious(0) | probably_damaging(0.971) | TCGA-IR-A3LH-01 | Cervix | cervical & endocervical cancer | Female | <65 | I/II | Chemotherapy | cisplatin | CR | ||
| SMPD4 | SNV | Missense_Mutation | novel | c.2200N>T | p.Pro734Ser | p.P734S | protein_coding | deleterious(0) | probably_damaging(0.995) | TCGA-A6-3810-01 | Colorectum | colon adenocarcinoma | Male | <65 | I/II | Unknown | Unknown | SD | |
| SMPD4 | SNV | Missense_Mutation | c.2428N>A | p.Leu810Met | p.L810M | protein_coding | deleterious(0) | probably_damaging(1) | TCGA-A6-5661-01 | Colorectum | colon adenocarcinoma | Female | >=65 | I/II | Unknown | Unknown | SD | ||
| SMPD4 | SNV | Missense_Mutation | rs757934173 | c.364N>A | p.Val122Met | p.V122M | protein_coding | tolerated(0.06) | possibly_damaging(0.736) | TCGA-A6-6653-01 | Colorectum | colon adenocarcinoma | Male | >=65 | I/II | Unknown | Unknown | SD | |
| SMPD4 | SNV | Missense_Mutation | rs747433356 | c.1337N>T | p.Pro446Leu | p.P446L | protein_coding | deleterious(0) | probably_damaging(1) | TCGA-AA-3713-01 | Colorectum | colon adenocarcinoma | Male | >=65 | III/IV | Chemotherapy | 5-fluorouracil | PR |
| Page: 1 2 3 4 5 6 7 8 9 10 11 |
Top |
Related drugs of malignant transformation related genes |
| Identification of chemicals and drugs interact with genes involved in malignant transfromation |
| (DGIdb 4.0) |
| Entrez ID | Symbol | Category | Interaction Types | Drug Claim Name | Drug Name | PMIDs |
| Page: 1 |

Copyright 2023-Present -The University of Texas Health Science Center at Houston |