
|
|||||
|
 | |
| |
| |
| |
| |
| |
|
Gene: SMPD2 |
Gene summary for SMPD2 |
| Gene information | Species | Human | Gene symbol | SMPD2 | Gene ID | 6610 |
| Gene name | sphingomyelin phosphodiesterase 2 | |
| Gene Alias | ISC1 | |
| Cytomap | 6q21 | |
| Gene Type | protein-coding | GO ID | GO:0006629 | UniProtAcc | O60906 |
Top |
Malignant transformation analysis |
| Identification of the aberrant gene expression in precancerous and cancerous lesions by comparing the gene expression of stem-like cells in diseased tissues with normal stem cells |
| Entrez ID | Symbol | Replicates | Species | Organ | Tissue | Adj P-value | Log2FC | Malignancy |
| 6610 | SMPD2 | LZE4T | Human | Esophagus | ESCC | 7.80e-04 | 1.06e-01 | 0.0811 |
| 6610 | SMPD2 | LZE24T | Human | Esophagus | ESCC | 1.83e-12 | 3.48e-01 | 0.0596 |
| 6610 | SMPD2 | P1T-E | Human | Esophagus | ESCC | 4.57e-04 | 2.35e-01 | 0.0875 |
| 6610 | SMPD2 | P2T-E | Human | Esophagus | ESCC | 3.22e-15 | 3.15e-01 | 0.1177 |
| 6610 | SMPD2 | P4T-E | Human | Esophagus | ESCC | 1.32e-15 | 3.21e-01 | 0.1323 |
| 6610 | SMPD2 | P5T-E | Human | Esophagus | ESCC | 1.65e-05 | 1.94e-01 | 0.1327 |
| 6610 | SMPD2 | P8T-E | Human | Esophagus | ESCC | 7.32e-09 | 1.22e-01 | 0.0889 |
| 6610 | SMPD2 | P9T-E | Human | Esophagus | ESCC | 1.02e-06 | 1.24e-01 | 0.1131 |
| 6610 | SMPD2 | P10T-E | Human | Esophagus | ESCC | 2.71e-09 | 8.78e-02 | 0.116 |
| 6610 | SMPD2 | P11T-E | Human | Esophagus | ESCC | 1.40e-05 | 2.27e-01 | 0.1426 |
| 6610 | SMPD2 | P12T-E | Human | Esophagus | ESCC | 9.67e-06 | 1.57e-01 | 0.1122 |
| 6610 | SMPD2 | P15T-E | Human | Esophagus | ESCC | 7.61e-08 | 2.00e-01 | 0.1149 |
| 6610 | SMPD2 | P16T-E | Human | Esophagus | ESCC | 7.91e-34 | 6.58e-01 | 0.1153 |
| 6610 | SMPD2 | P20T-E | Human | Esophagus | ESCC | 1.25e-05 | 7.66e-02 | 0.1124 |
| 6610 | SMPD2 | P21T-E | Human | Esophagus | ESCC | 3.01e-17 | 2.97e-01 | 0.1617 |
| 6610 | SMPD2 | P22T-E | Human | Esophagus | ESCC | 3.73e-14 | 1.57e-01 | 0.1236 |
| 6610 | SMPD2 | P23T-E | Human | Esophagus | ESCC | 1.34e-17 | 4.13e-01 | 0.108 |
| 6610 | SMPD2 | P24T-E | Human | Esophagus | ESCC | 2.22e-10 | 2.51e-01 | 0.1287 |
| 6610 | SMPD2 | P26T-E | Human | Esophagus | ESCC | 1.22e-07 | 1.34e-01 | 0.1276 |
| 6610 | SMPD2 | P27T-E | Human | Esophagus | ESCC | 1.45e-08 | 1.99e-01 | 0.1055 |
| Page: 1 2 3 4 |
| Tissue | Expression Dynamics | Abbreviation |
| Esophagus |  | ESCC: Esophageal squamous cell carcinoma |
| HGIN: High-grade intraepithelial neoplasias | ||
| LGIN: Low-grade intraepithelial neoplasias | ||
| Liver |  | HCC: Hepatocellular carcinoma |
| NAFLD: Non-alcoholic fatty liver disease | ||
| Oral Cavity | 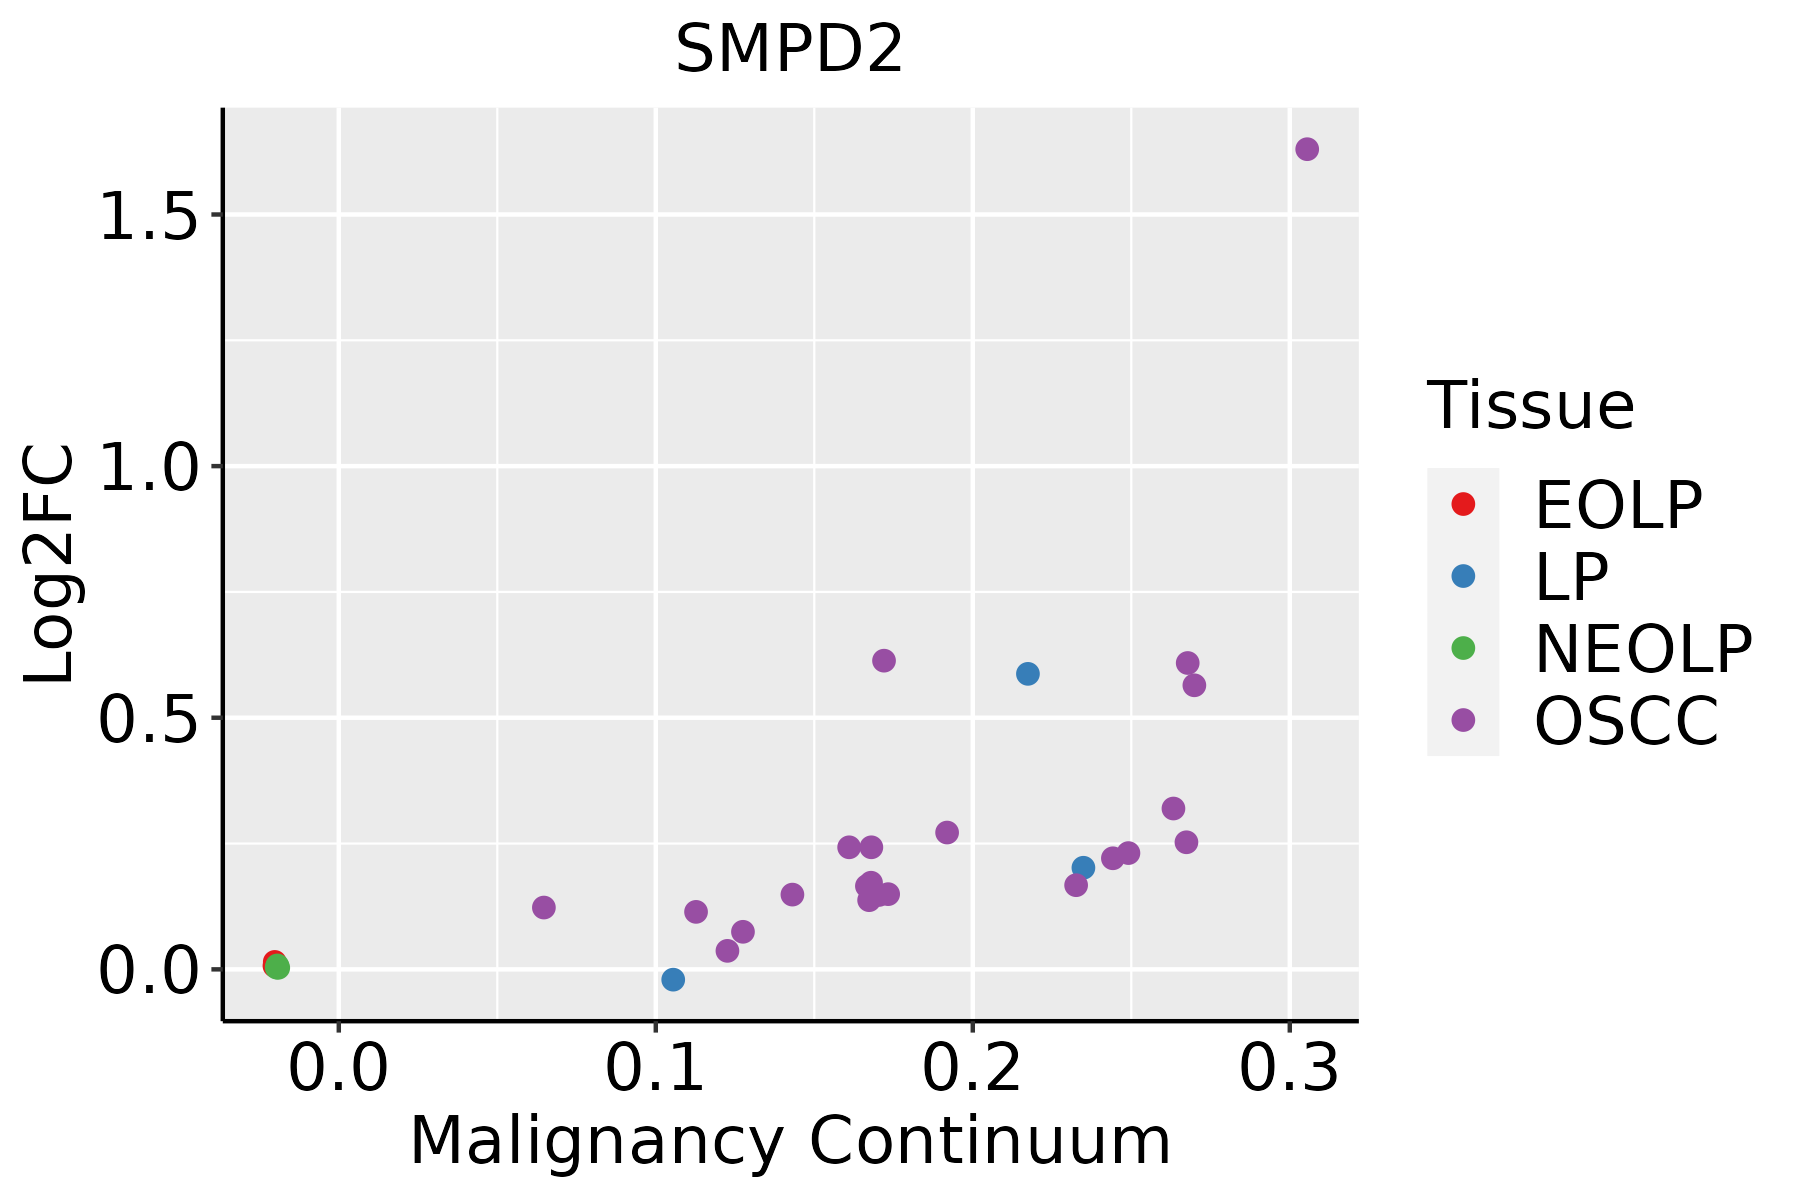 | EOLP: Erosive Oral lichen planus |
| LP: leukoplakia | ||
| NEOLP: Non-erosive oral lichen planus | ||
| OSCC: Oral squamous cell carcinoma |
| ∗log2FC in expression of this searched gene in stem-like cells from each diseased tissue sample relative to stem-like cells in normal samples in each tissue plotted against the malignancy continuum. Samples are colored based on if they are from different disease stage. |
Top |
Malignant transformation related pathway analysis |
| Find out the enriched GO biological processes and KEGG pathways involved in transition from healthy to precancer to cancer |
| Tissue | Disease Stage | Enriched GO biological Processes |
| Colorectum | AD |  |
| Colorectum | SER |  |
| Colorectum | MSS |  |
| Colorectum | MSI-H |  |
| Colorectum | FAP |  |
| ∗Top 15 enriched GO BP terms are showed in the bar plot of each disease state in each tissue. Each row represents a significant GO biological process which is colored according to the -log10(p.adjust). |
| Page: 1 2 3 4 5 6 7 8 9 |
| GO ID | Tissue | Disease Stage | Description | Gene Ratio | Bg Ratio | pvalue | p.adjust | Count |
| GO:00066433 | Esophagus | ESCC | membrane lipid metabolic process | 130/8552 | 203/18723 | 9.29e-08 | 1.54e-06 | 130 |
| GO:00066446 | Esophagus | ESCC | phospholipid metabolic process | 218/8552 | 383/18723 | 5.37e-06 | 5.59e-05 | 218 |
| GO:00464673 | Esophagus | ESCC | membrane lipid biosynthetic process | 91/8552 | 142/18723 | 7.19e-06 | 7.19e-05 | 91 |
| GO:00066652 | Esophagus | ESCC | sphingolipid metabolic process | 96/8552 | 155/18723 | 3.21e-05 | 2.66e-04 | 96 |
| GO:000961216 | Esophagus | ESCC | response to mechanical stimulus | 124/8552 | 216/18723 | 3.30e-04 | 1.94e-03 | 124 |
| GO:00442427 | Esophagus | ESCC | cellular lipid catabolic process | 121/8552 | 214/18723 | 8.63e-04 | 4.43e-03 | 121 |
| GO:00301481 | Esophagus | ESCC | sphingolipid biosynthetic process | 62/8552 | 103/18723 | 2.10e-03 | 9.38e-03 | 62 |
| GO:00066721 | Esophagus | ESCC | ceramide metabolic process | 61/8552 | 102/18723 | 2.82e-03 | 1.19e-02 | 61 |
| GO:0046513 | Esophagus | ESCC | ceramide biosynthetic process | 40/8552 | 65/18723 | 7.25e-03 | 2.63e-02 | 40 |
| GO:00160427 | Esophagus | ESCC | lipid catabolic process | 168/8552 | 320/18723 | 7.97e-03 | 2.84e-02 | 168 |
| GO:004424222 | Liver | HCC | cellular lipid catabolic process | 134/7958 | 214/18723 | 2.07e-09 | 5.79e-08 | 134 |
| GO:00066444 | Liver | HCC | phospholipid metabolic process | 214/7958 | 383/18723 | 7.25e-08 | 1.48e-06 | 214 |
| GO:001604221 | Liver | HCC | lipid catabolic process | 175/7958 | 320/18723 | 6.50e-06 | 7.88e-05 | 175 |
| GO:00066431 | Liver | HCC | membrane lipid metabolic process | 115/7958 | 203/18723 | 3.17e-05 | 3.22e-04 | 115 |
| GO:00464342 | Liver | HCC | organophosphate catabolic process | 89/7958 | 155/18723 | 1.24e-04 | 1.03e-03 | 89 |
| GO:0006665 | Liver | HCC | sphingolipid metabolic process | 85/7958 | 155/18723 | 1.27e-03 | 6.92e-03 | 85 |
| GO:0046467 | Liver | HCC | membrane lipid biosynthetic process | 78/7958 | 142/18723 | 1.85e-03 | 9.46e-03 | 78 |
| GO:00096124 | Liver | HCC | response to mechanical stimulus | 113/7958 | 216/18723 | 2.20e-03 | 1.10e-02 | 113 |
| GO:00066432 | Oral cavity | OSCC | membrane lipid metabolic process | 111/7305 | 203/18723 | 4.02e-06 | 4.69e-05 | 111 |
| GO:000961210 | Oral cavity | OSCC | response to mechanical stimulus | 115/7305 | 216/18723 | 1.43e-05 | 1.44e-04 | 115 |
| Page: 1 2 |
| Pathway ID | Tissue | Disease Stage | Description | Gene Ratio | Bg Ratio | pvalue | p.adjust | qvalue | Count |
| hsa0407116 | Esophagus | ESCC | Sphingolipid signaling pathway | 85/4205 | 121/8465 | 3.04e-06 | 1.73e-05 | 8.84e-06 | 85 |
| hsa006003 | Esophagus | ESCC | Sphingolipid metabolism | 36/4205 | 53/8465 | 5.41e-03 | 1.36e-02 | 6.99e-03 | 36 |
| hsa0407117 | Esophagus | ESCC | Sphingolipid signaling pathway | 85/4205 | 121/8465 | 3.04e-06 | 1.73e-05 | 8.84e-06 | 85 |
| hsa0060012 | Esophagus | ESCC | Sphingolipid metabolism | 36/4205 | 53/8465 | 5.41e-03 | 1.36e-02 | 6.99e-03 | 36 |
| hsa040718 | Liver | HCC | Sphingolipid signaling pathway | 72/4020 | 121/8465 | 5.01e-03 | 1.47e-02 | 8.18e-03 | 72 |
| hsa00600 | Liver | HCC | Sphingolipid metabolism | 34/4020 | 53/8465 | 1.06e-02 | 2.71e-02 | 1.51e-02 | 34 |
| hsa0407111 | Liver | HCC | Sphingolipid signaling pathway | 72/4020 | 121/8465 | 5.01e-03 | 1.47e-02 | 8.18e-03 | 72 |
| hsa006001 | Liver | HCC | Sphingolipid metabolism | 34/4020 | 53/8465 | 1.06e-02 | 2.71e-02 | 1.51e-02 | 34 |
| hsa0407114 | Oral cavity | OSCC | Sphingolipid signaling pathway | 82/3704 | 121/8465 | 6.97e-08 | 5.08e-07 | 2.58e-07 | 82 |
| hsa006002 | Oral cavity | OSCC | Sphingolipid metabolism | 33/3704 | 53/8465 | 5.00e-03 | 1.20e-02 | 6.13e-03 | 33 |
| hsa0407115 | Oral cavity | OSCC | Sphingolipid signaling pathway | 82/3704 | 121/8465 | 6.97e-08 | 5.08e-07 | 2.58e-07 | 82 |
| hsa0060011 | Oral cavity | OSCC | Sphingolipid metabolism | 33/3704 | 53/8465 | 5.00e-03 | 1.20e-02 | 6.13e-03 | 33 |
| hsa0407122 | Oral cavity | LP | Sphingolipid signaling pathway | 48/2418 | 121/8465 | 5.30e-03 | 2.15e-02 | 1.39e-02 | 48 |
| hsa0407132 | Oral cavity | LP | Sphingolipid signaling pathway | 48/2418 | 121/8465 | 5.30e-03 | 2.15e-02 | 1.39e-02 | 48 |
| Page: 1 |
Top |
Cell-cell communication analysis |
| Identification of potential cell-cell interactions between two cell types and their ligand-receptor pairs for different disease states |
| Ligand | Receptor | LRpair | Pathway | Tissue | Disease Stage |
| Page: 1 |
Top |
Single-cell gene regulatory network inference analysis |
| Find out the significant the regulons (TFs) and the target genes of each regulon across cell types for different disease states |
| TF | Cell Type | Tissue | Disease Stage | Target Gene | RSS | Regulon Activity |
| ∗The dot plots of a searched regulon are shown for all cell subpopulations in each disease state of each tissue based on the regulon specific score inferred using pySCENIC and by calculating the average expression. |
| Page: 1 |
Top |
Somatic mutation of malignant transformation related genes |
| Annotation of somatic variants for genes involved in malignant transformation |
| Hugo Symbol | Variant Class | Variant Classification | dbSNP RS | HGVSc | HGVSp | HGVSp Short | SWISSPROT | BIOTYPE | SIFT | PolyPhen | Tumor Sample Barcode | Tissue | Histology | Sex | Age | Stage | Therapy Types | Drugs | Outcome |
| SMPD2 | SNV | Missense_Mutation | novel | c.1201N>C | p.Asp401His | p.D401H | O60906 | protein_coding | deleterious_low_confidence(0.02) | benign(0.444) | TCGA-E9-A1RF-01 | Breast | breast invasive carcinoma | Female | >=65 | III/IV | Hormone Therapy | tamoxiphen | SD |
| SMPD2 | SNV | Missense_Mutation | novel | c.1201G>A | p.Asp401Asn | p.D401N | O60906 | protein_coding | tolerated_low_confidence(0.22) | benign(0.003) | TCGA-C5-A902-01 | Cervix | cervical & endocervical cancer | Female | <65 | I/II | Chemotherapy | cisplatin | SD |
| SMPD2 | SNV | Missense_Mutation | rs531649765 | c.668N>C | p.Val223Ala | p.V223A | O60906 | protein_coding | tolerated(0.12) | probably_damaging(0.926) | TCGA-DR-A0ZL-01 | Cervix | cervical & endocervical cancer | Female | <65 | I/II | Unknown | Unknown | SD |
| SMPD2 | SNV | Missense_Mutation | novel | c.98T>C | p.Leu33Pro | p.L33P | O60906 | protein_coding | deleterious(0) | probably_damaging(0.989) | TCGA-EA-A410-01 | Cervix | cervical & endocervical cancer | Female | <65 | I/II | Unknown | Unknown | SD |
| SMPD2 | SNV | Missense_Mutation | c.889G>A | p.Ala297Thr | p.A297T | O60906 | protein_coding | tolerated(0.17) | benign(0.081) | TCGA-A6-5665-01 | Colorectum | colon adenocarcinoma | Female | >=65 | I/II | Unknown | Unknown | PD | |
| SMPD2 | SNV | Missense_Mutation | rs138354272 | c.53N>A | p.Gly18Asp | p.G18D | O60906 | protein_coding | tolerated(0.3) | benign(0.01) | TCGA-AA-3984-01 | Colorectum | colon adenocarcinoma | Female | <65 | I/II | Unknown | Unknown | SD |
| SMPD2 | SNV | Missense_Mutation | novel | c.712G>T | p.Asp238Tyr | p.D238Y | O60906 | protein_coding | deleterious(0) | probably_damaging(1) | TCGA-AA-A00N-01 | Colorectum | colon adenocarcinoma | Male | >=65 | I/II | Unknown | Unknown | PD |
| SMPD2 | SNV | Missense_Mutation | c.1102N>T | p.Ala368Ser | p.A368S | O60906 | protein_coding | tolerated(0.08) | benign(0.011) | TCGA-AD-6964-01 | Colorectum | colon adenocarcinoma | Male | <65 | III/IV | Chemotherapy | folfox | PD | |
| SMPD2 | SNV | Missense_Mutation | rs142939267 | c.718N>A | p.Val240Met | p.V240M | O60906 | protein_coding | tolerated(0.1) | benign(0.211) | TCGA-AD-A5EJ-01 | Colorectum | colon adenocarcinoma | Female | >=65 | I/II | Unknown | Unknown | SD |
| SMPD2 | SNV | Missense_Mutation | c.675N>C | p.Gln225His | p.Q225H | O60906 | protein_coding | tolerated(0.08) | benign(0.012) | TCGA-AY-5543-01 | Colorectum | colon adenocarcinoma | Female | >=65 | I/II | Chemotherapy | oxaliplatin | SD |
| Page: 1 2 3 4 |
Top |
Related drugs of malignant transformation related genes |
| Identification of chemicals and drugs interact with genes involved in malignant transfromation |
| (DGIdb 4.0) |
| Entrez ID | Symbol | Category | Interaction Types | Drug Claim Name | Drug Name | PMIDs |
| Page: 1 |

Copyright 2023-Present -The University of Texas Health Science Center at Houston |