
|
|||||
|
 | |
| |
| |
| |
| |
| |
|
Gene: SMPD1 |
Gene summary for SMPD1 |
| Gene information | Species | Human | Gene symbol | SMPD1 | Gene ID | 6609 |
| Gene name | sphingomyelin phosphodiesterase 1 | |
| Gene Alias | ASM | |
| Cytomap | 11p15.4 | |
| Gene Type | protein-coding | GO ID | GO:0000165 | UniProtAcc | P17405 |
Top |
Malignant transformation analysis |
| Identification of the aberrant gene expression in precancerous and cancerous lesions by comparing the gene expression of stem-like cells in diseased tissues with normal stem cells |
| Entrez ID | Symbol | Replicates | Species | Organ | Tissue | Adj P-value | Log2FC | Malignancy |
| 6609 | SMPD1 | LZE7T | Human | Esophagus | ESCC | 7.77e-05 | 2.62e-01 | 0.0667 |
| 6609 | SMPD1 | LZE24T | Human | Esophagus | ESCC | 2.17e-07 | 2.32e-01 | 0.0596 |
| 6609 | SMPD1 | P2T-E | Human | Esophagus | ESCC | 9.81e-11 | 1.70e-01 | 0.1177 |
| 6609 | SMPD1 | P4T-E | Human | Esophagus | ESCC | 4.67e-07 | 2.61e-01 | 0.1323 |
| 6609 | SMPD1 | P8T-E | Human | Esophagus | ESCC | 7.93e-13 | 1.86e-01 | 0.0889 |
| 6609 | SMPD1 | P9T-E | Human | Esophagus | ESCC | 5.71e-08 | 2.66e-01 | 0.1131 |
| 6609 | SMPD1 | P10T-E | Human | Esophagus | ESCC | 9.06e-19 | 2.67e-01 | 0.116 |
| 6609 | SMPD1 | P11T-E | Human | Esophagus | ESCC | 1.14e-12 | 5.68e-01 | 0.1426 |
| 6609 | SMPD1 | P12T-E | Human | Esophagus | ESCC | 3.17e-14 | 2.66e-01 | 0.1122 |
| 6609 | SMPD1 | P15T-E | Human | Esophagus | ESCC | 1.15e-05 | 1.19e-01 | 0.1149 |
| 6609 | SMPD1 | P16T-E | Human | Esophagus | ESCC | 7.72e-07 | 1.20e-01 | 0.1153 |
| 6609 | SMPD1 | P20T-E | Human | Esophagus | ESCC | 1.39e-05 | 1.05e-01 | 0.1124 |
| 6609 | SMPD1 | P21T-E | Human | Esophagus | ESCC | 2.25e-19 | 2.46e-01 | 0.1617 |
| 6609 | SMPD1 | P22T-E | Human | Esophagus | ESCC | 1.89e-04 | 9.67e-02 | 0.1236 |
| 6609 | SMPD1 | P24T-E | Human | Esophagus | ESCC | 1.70e-08 | 1.91e-01 | 0.1287 |
| 6609 | SMPD1 | P26T-E | Human | Esophagus | ESCC | 8.97e-15 | 2.02e-01 | 0.1276 |
| 6609 | SMPD1 | P27T-E | Human | Esophagus | ESCC | 2.65e-11 | 1.07e-01 | 0.1055 |
| 6609 | SMPD1 | P28T-E | Human | Esophagus | ESCC | 7.38e-14 | 1.58e-01 | 0.1149 |
| 6609 | SMPD1 | P31T-E | Human | Esophagus | ESCC | 1.90e-04 | 2.81e-02 | 0.1251 |
| 6609 | SMPD1 | P32T-E | Human | Esophagus | ESCC | 2.90e-26 | 5.11e-01 | 0.1666 |
| Page: 1 2 3 4 5 |
| Tissue | Expression Dynamics | Abbreviation |
| Esophagus | 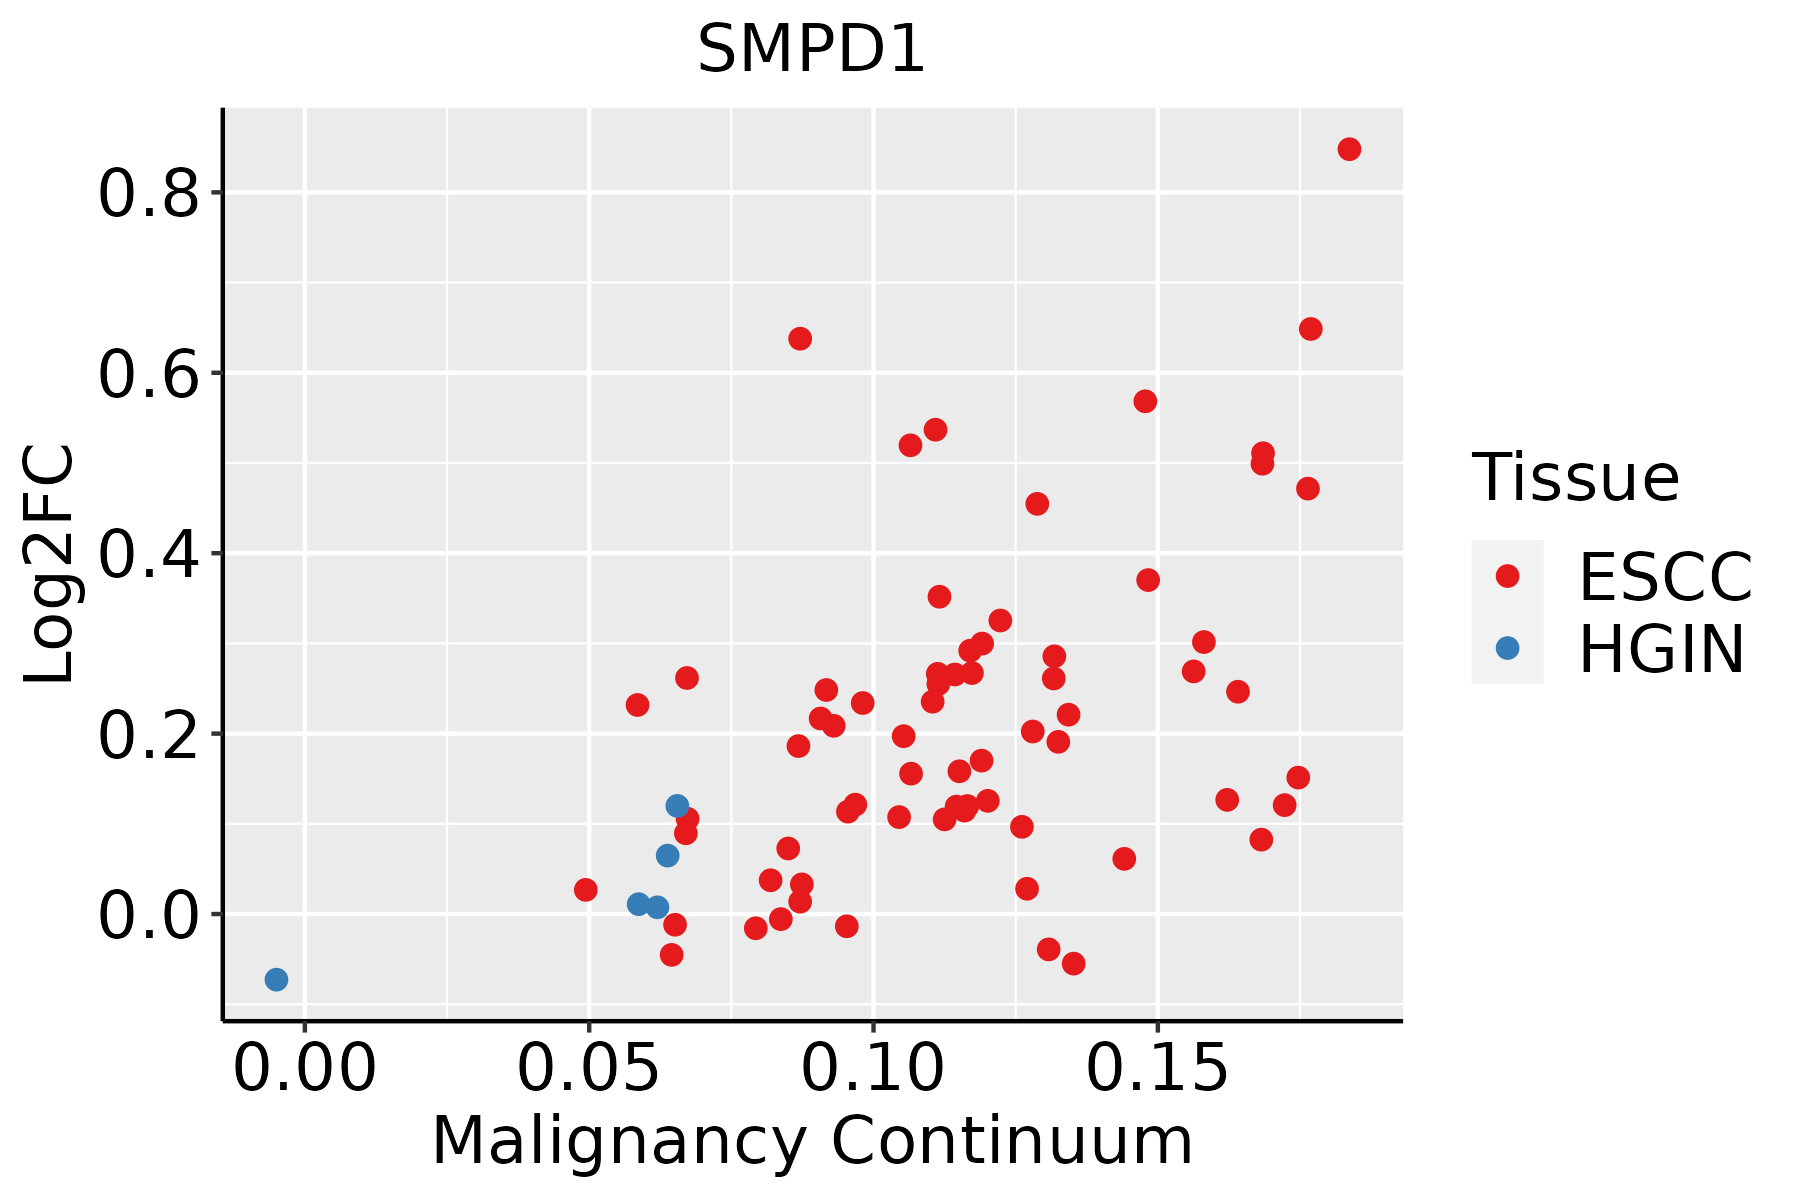 | ESCC: Esophageal squamous cell carcinoma |
| HGIN: High-grade intraepithelial neoplasias | ||
| LGIN: Low-grade intraepithelial neoplasias | ||
| Liver | 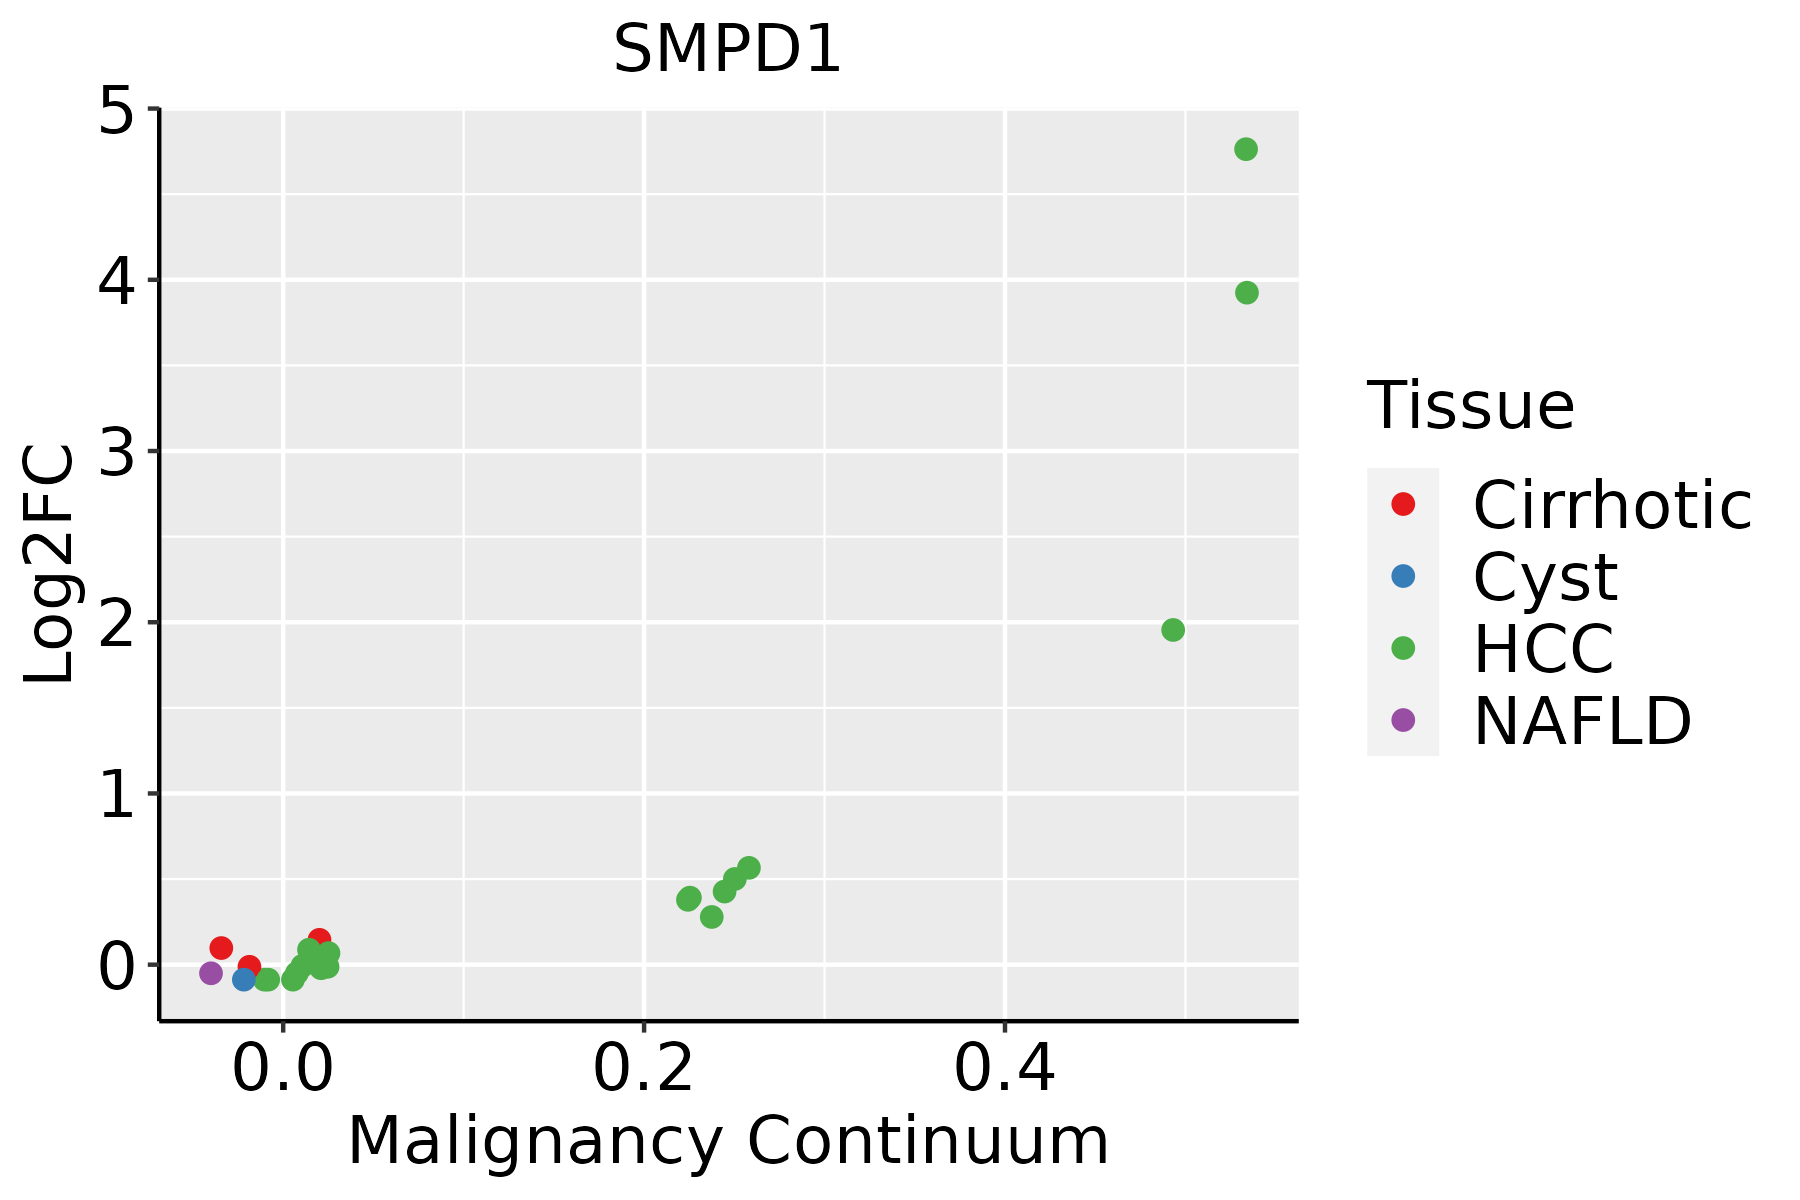 | HCC: Hepatocellular carcinoma |
| NAFLD: Non-alcoholic fatty liver disease | ||
| Oral Cavity |  | EOLP: Erosive Oral lichen planus |
| LP: leukoplakia | ||
| NEOLP: Non-erosive oral lichen planus | ||
| OSCC: Oral squamous cell carcinoma | ||
| Thyroid |  | ATC: Anaplastic thyroid cancer |
| HT: Hashimoto's thyroiditis | ||
| PTC: Papillary thyroid cancer |
| ∗log2FC in expression of this searched gene in stem-like cells from each diseased tissue sample relative to stem-like cells in normal samples in each tissue plotted against the malignancy continuum. Samples are colored based on if they are from different disease stage. |
Top |
Malignant transformation related pathway analysis |
| Find out the enriched GO biological processes and KEGG pathways involved in transition from healthy to precancer to cancer |
| Tissue | Disease Stage | Enriched GO biological Processes |
| Colorectum | AD |  |
| Colorectum | SER |  |
| Colorectum | MSS |  |
| Colorectum | MSI-H |  |
| Colorectum | FAP |  |
| ∗Top 15 enriched GO BP terms are showed in the bar plot of each disease state in each tissue. Each row represents a significant GO biological process which is colored according to the -log10(p.adjust). |
| Page: 1 2 3 4 5 6 7 8 9 |
| GO ID | Tissue | Disease Stage | Description | Gene Ratio | Bg Ratio | pvalue | p.adjust | Count |
| GO:0016032111 | Esophagus | ESCC | viral process | 301/8552 | 415/18723 | 3.34e-29 | 1.32e-26 | 301 |
| GO:0019058111 | Esophagus | ESCC | viral life cycle | 226/8552 | 317/18723 | 1.17e-20 | 1.76e-18 | 226 |
| GO:000941113 | Esophagus | ESCC | response to UV | 115/8552 | 149/18723 | 3.29e-15 | 1.93e-13 | 115 |
| GO:000961518 | Esophagus | ESCC | response to virus | 238/8552 | 367/18723 | 6.65e-14 | 3.32e-12 | 238 |
| GO:001021217 | Esophagus | ESCC | response to ionizing radiation | 110/8552 | 148/18723 | 1.11e-12 | 4.78e-11 | 110 |
| GO:0010563111 | Esophagus | ESCC | negative regulation of phosphorus metabolic process | 274/8552 | 442/18723 | 2.32e-12 | 9.41e-11 | 274 |
| GO:0045936111 | Esophagus | ESCC | negative regulation of phosphate metabolic process | 273/8552 | 441/18723 | 3.18e-12 | 1.25e-10 | 273 |
| GO:0051348111 | Esophagus | ESCC | negative regulation of transferase activity | 177/8552 | 268/18723 | 1.08e-11 | 4.00e-10 | 177 |
| GO:007190016 | Esophagus | ESCC | regulation of protein serine/threonine kinase activity | 227/8552 | 359/18723 | 1.12e-11 | 4.10e-10 | 227 |
| GO:000931419 | Esophagus | ESCC | response to radiation | 277/8552 | 456/18723 | 4.42e-11 | 1.43e-09 | 277 |
| GO:0044403111 | Esophagus | ESCC | biological process involved in symbiotic interaction | 186/8552 | 290/18723 | 1.43e-10 | 4.16e-09 | 186 |
| GO:0042326111 | Esophagus | ESCC | negative regulation of phosphorylation | 237/8552 | 385/18723 | 1.86e-10 | 5.33e-09 | 237 |
| GO:0001933111 | Esophagus | ESCC | negative regulation of protein phosphorylation | 213/8552 | 342/18723 | 3.54e-10 | 9.76e-09 | 213 |
| GO:003464413 | Esophagus | ESCC | cellular response to UV | 70/8552 | 90/18723 | 4.59e-10 | 1.20e-08 | 70 |
| GO:007121419 | Esophagus | ESCC | cellular response to abiotic stimulus | 206/8552 | 331/18723 | 7.52e-10 | 1.88e-08 | 206 |
| GO:010400419 | Esophagus | ESCC | cellular response to environmental stimulus | 206/8552 | 331/18723 | 7.52e-10 | 1.88e-08 | 206 |
| GO:001631110 | Esophagus | ESCC | dephosphorylation | 251/8552 | 417/18723 | 1.26e-09 | 2.99e-08 | 251 |
| GO:003367319 | Esophagus | ESCC | negative regulation of kinase activity | 154/8552 | 237/18723 | 1.38e-09 | 3.27e-08 | 154 |
| GO:0051701111 | Esophagus | ESCC | biological process involved in interaction with host | 135/8552 | 203/18723 | 1.49e-09 | 3.49e-08 | 135 |
| GO:000646920 | Esophagus | ESCC | negative regulation of protein kinase activity | 140/8552 | 212/18723 | 1.53e-09 | 3.56e-08 | 140 |
| Page: 1 2 3 4 5 6 7 8 9 10 11 12 13 14 15 16 17 18 |
| Pathway ID | Tissue | Disease Stage | Description | Gene Ratio | Bg Ratio | pvalue | p.adjust | qvalue | Count |
| hsa0414222 | Esophagus | ESCC | Lysosome | 102/4205 | 132/8465 | 5.11e-11 | 7.13e-10 | 3.65e-10 | 102 |
| hsa0407116 | Esophagus | ESCC | Sphingolipid signaling pathway | 85/4205 | 121/8465 | 3.04e-06 | 1.73e-05 | 8.84e-06 | 85 |
| hsa006003 | Esophagus | ESCC | Sphingolipid metabolism | 36/4205 | 53/8465 | 5.41e-03 | 1.36e-02 | 6.99e-03 | 36 |
| hsa0414232 | Esophagus | ESCC | Lysosome | 102/4205 | 132/8465 | 5.11e-11 | 7.13e-10 | 3.65e-10 | 102 |
| hsa0407117 | Esophagus | ESCC | Sphingolipid signaling pathway | 85/4205 | 121/8465 | 3.04e-06 | 1.73e-05 | 8.84e-06 | 85 |
| hsa0060012 | Esophagus | ESCC | Sphingolipid metabolism | 36/4205 | 53/8465 | 5.41e-03 | 1.36e-02 | 6.99e-03 | 36 |
| hsa041424 | Liver | Cirrhotic | Lysosome | 68/2530 | 132/8465 | 1.34e-07 | 1.97e-06 | 1.21e-06 | 68 |
| hsa0414211 | Liver | Cirrhotic | Lysosome | 68/2530 | 132/8465 | 1.34e-07 | 1.97e-06 | 1.21e-06 | 68 |
| hsa041422 | Liver | HCC | Lysosome | 100/4020 | 132/8465 | 2.32e-11 | 4.31e-10 | 2.40e-10 | 100 |
| hsa040718 | Liver | HCC | Sphingolipid signaling pathway | 72/4020 | 121/8465 | 5.01e-03 | 1.47e-02 | 8.18e-03 | 72 |
| hsa00600 | Liver | HCC | Sphingolipid metabolism | 34/4020 | 53/8465 | 1.06e-02 | 2.71e-02 | 1.51e-02 | 34 |
| hsa041423 | Liver | HCC | Lysosome | 100/4020 | 132/8465 | 2.32e-11 | 4.31e-10 | 2.40e-10 | 100 |
| hsa0407111 | Liver | HCC | Sphingolipid signaling pathway | 72/4020 | 121/8465 | 5.01e-03 | 1.47e-02 | 8.18e-03 | 72 |
| hsa006001 | Liver | HCC | Sphingolipid metabolism | 34/4020 | 53/8465 | 1.06e-02 | 2.71e-02 | 1.51e-02 | 34 |
| hsa0407114 | Oral cavity | OSCC | Sphingolipid signaling pathway | 82/3704 | 121/8465 | 6.97e-08 | 5.08e-07 | 2.58e-07 | 82 |
| hsa041425 | Oral cavity | OSCC | Lysosome | 87/3704 | 132/8465 | 1.97e-07 | 1.35e-06 | 6.86e-07 | 87 |
| hsa006002 | Oral cavity | OSCC | Sphingolipid metabolism | 33/3704 | 53/8465 | 5.00e-03 | 1.20e-02 | 6.13e-03 | 33 |
| hsa0407115 | Oral cavity | OSCC | Sphingolipid signaling pathway | 82/3704 | 121/8465 | 6.97e-08 | 5.08e-07 | 2.58e-07 | 82 |
| hsa0414212 | Oral cavity | OSCC | Lysosome | 87/3704 | 132/8465 | 1.97e-07 | 1.35e-06 | 6.86e-07 | 87 |
| hsa0060011 | Oral cavity | OSCC | Sphingolipid metabolism | 33/3704 | 53/8465 | 5.00e-03 | 1.20e-02 | 6.13e-03 | 33 |
| Page: 1 2 |
Top |
Cell-cell communication analysis |
| Identification of potential cell-cell interactions between two cell types and their ligand-receptor pairs for different disease states |
| Ligand | Receptor | LRpair | Pathway | Tissue | Disease Stage |
| Page: 1 |
Top |
Single-cell gene regulatory network inference analysis |
| Find out the significant the regulons (TFs) and the target genes of each regulon across cell types for different disease states |
| TF | Cell Type | Tissue | Disease Stage | Target Gene | RSS | Regulon Activity |
| ∗The dot plots of a searched regulon are shown for all cell subpopulations in each disease state of each tissue based on the regulon specific score inferred using pySCENIC and by calculating the average expression. |
| Page: 1 |
Top |
Somatic mutation of malignant transformation related genes |
| Annotation of somatic variants for genes involved in malignant transformation |
| Hugo Symbol | Variant Class | Variant Classification | dbSNP RS | HGVSc | HGVSp | HGVSp Short | SWISSPROT | BIOTYPE | SIFT | PolyPhen | Tumor Sample Barcode | Tissue | Histology | Sex | Age | Stage | Therapy Types | Drugs | Outcome |
| SMPD1 | SNV | Missense_Mutation | rs120074122 | c.730N>A | p.Gly244Arg | p.G244R | P17405 | protein_coding | deleterious(0) | probably_damaging(0.999) | TCGA-A2-A0T5-01 | Breast | breast invasive carcinoma | Female | <65 | I/II | Unspecific | Taxotere | SD |
| SMPD1 | SNV | Missense_Mutation | c.242G>C | p.Arg81Pro | p.R81P | P17405 | protein_coding | tolerated(0.11) | benign(0.009) | TCGA-AC-A2B8-01 | Breast | breast invasive carcinoma | Female | >=65 | I/II | Chemotherapy | chemo | PD | |
| SMPD1 | SNV | Missense_Mutation | novel | c.857N>G | p.Val286Gly | p.V286G | P17405 | protein_coding | deleterious(0) | probably_damaging(0.936) | TCGA-AQ-A04J-01 | Breast | breast invasive carcinoma | Female | <65 | I/II | Chemotherapy | cytoxan | SD |
| SMPD1 | insertion | In_Frame_Ins | novel | c.1118_1119insTCTATCTGAGATGATGTCCCCAGAACTGGGGGG | p.Pro373_Tyr374insLeuSerGluMetMetSerProGluLeuGlyGly | p.P373_Y374insLSEMMSPELGG | P17405 | protein_coding | TCGA-A2-A04Y-01 | Breast | breast invasive carcinoma | Female | <65 | I/II | Chemotherapy | cytoxan | SD | ||
| SMPD1 | SNV | Missense_Mutation | novel | c.299N>T | p.Ala100Val | p.A100V | P17405 | protein_coding | tolerated(0.98) | benign(0.003) | TCGA-2W-A8YY-01 | Cervix | cervical & endocervical cancer | Female | <65 | I/II | Chemotherapy | cisplatin | CR |
| SMPD1 | SNV | Missense_Mutation | novel | c.1616N>G | p.Tyr539Cys | p.Y539C | P17405 | protein_coding | deleterious(0) | probably_damaging(1) | TCGA-2W-A8YY-01 | Cervix | cervical & endocervical cancer | Female | <65 | I/II | Chemotherapy | cisplatin | CR |
| SMPD1 | SNV | Missense_Mutation | novel | c.1627N>C | p.Glu543Gln | p.E543Q | P17405 | protein_coding | tolerated(0.14) | possibly_damaging(0.535) | TCGA-C5-A7CH-01 | Cervix | cervical & endocervical cancer | Female | <65 | I/II | Unspecific | SD | |
| SMPD1 | SNV | Missense_Mutation | c.357N>G | p.Ile119Met | p.I119M | P17405 | protein_coding | tolerated(0.21) | benign(0.402) | TCGA-JW-A5VL-01 | Cervix | cervical & endocervical cancer | Female | <65 | I/II | Unknown | Unknown | SD | |
| SMPD1 | SNV | Missense_Mutation | novel | c.1283T>C | p.Ile428Thr | p.I428T | P17405 | protein_coding | deleterious(0) | probably_damaging(0.984) | TCGA-VS-A94Z-01 | Cervix | cervical & endocervical cancer | Female | <65 | I/II | Chemotherapy | cisplatin | CR |
| SMPD1 | SNV | Missense_Mutation | rs373508268 | c.1037N>T | p.Ala346Val | p.A346V | P17405 | protein_coding | tolerated(0.06) | possibly_damaging(0.721) | TCGA-AA-3492-01 | Colorectum | colon adenocarcinoma | Female | >=65 | I/II | Unknown | Unknown | SD |
| Page: 1 2 3 4 5 6 7 |
Top |
Related drugs of malignant transformation related genes |
| Identification of chemicals and drugs interact with genes involved in malignant transfromation |
| (DGIdb 4.0) |
| Entrez ID | Symbol | Category | Interaction Types | Drug Claim Name | Drug Name | PMIDs |
| 6609 | SMPD1 | ENZYME, DRUGGABLE GENOME | inhibitor | 404859087 | ||
| 6609 | SMPD1 | ENZYME, DRUGGABLE GENOME | inhibitor | 404859086 | ||
| 6609 | SMPD1 | ENZYME, DRUGGABLE GENOME | AMIODARONE HYDROCHLORIDE | AMIODARONE HYDROCHLORIDE | ||
| 6609 | SMPD1 | ENZYME, DRUGGABLE GENOME | ETIDRONIC ACID | ETIDRONIC ACID |
| Page: 1 |

Copyright 2023-Present -The University of Texas Health Science Center at Houston |