| Tissue | Expression Dynamics | Abbreviation |
| Esophagus | 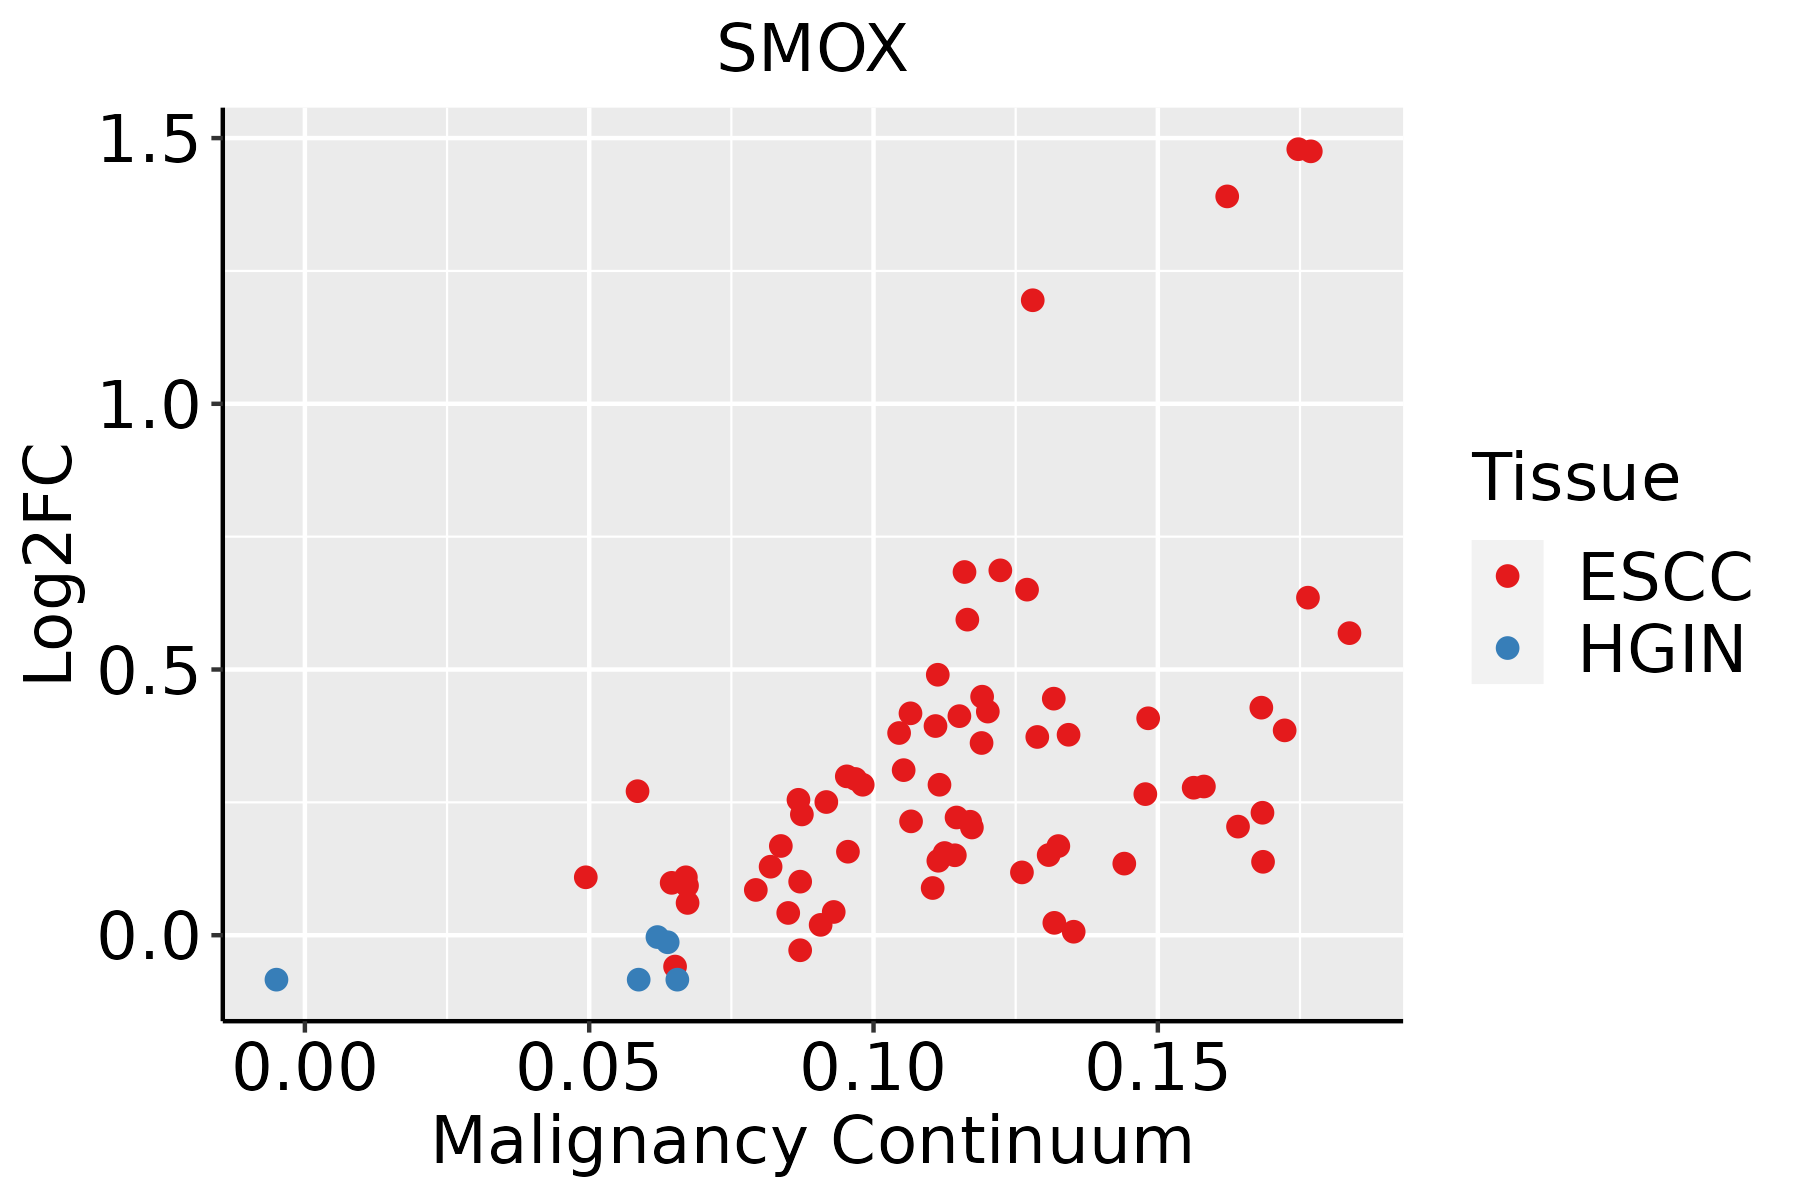 | ESCC: Esophageal squamous cell carcinoma |
| HGIN: High-grade intraepithelial neoplasias |
| LGIN: Low-grade intraepithelial neoplasias |
| Liver | 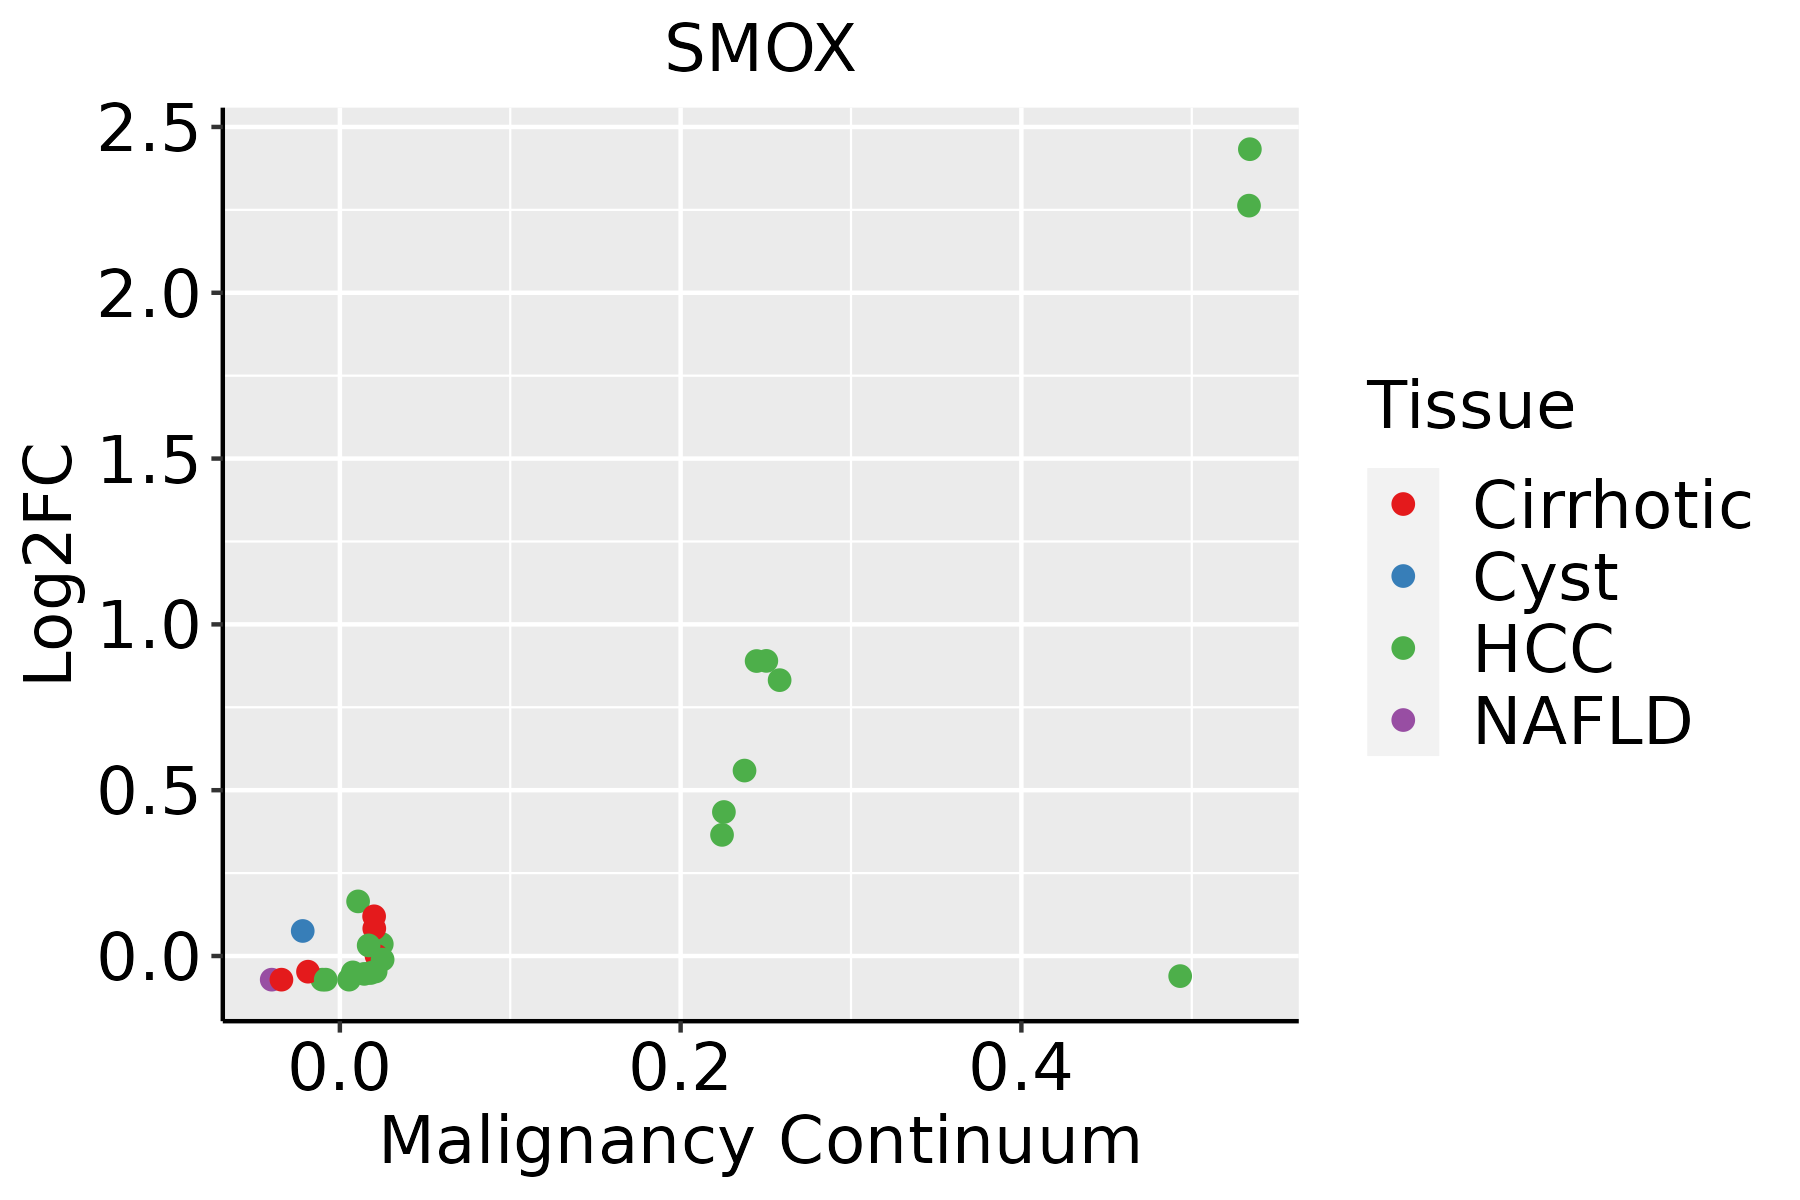 | HCC: Hepatocellular carcinoma |
| NAFLD: Non-alcoholic fatty liver disease |
| Oral Cavity | 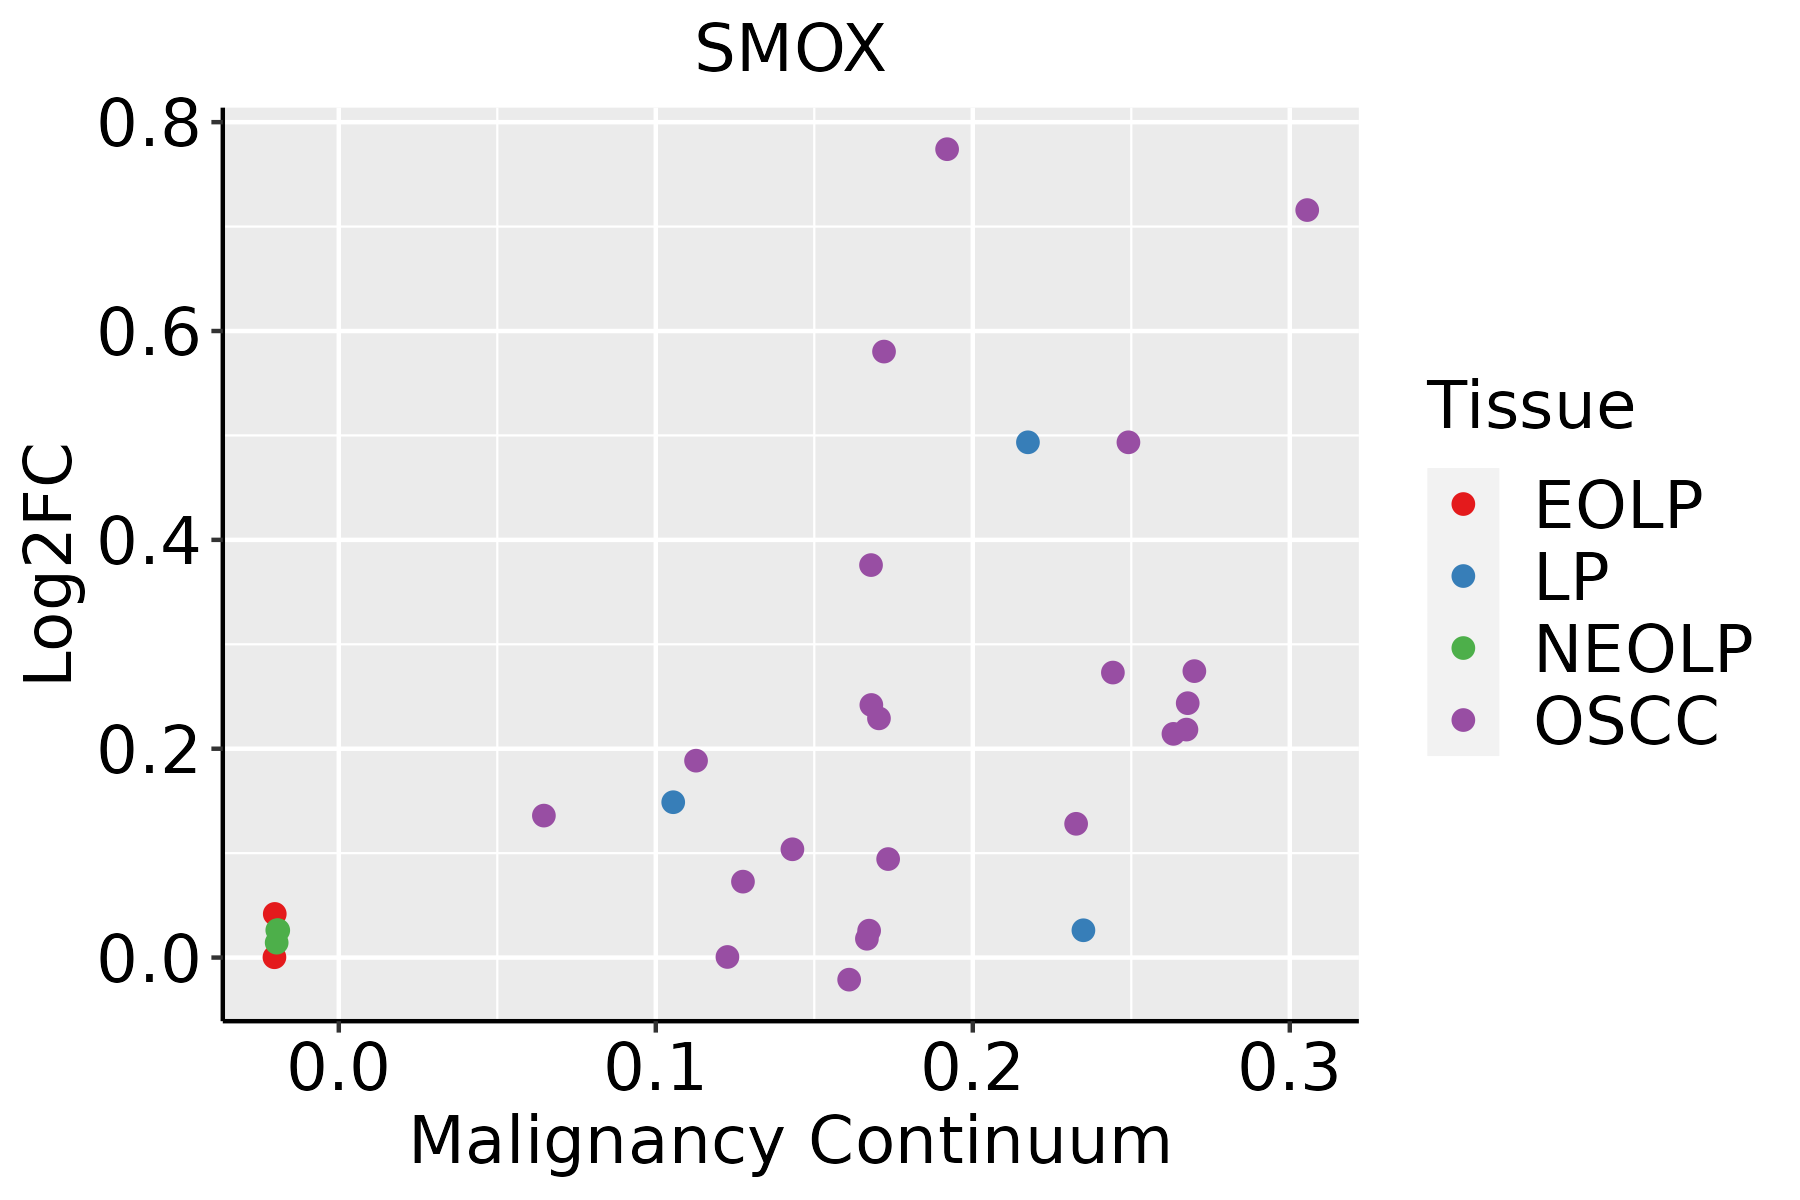 | EOLP: Erosive Oral lichen planus |
| LP: leukoplakia |
| NEOLP: Non-erosive oral lichen planus |
| OSCC: Oral squamous cell carcinoma |
| Prostate | 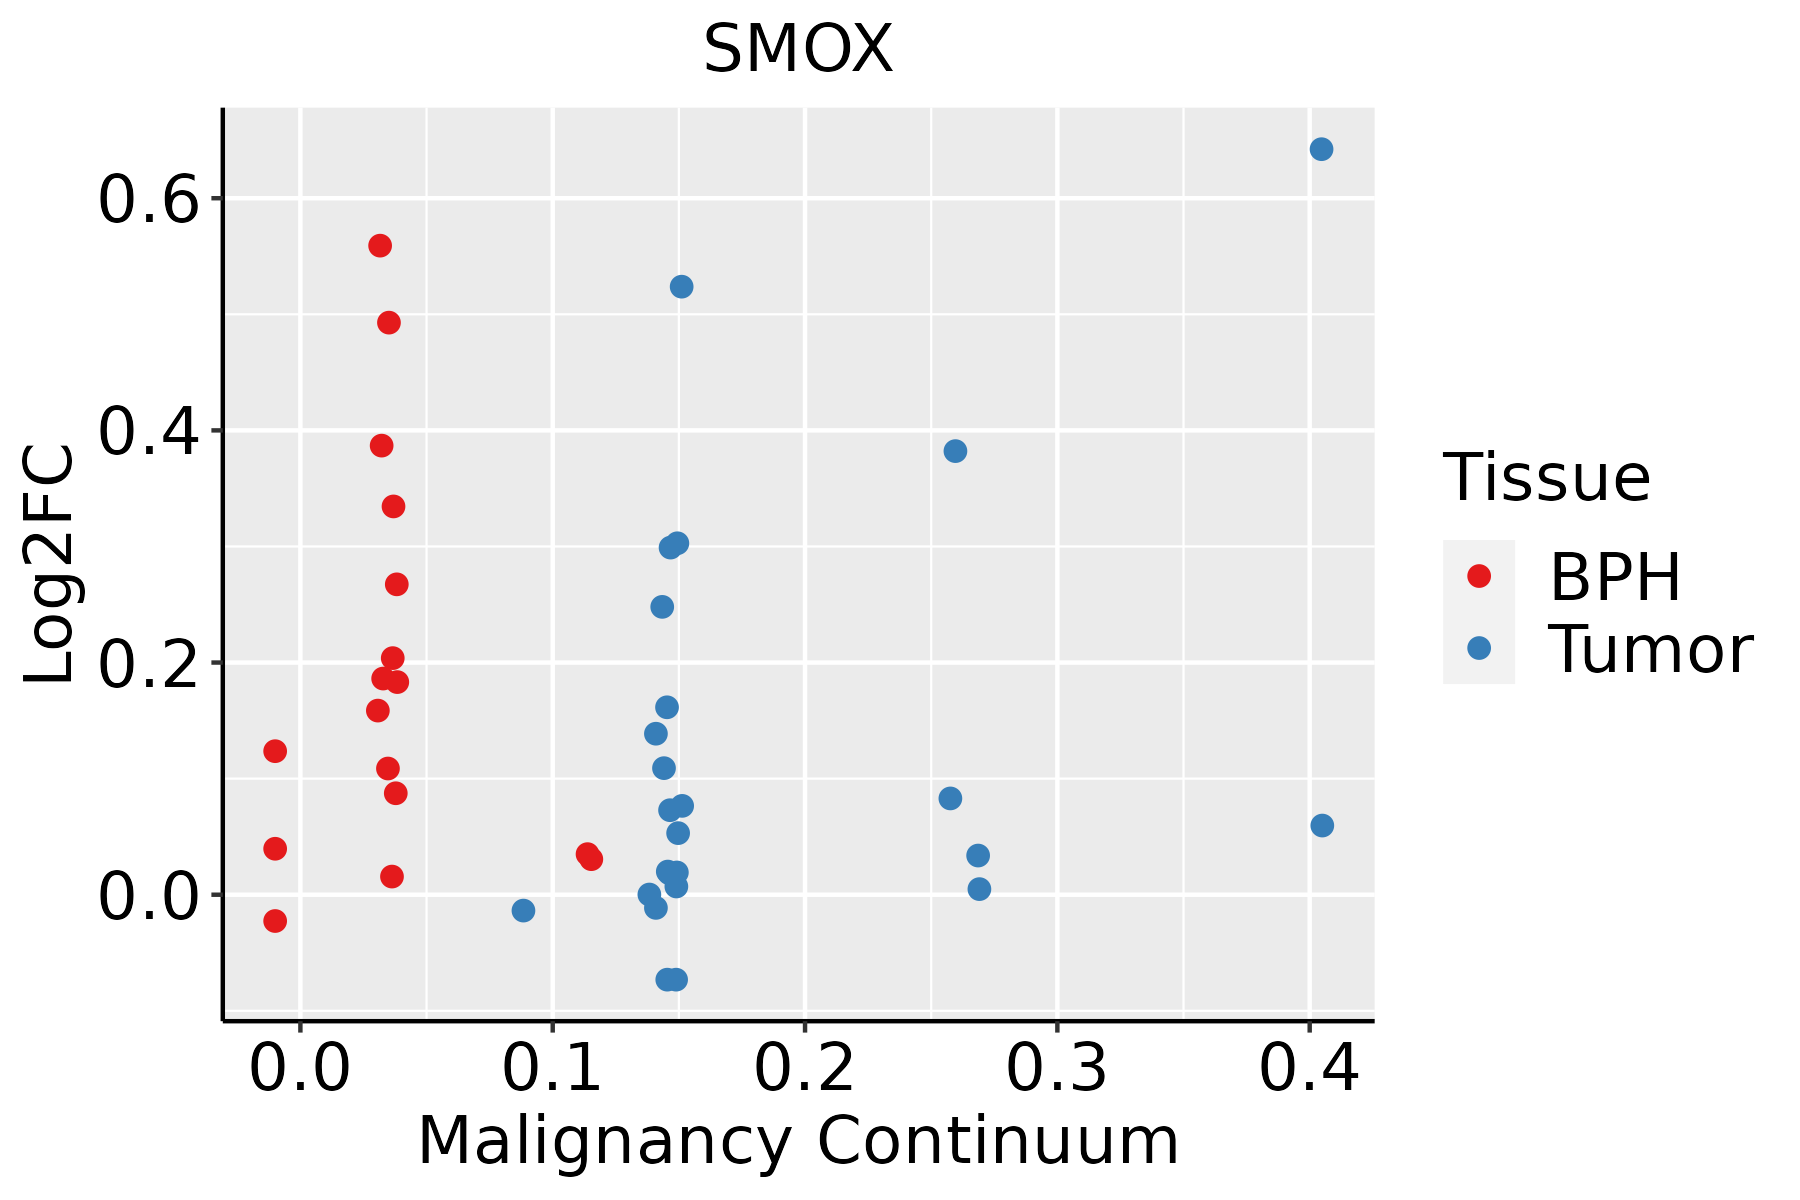 | BPH: Benign Prostatic Hyperplasia |
| GO ID | Tissue | Disease Stage | Description | Gene Ratio | Bg Ratio | pvalue | p.adjust | Count |
| GO:000941020 | Esophagus | ESCC | response to xenobiotic stimulus | 253/8552 | 462/18723 | 4.55e-05 | 3.58e-04 | 253 |
| GO:000941012 | Liver | Cirrhotic | response to xenobiotic stimulus | 165/4634 | 462/18723 | 6.82e-08 | 2.09e-06 | 165 |
| GO:00714661 | Liver | Cirrhotic | cellular response to xenobiotic stimulus | 66/4634 | 177/18723 | 1.34e-04 | 1.31e-03 | 66 |
| GO:0006595 | Liver | Cirrhotic | polyamine metabolic process | 12/4634 | 18/18723 | 2.07e-04 | 1.90e-03 | 12 |
| GO:00065962 | Liver | Cirrhotic | polyamine biosynthetic process | 10/4634 | 14/18723 | 3.11e-04 | 2.72e-03 | 10 |
| GO:00424021 | Liver | Cirrhotic | cellular biogenic amine catabolic process | 15/4634 | 27/18723 | 5.96e-04 | 4.63e-03 | 15 |
| GO:000680511 | Liver | Cirrhotic | xenobiotic metabolic process | 43/4634 | 111/18723 | 7.51e-04 | 5.54e-03 | 43 |
| GO:0044106 | Liver | Cirrhotic | cellular amine metabolic process | 43/4634 | 113/18723 | 1.15e-03 | 7.83e-03 | 43 |
| GO:00093101 | Liver | Cirrhotic | amine catabolic process | 15/4634 | 29/18723 | 1.59e-03 | 1.03e-02 | 15 |
| GO:0006576 | Liver | Cirrhotic | cellular biogenic amine metabolic process | 38/4634 | 101/18723 | 2.72e-03 | 1.59e-02 | 38 |
| GO:0009308 | Liver | Cirrhotic | amine metabolic process | 43/4634 | 118/18723 | 3.03e-03 | 1.72e-02 | 43 |
| GO:000941022 | Liver | HCC | response to xenobiotic stimulus | 248/7958 | 462/18723 | 6.47e-07 | 1.02e-05 | 248 |
| GO:00065961 | Liver | HCC | polyamine biosynthetic process | 12/7958 | 14/18723 | 1.17e-03 | 6.54e-03 | 12 |
| GO:00065951 | Liver | HCC | polyamine metabolic process | 14/7958 | 18/18723 | 2.57e-03 | 1.23e-02 | 14 |
| GO:00714662 | Liver | HCC | cellular response to xenobiotic stimulus | 93/7958 | 177/18723 | 4.35e-03 | 1.89e-02 | 93 |
| GO:000941018 | Oral cavity | OSCC | response to xenobiotic stimulus | 222/7305 | 462/18723 | 4.00e-05 | 3.48e-04 | 222 |
| GO:00065954 | Oral cavity | OSCC | polyamine metabolic process | 13/7305 | 18/18723 | 4.45e-03 | 1.79e-02 | 13 |
| GO:00065965 | Oral cavity | OSCC | polyamine biosynthetic process | 10/7305 | 14/18723 | 1.44e-02 | 4.69e-02 | 10 |
| GO:000659512 | Oral cavity | LP | polyamine metabolic process | 13/4623 | 18/18723 | 2.94e-05 | 4.58e-04 | 13 |
| GO:000659612 | Oral cavity | LP | polyamine biosynthetic process | 10/4623 | 14/18723 | 3.05e-04 | 3.12e-03 | 10 |
| Pathway ID | Tissue | Disease Stage | Description | Gene Ratio | Bg Ratio | pvalue | p.adjust | qvalue | Count |
| hsa00410 | Liver | Cirrhotic | beta-Alanine metabolism | 18/2530 | 31/8465 | 1.00e-03 | 5.57e-03 | 3.43e-03 | 18 |
| hsa003308 | Liver | Cirrhotic | Arginine and proline metabolism | 25/2530 | 50/8465 | 2.18e-03 | 9.41e-03 | 5.80e-03 | 25 |
| hsa004101 | Liver | Cirrhotic | beta-Alanine metabolism | 18/2530 | 31/8465 | 1.00e-03 | 5.57e-03 | 3.43e-03 | 18 |
| hsa0033011 | Liver | Cirrhotic | Arginine and proline metabolism | 25/2530 | 50/8465 | 2.18e-03 | 9.41e-03 | 5.80e-03 | 25 |
| hsa0033021 | Liver | HCC | Arginine and proline metabolism | 33/4020 | 50/8465 | 6.28e-03 | 1.77e-02 | 9.83e-03 | 33 |
| hsa004102 | Liver | HCC | beta-Alanine metabolism | 22/4020 | 31/8465 | 6.93e-03 | 1.92e-02 | 1.07e-02 | 22 |
| hsa0033031 | Liver | HCC | Arginine and proline metabolism | 33/4020 | 50/8465 | 6.28e-03 | 1.77e-02 | 9.83e-03 | 33 |
| hsa004103 | Liver | HCC | beta-Alanine metabolism | 22/4020 | 31/8465 | 6.93e-03 | 1.92e-02 | 1.07e-02 | 22 |
| hsa0033010 | Oral cavity | OSCC | Arginine and proline metabolism | 30/3704 | 50/8465 | 1.50e-02 | 3.26e-02 | 1.66e-02 | 30 |
| hsa0033013 | Oral cavity | OSCC | Arginine and proline metabolism | 30/3704 | 50/8465 | 1.50e-02 | 3.26e-02 | 1.66e-02 | 30 |
| hsa0033023 | Oral cavity | LP | Arginine and proline metabolism | 26/2418 | 50/8465 | 3.94e-04 | 2.08e-03 | 1.34e-03 | 26 |
| hsa0033033 | Oral cavity | LP | Arginine and proline metabolism | 26/2418 | 50/8465 | 3.94e-04 | 2.08e-03 | 1.34e-03 | 26 |
| hsa003309 | Prostate | BPH | Arginine and proline metabolism | 18/1718 | 50/8465 | 7.17e-03 | 2.32e-02 | 1.43e-02 | 18 |
| hsa0033012 | Prostate | BPH | Arginine and proline metabolism | 18/1718 | 50/8465 | 7.17e-03 | 2.32e-02 | 1.43e-02 | 18 |
| hsa0033022 | Prostate | Tumor | Arginine and proline metabolism | 19/1791 | 50/8465 | 4.73e-03 | 1.67e-02 | 1.03e-02 | 19 |
| hsa004104 | Prostate | Tumor | beta-Alanine metabolism | 13/1791 | 31/8465 | 7.13e-03 | 2.34e-02 | 1.45e-02 | 13 |
| hsa0033032 | Prostate | Tumor | Arginine and proline metabolism | 19/1791 | 50/8465 | 4.73e-03 | 1.67e-02 | 1.03e-02 | 19 |
| hsa0041011 | Prostate | Tumor | beta-Alanine metabolism | 13/1791 | 31/8465 | 7.13e-03 | 2.34e-02 | 1.45e-02 | 13 |
| Hugo Symbol | Variant Class | Variant Classification | dbSNP RS | HGVSc | HGVSp | HGVSp Short | SWISSPROT | BIOTYPE | SIFT | PolyPhen | Tumor Sample Barcode | Tissue | Histology | Sex | Age | Stage | Therapy Types | Drugs | Outcome |
| SMOX | SNV | Missense_Mutation | rs775564398 | c.1591N>A | p.Pro531Thr | p.P531T | Q9NWM0 | protein_coding | deleterious_low_confidence(0.04) | benign(0.003) | TCGA-AQ-A1H2-01 | Breast | breast invasive carcinoma | Female | >=65 | III/IV | Chemotherapy | herceptin | SD |
| SMOX | SNV | Missense_Mutation | rs775564398 | c.1591N>A | p.Pro531Thr | p.P531T | Q9NWM0 | protein_coding | deleterious_low_confidence(0.04) | benign(0.003) | TCGA-AR-A24P-01 | Breast | breast invasive carcinoma | Female | <65 | I/II | Unknown | Unknown | SD |
| SMOX | SNV | Missense_Mutation | rs375716040 | c.358N>A | p.Val120Met | p.V120M | Q9NWM0 | protein_coding | tolerated(0.06) | probably_damaging(0.999) | TCGA-EW-A2FV-01 | Breast | breast invasive carcinoma | Female | <65 | III/IV | Chemotherapy | docetaxel | SD |
| SMOX | insertion | In_Frame_Ins | novel | c.1341_1342insCTCCAGCGA | p.Ile447_Cys448insLeuGlnArg | p.I447_C448insLQR | Q9NWM0 | protein_coding | | | TCGA-A8-A07U-01 | Breast | breast invasive carcinoma | Female | >=65 | III/IV | Chemotherapy | 5-fluorouracil | SD |
| SMOX | insertion | Frame_Shift_Ins | novel | c.1344_1345insCAGGGCCTTGGATCAAGTCC | p.Thr449GlnfsTer98 | p.T449Qfs*98 | Q9NWM0 | protein_coding | | | TCGA-A8-A07U-01 | Breast | breast invasive carcinoma | Female | >=65 | III/IV | Chemotherapy | 5-fluorouracil | SD |
| SMOX | SNV | Missense_Mutation | rs370515510 | c.386N>A | p.Arg129His | p.R129H | Q9NWM0 | protein_coding | tolerated(0.11) | benign(0) | TCGA-2W-A8YY-01 | Cervix | cervical & endocervical cancer | Female | <65 | I/II | Chemotherapy | cisplatin | CR |
| SMOX | SNV | Missense_Mutation | novel | c.1138N>A | p.Glu380Lys | p.E380K | Q9NWM0 | protein_coding | deleterious(0.01) | benign(0.423) | TCGA-2W-A8YY-01 | Cervix | cervical & endocervical cancer | Female | <65 | I/II | Chemotherapy | cisplatin | CR |
| SMOX | SNV | Missense_Mutation | | c.59N>A | p.Arg20Gln | p.R20Q | Q9NWM0 | protein_coding | deleterious(0.04) | benign(0.375) | TCGA-C5-A3HF-01 | Cervix | cervical & endocervical cancer | Female | <65 | I/II | Unknown | Unknown | PD |
| SMOX | SNV | Missense_Mutation | rs752255111 | c.809N>T | p.Ser270Leu | p.S270L | Q9NWM0 | protein_coding | tolerated(0.65) | benign(0.097) | TCGA-IR-A3LK-01 | Cervix | cervical & endocervical cancer | Female | >=65 | I/II | Chemotherapy | cisplatin | PD |
| SMOX | SNV | Missense_Mutation | novel | c.290N>A | p.Gly97Asp | p.G97D | Q9NWM0 | protein_coding | tolerated(0.06) | probably_damaging(0.997) | TCGA-MA-AA42-01 | Cervix | cervical & endocervical cancer | Female | >=65 | I/II | Unknown | Unknown | SD |


