
|
|||||
|
 | |
| |
| |
| |
| |
| |
|
Gene: SMOC1 |
Gene summary for SMOC1 |
| Gene information | Species | Human | Gene symbol | SMOC1 | Gene ID | 64093 |
| Gene name | SPARC related modular calcium binding 1 | |
| Gene Alias | OAS | |
| Cytomap | 14q24.2 | |
| Gene Type | protein-coding | GO ID | GO:0001503 | UniProtAcc | Q9H4F8 |
Top |
Malignant transformation analysis |
| Identification of the aberrant gene expression in precancerous and cancerous lesions by comparing the gene expression of stem-like cells in diseased tissues with normal stem cells |
| Entrez ID | Symbol | Replicates | Species | Organ | Tissue | Adj P-value | Log2FC | Malignancy |
| 64093 | SMOC1 | sample1 | Human | Cervix | CC | 2.80e-20 | 5.54e-01 | 0.0959 |
| 64093 | SMOC1 | T1 | Human | Cervix | CC | 8.23e-30 | 5.44e-01 | 0.0918 |
| 64093 | SMOC1 | HTA11_347_2000001011 | Human | Colorectum | AD | 3.40e-02 | 1.15e-01 | -0.1954 |
| 64093 | SMOC1 | HTA11_696_2000001011 | Human | Colorectum | AD | 1.55e-02 | 1.03e-01 | -0.1464 |
| 64093 | SMOC1 | HTA11_1391_2000001011 | Human | Colorectum | AD | 1.69e-02 | 1.53e-01 | -0.059 |
| 64093 | SMOC1 | HTA11_8622_2000001021 | Human | Colorectum | SER | 4.87e-02 | 2.02e-01 | 0.0528 |
| 64093 | SMOC1 | HTA11_99999970781_79442 | Human | Colorectum | MSS | 3.34e-03 | 1.25e-01 | 0.294 |
| 64093 | SMOC1 | HTA11_99999965062_69753 | Human | Colorectum | MSI-H | 9.17e-04 | 5.33e-01 | 0.3487 |
| 64093 | SMOC1 | HTA11_99999965104_69814 | Human | Colorectum | MSS | 1.86e-52 | 1.70e+00 | 0.281 |
| 64093 | SMOC1 | HTA11_99999971662_82457 | Human | Colorectum | MSS | 3.60e-03 | 1.36e-01 | 0.3859 |
| 64093 | SMOC1 | HTA11_99999974143_84620 | Human | Colorectum | MSS | 4.68e-21 | 5.08e-01 | 0.3005 |
| 64093 | SMOC1 | LZE4T | Human | Esophagus | ESCC | 1.20e-04 | 2.27e-01 | 0.0811 |
| 64093 | SMOC1 | LZE6T | Human | Esophagus | ESCC | 1.55e-08 | 6.46e-01 | 0.0845 |
| 64093 | SMOC1 | P19T-E | Human | Esophagus | ESCC | 2.24e-09 | 1.54e+00 | 0.1662 |
| 64093 | SMOC1 | P37T-E | Human | Esophagus | ESCC | 2.31e-05 | 1.34e-01 | 0.1371 |
| 64093 | SMOC1 | P76T-E | Human | Esophagus | ESCC | 7.52e-23 | 6.84e-01 | 0.1207 |
| 64093 | SMOC1 | P79T-E | Human | Esophagus | ESCC | 4.17e-05 | 1.21e-01 | 0.1154 |
| 64093 | SMOC1 | P107T-E | Human | Esophagus | ESCC | 5.64e-49 | 1.40e+00 | 0.171 |
| 64093 | SMOC1 | NAFLD1 | Human | Liver | NAFLD | 6.88e-16 | 1.16e+00 | -0.04 |
| 64093 | SMOC1 | S43 | Human | Liver | Cirrhotic | 6.67e-04 | -1.69e-01 | -0.0187 |
| Page: 1 2 |
| Tissue | Expression Dynamics | Abbreviation |
| Cervix | 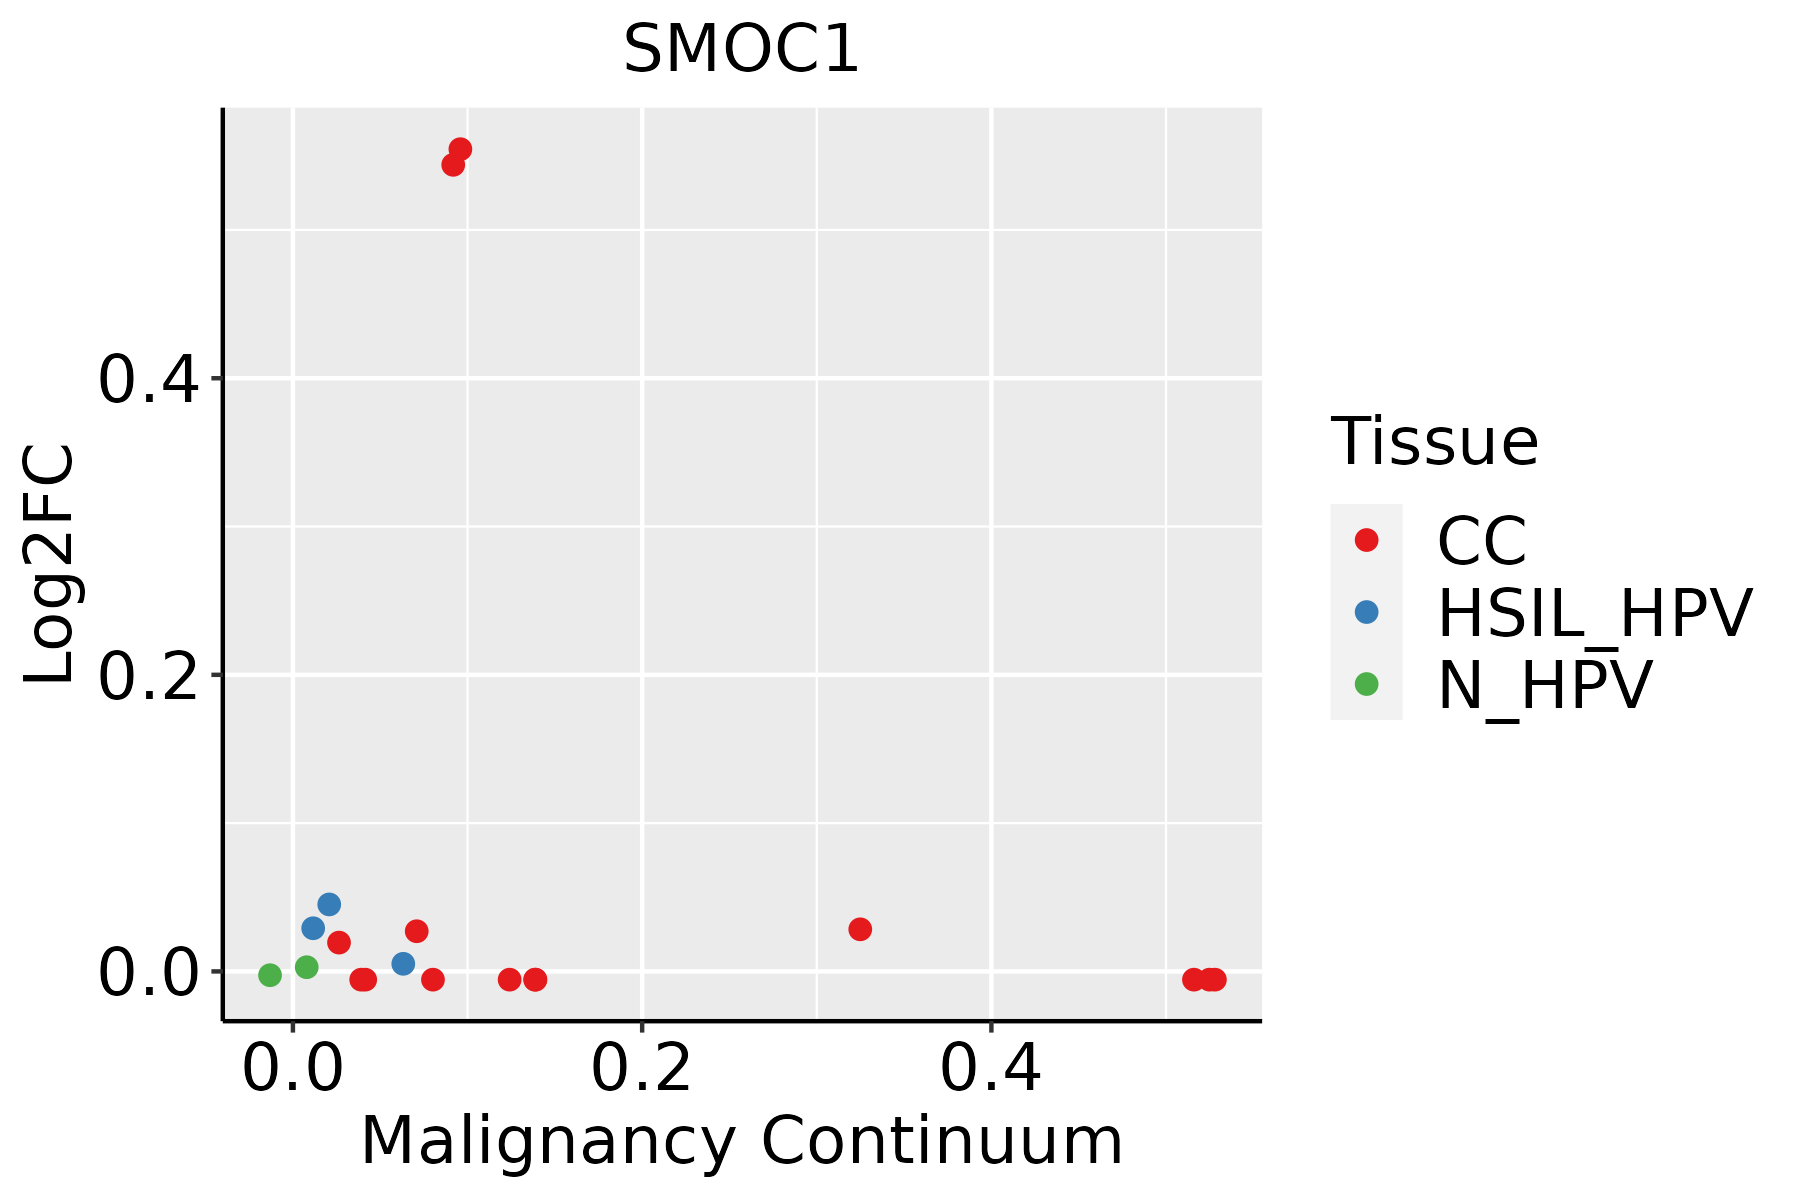 | CC: Cervix cancer |
| HSIL_HPV: HPV-infected high-grade squamous intraepithelial lesions | ||
| N_HPV: HPV-infected normal cervix | ||
| Colorectum (GSE201348) |  | FAP: Familial adenomatous polyposis |
| CRC: Colorectal cancer | ||
| Colorectum (HTA11) |  | AD: Adenomas |
| SER: Sessile serrated lesions | ||
| MSI-H: Microsatellite-high colorectal cancer | ||
| MSS: Microsatellite stable colorectal cancer | ||
| Esophagus |  | ESCC: Esophageal squamous cell carcinoma |
| HGIN: High-grade intraepithelial neoplasias | ||
| LGIN: Low-grade intraepithelial neoplasias | ||
| Liver | 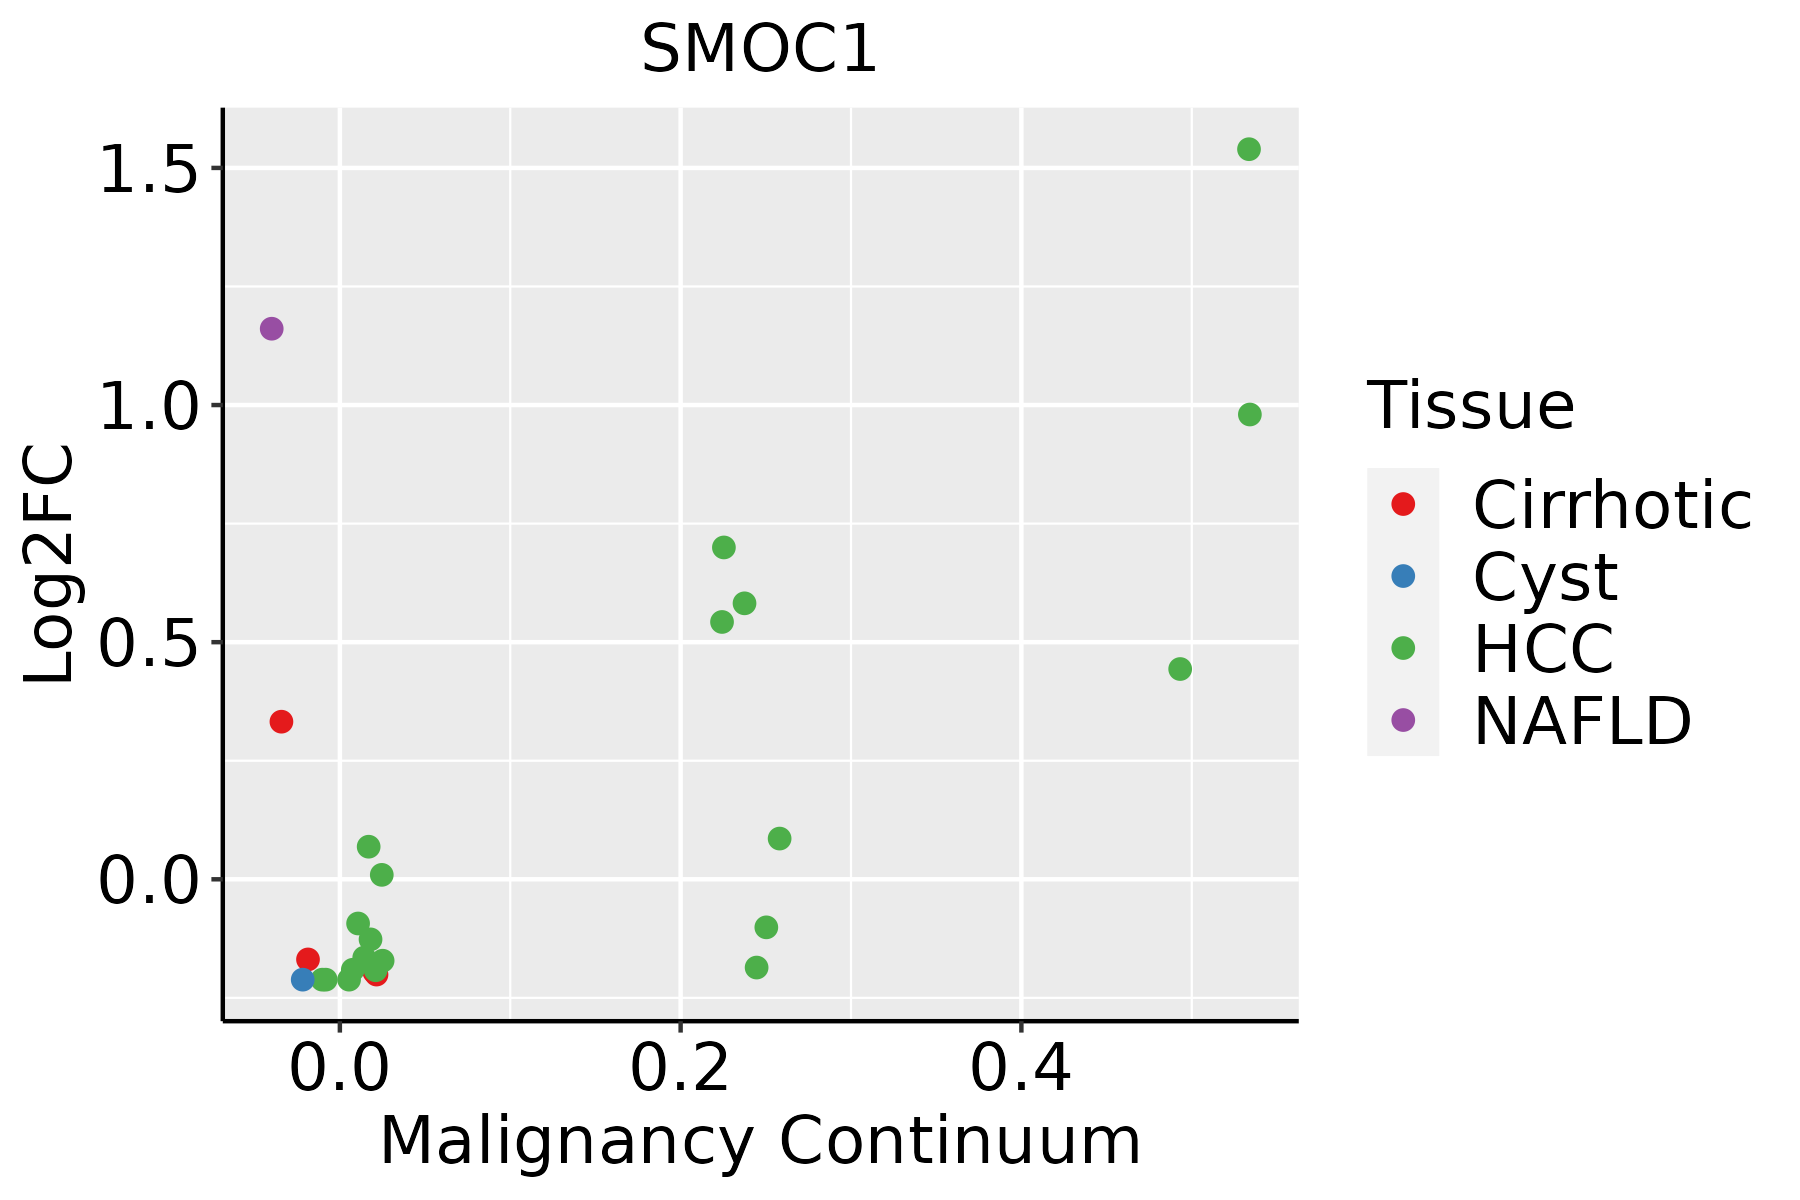 | HCC: Hepatocellular carcinoma |
| NAFLD: Non-alcoholic fatty liver disease |
| ∗log2FC in expression of this searched gene in stem-like cells from each diseased tissue sample relative to stem-like cells in normal samples in each tissue plotted against the malignancy continuum. Samples are colored based on if they are from different disease stage. |
Top |
Malignant transformation related pathway analysis |
| Find out the enriched GO biological processes and KEGG pathways involved in transition from healthy to precancer to cancer |
| Tissue | Disease Stage | Enriched GO biological Processes |
| Colorectum | AD |  |
| Colorectum | SER |  |
| Colorectum | MSS |  |
| Colorectum | MSI-H |  |
| Colorectum | FAP |  |
| ∗Top 15 enriched GO BP terms are showed in the bar plot of each disease state in each tissue. Each row represents a significant GO biological process which is colored according to the -log10(p.adjust). |
| Page: 1 2 3 4 5 6 7 8 9 |
| GO ID | Tissue | Disease Stage | Description | Gene Ratio | Bg Ratio | pvalue | p.adjust | Count |
| GO:00016497 | Cervix | CC | osteoblast differentiation | 47/2311 | 229/18723 | 2.88e-04 | 3.11e-03 | 47 |
| GO:0045667 | Cervix | CC | regulation of osteoblast differentiation | 29/2311 | 132/18723 | 1.32e-03 | 1.05e-02 | 29 |
| GO:00015037 | Cervix | CC | ossification | 71/2311 | 408/18723 | 1.67e-03 | 1.28e-02 | 71 |
| GO:00487365 | Cervix | CC | appendage development | 35/2311 | 172/18723 | 1.88e-03 | 1.39e-02 | 35 |
| GO:00601735 | Cervix | CC | limb development | 35/2311 | 172/18723 | 1.88e-03 | 1.39e-02 | 35 |
| GO:0150063 | Cervix | CC | visual system development | 63/2311 | 375/18723 | 6.58e-03 | 3.65e-02 | 63 |
| GO:0030198 | Cervix | CC | extracellular matrix organization | 52/2311 | 301/18723 | 7.43e-03 | 3.98e-02 | 52 |
| GO:0001654 | Cervix | CC | eye development | 62/2311 | 371/18723 | 7.83e-03 | 4.13e-02 | 62 |
| GO:0043062 | Cervix | CC | extracellular structure organization | 52/2311 | 302/18723 | 7.92e-03 | 4.17e-02 | 52 |
| GO:0045229 | Cervix | CC | external encapsulating structure organization | 52/2311 | 304/18723 | 9.00e-03 | 4.57e-02 | 52 |
| GO:0048880 | Cervix | CC | sensory system development | 63/2311 | 381/18723 | 9.29e-03 | 4.66e-02 | 63 |
| GO:0001649 | Colorectum | AD | osteoblast differentiation | 70/3918 | 229/18723 | 3.59e-04 | 4.18e-03 | 70 |
| GO:0048736 | Colorectum | AD | appendage development | 51/3918 | 172/18723 | 4.20e-03 | 2.89e-02 | 51 |
| GO:0060173 | Colorectum | AD | limb development | 51/3918 | 172/18723 | 4.20e-03 | 2.89e-02 | 51 |
| GO:0001503 | Colorectum | AD | ossification | 106/3918 | 408/18723 | 7.68e-03 | 4.64e-02 | 106 |
| GO:00016491 | Colorectum | SER | osteoblast differentiation | 56/2897 | 229/18723 | 2.49e-04 | 4.21e-03 | 56 |
| GO:00487361 | Colorectum | SER | appendage development | 42/2897 | 172/18723 | 1.43e-03 | 1.55e-02 | 42 |
| GO:00601731 | Colorectum | SER | limb development | 42/2897 | 172/18723 | 1.43e-03 | 1.55e-02 | 42 |
| GO:00015031 | Colorectum | SER | ossification | 82/2897 | 408/18723 | 6.76e-03 | 4.78e-02 | 82 |
| GO:00016492 | Colorectum | MSS | osteoblast differentiation | 64/3467 | 229/18723 | 2.91e-04 | 3.83e-03 | 64 |
| Page: 1 2 |
| Pathway ID | Tissue | Disease Stage | Description | Gene Ratio | Bg Ratio | pvalue | p.adjust | qvalue | Count |
| Page: 1 |
Top |
Cell-cell communication analysis |
| Identification of potential cell-cell interactions between two cell types and their ligand-receptor pairs for different disease states |
| Ligand | Receptor | LRpair | Pathway | Tissue | Disease Stage |
| Page: 1 |
Top |
Single-cell gene regulatory network inference analysis |
| Find out the significant the regulons (TFs) and the target genes of each regulon across cell types for different disease states |
| TF | Cell Type | Tissue | Disease Stage | Target Gene | RSS | Regulon Activity |
| ∗The dot plots of a searched regulon are shown for all cell subpopulations in each disease state of each tissue based on the regulon specific score inferred using pySCENIC and by calculating the average expression. |
| Page: 1 |
Top |
Somatic mutation of malignant transformation related genes |
| Annotation of somatic variants for genes involved in malignant transformation |
| Hugo Symbol | Variant Class | Variant Classification | dbSNP RS | HGVSc | HGVSp | HGVSp Short | SWISSPROT | BIOTYPE | SIFT | PolyPhen | Tumor Sample Barcode | Tissue | Histology | Sex | Age | Stage | Therapy Types | Drugs | Outcome |
| SMOC1 | SNV | Missense_Mutation | c.235N>A | p.Leu79Met | p.L79M | Q9H4F8 | protein_coding | deleterious(0) | probably_damaging(0.989) | TCGA-2W-A8YY-01 | Cervix | cervical & endocervical cancer | Female | <65 | I/II | Chemotherapy | cisplatin | CR | |
| SMOC1 | SNV | Missense_Mutation | c.1194G>T | p.Lys398Asn | p.K398N | Q9H4F8 | protein_coding | deleterious(0) | probably_damaging(1) | TCGA-AA-3977-01 | Colorectum | colon adenocarcinoma | Male | >=65 | I/II | Unknown | Unknown | SD | |
| SMOC1 | SNV | Missense_Mutation | rs759730772 | c.677N>T | p.Ser226Leu | p.S226L | Q9H4F8 | protein_coding | deleterious(0) | probably_damaging(0.995) | TCGA-AA-A00N-01 | Colorectum | colon adenocarcinoma | Male | >=65 | I/II | Unknown | Unknown | PD |
| SMOC1 | SNV | Missense_Mutation | rs376548937 | c.212N>A | p.Arg71Gln | p.R71Q | Q9H4F8 | protein_coding | deleterious(0.01) | possibly_damaging(0.891) | TCGA-CA-6718-01 | Colorectum | colon adenocarcinoma | Male | <65 | I/II | Unknown | Unknown | PD |
| SMOC1 | SNV | Missense_Mutation | rs769420307 | c.862N>A | p.Val288Met | p.V288M | Q9H4F8 | protein_coding | deleterious(0.04) | benign(0.397) | TCGA-D5-6530-01 | Colorectum | colon adenocarcinoma | Male | <65 | I/II | Unknown | Unknown | SD |
| SMOC1 | SNV | Missense_Mutation | rs745832952 | c.286N>T | p.Arg96Cys | p.R96C | Q9H4F8 | protein_coding | tolerated(0.19) | probably_damaging(0.931) | TCGA-DM-A1D6-01 | Colorectum | colon adenocarcinoma | Male | >=65 | I/II | Unknown | Unknown | SD |
| SMOC1 | SNV | Missense_Mutation | novel | c.316G>T | p.Ala106Ser | p.A106S | Q9H4F8 | protein_coding | tolerated(0.16) | possibly_damaging(0.901) | TCGA-A5-A0G1-01 | Endometrium | uterine corpus endometrioid carcinoma | Female | >=65 | I/II | Unknown | Unknown | SD |
| SMOC1 | SNV | Missense_Mutation | novel | c.470T>C | p.Val157Ala | p.V157A | Q9H4F8 | protein_coding | tolerated(0.75) | possibly_damaging(0.712) | TCGA-A5-A0G1-01 | Endometrium | uterine corpus endometrioid carcinoma | Female | >=65 | I/II | Unknown | Unknown | SD |
| SMOC1 | SNV | Missense_Mutation | novel | c.1193A>C | p.Lys398Thr | p.K398T | Q9H4F8 | protein_coding | deleterious(0) | probably_damaging(1) | TCGA-A5-A0G2-01 | Endometrium | uterine corpus endometrioid carcinoma | Female | <65 | III/IV | Unknown | Unknown | SD |
| SMOC1 | SNV | Missense_Mutation | c.503G>A | p.Ser168Asn | p.S168N | Q9H4F8 | protein_coding | tolerated(0.64) | benign(0.066) | TCGA-AP-A056-01 | Endometrium | uterine corpus endometrioid carcinoma | Female | <65 | I/II | Unknown | Unknown | SD |
| Page: 1 2 3 4 5 |
Top |
Related drugs of malignant transformation related genes |
| Identification of chemicals and drugs interact with genes involved in malignant transfromation |
| (DGIdb 4.0) |
| Entrez ID | Symbol | Category | Interaction Types | Drug Claim Name | Drug Name | PMIDs |
| Page: 1 |

Copyright 2023-Present -The University of Texas Health Science Center at Houston |