
|
|||||
|
 | |
| |
| |
| |
| |
| |
|
Gene: SMNDC1 |
Gene summary for SMNDC1 |
| Gene information | Species | Human | Gene symbol | SMNDC1 | Gene ID | 10285 |
| Gene name | survival motor neuron domain containing 1 | |
| Gene Alias | SMNR | |
| Cytomap | 10q25.2 | |
| Gene Type | protein-coding | GO ID | GO:0000375 | UniProtAcc | O75940 |
Top |
Malignant transformation analysis |
| Identification of the aberrant gene expression in precancerous and cancerous lesions by comparing the gene expression of stem-like cells in diseased tissues with normal stem cells |
| Entrez ID | Symbol | Replicates | Species | Organ | Tissue | Adj P-value | Log2FC | Malignancy |
| 10285 | SMNDC1 | LZE2T | Human | Esophagus | ESCC | 3.41e-05 | 5.88e-01 | 0.082 |
| 10285 | SMNDC1 | LZE4T | Human | Esophagus | ESCC | 9.17e-11 | 3.63e-01 | 0.0811 |
| 10285 | SMNDC1 | LZE7T | Human | Esophagus | ESCC | 1.61e-09 | 1.38e-01 | 0.0667 |
| 10285 | SMNDC1 | LZE8T | Human | Esophagus | ESCC | 3.01e-04 | 2.42e-01 | 0.067 |
| 10285 | SMNDC1 | LZE20T | Human | Esophagus | ESCC | 1.86e-11 | 2.26e-01 | 0.0662 |
| 10285 | SMNDC1 | LZE22D1 | Human | Esophagus | HGIN | 4.36e-02 | -8.60e-02 | 0.0595 |
| 10285 | SMNDC1 | LZE22T | Human | Esophagus | ESCC | 1.31e-08 | 3.33e-01 | 0.068 |
| 10285 | SMNDC1 | LZE24T | Human | Esophagus | ESCC | 8.33e-20 | 6.30e-01 | 0.0596 |
| 10285 | SMNDC1 | LZE6T | Human | Esophagus | ESCC | 2.19e-08 | 3.37e-01 | 0.0845 |
| 10285 | SMNDC1 | P1T-E | Human | Esophagus | ESCC | 1.43e-02 | 5.46e-01 | 0.0875 |
| 10285 | SMNDC1 | P2T-E | Human | Esophagus | ESCC | 5.02e-41 | 8.37e-01 | 0.1177 |
| 10285 | SMNDC1 | P4T-E | Human | Esophagus | ESCC | 2.93e-44 | 1.07e+00 | 0.1323 |
| 10285 | SMNDC1 | P5T-E | Human | Esophagus | ESCC | 4.40e-40 | 9.97e-01 | 0.1327 |
| 10285 | SMNDC1 | P8T-E | Human | Esophagus | ESCC | 1.26e-28 | 5.49e-01 | 0.0889 |
| 10285 | SMNDC1 | P9T-E | Human | Esophagus | ESCC | 4.83e-08 | 2.39e-01 | 0.1131 |
| 10285 | SMNDC1 | P10T-E | Human | Esophagus | ESCC | 1.90e-15 | 2.92e-01 | 0.116 |
| 10285 | SMNDC1 | P11T-E | Human | Esophagus | ESCC | 1.04e-15 | 6.45e-01 | 0.1426 |
| 10285 | SMNDC1 | P12T-E | Human | Esophagus | ESCC | 2.24e-37 | 8.81e-01 | 0.1122 |
| 10285 | SMNDC1 | P15T-E | Human | Esophagus | ESCC | 5.75e-27 | 6.98e-01 | 0.1149 |
| 10285 | SMNDC1 | P16T-E | Human | Esophagus | ESCC | 6.51e-44 | 9.03e-01 | 0.1153 |
| Page: 1 2 3 4 5 |
| Tissue | Expression Dynamics | Abbreviation |
| Esophagus | 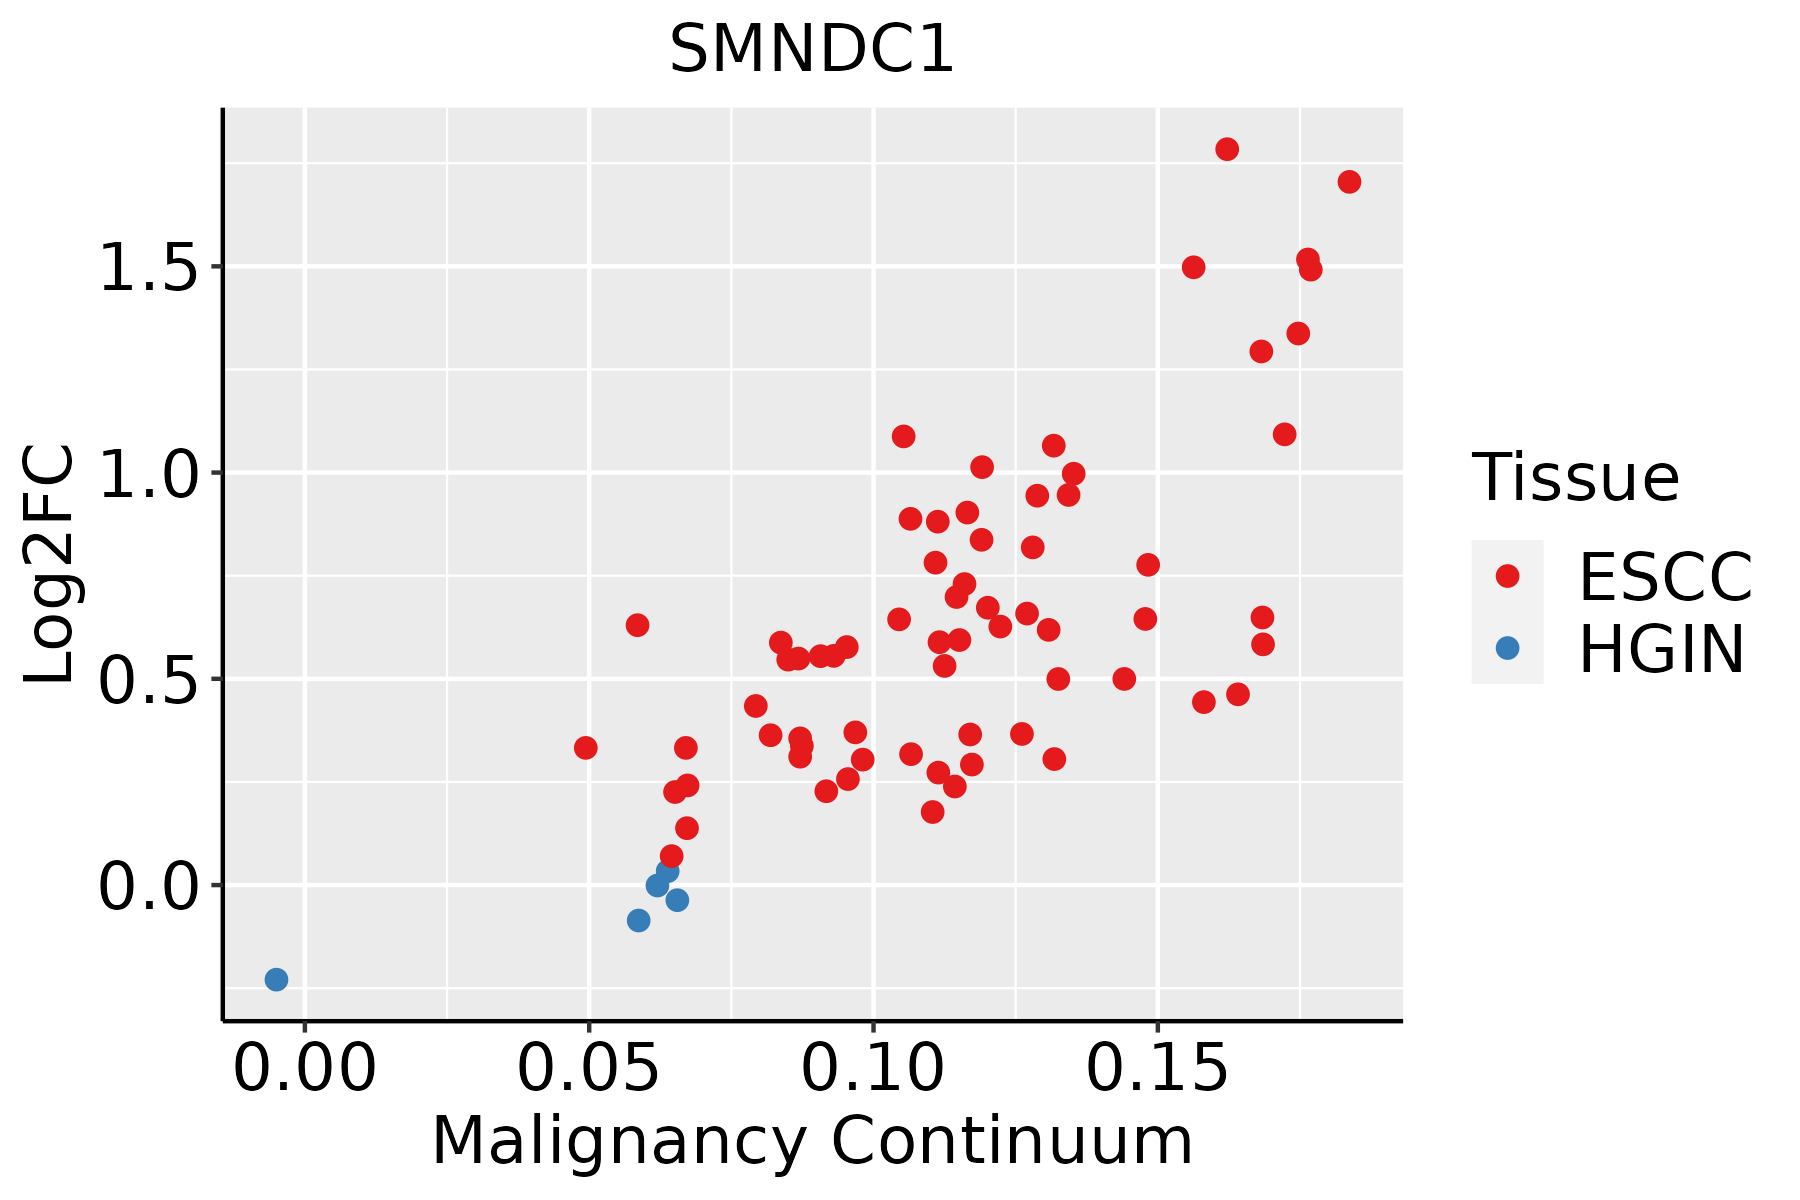 | ESCC: Esophageal squamous cell carcinoma |
| HGIN: High-grade intraepithelial neoplasias | ||
| LGIN: Low-grade intraepithelial neoplasias | ||
| Liver | 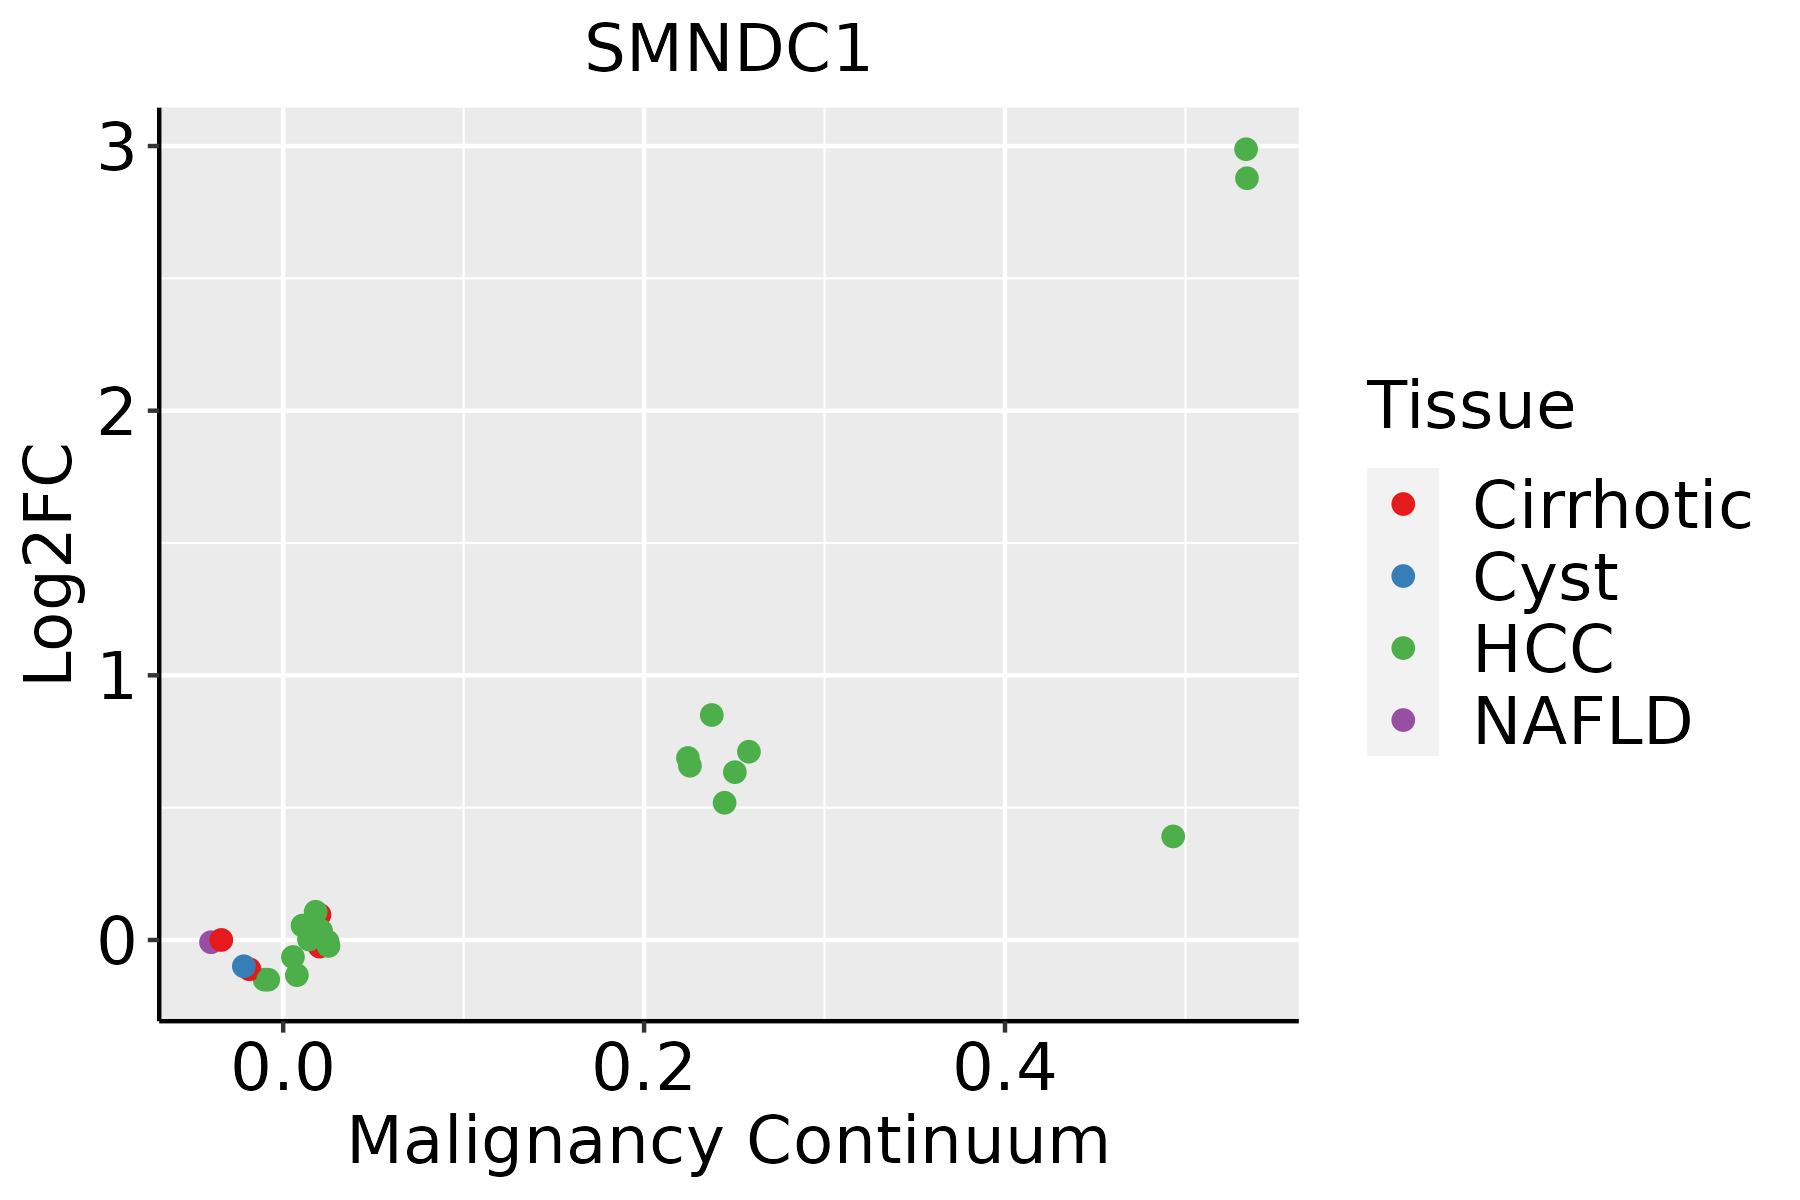 | HCC: Hepatocellular carcinoma |
| NAFLD: Non-alcoholic fatty liver disease | ||
| Oral Cavity |  | EOLP: Erosive Oral lichen planus |
| LP: leukoplakia | ||
| NEOLP: Non-erosive oral lichen planus | ||
| OSCC: Oral squamous cell carcinoma | ||
| Skin | 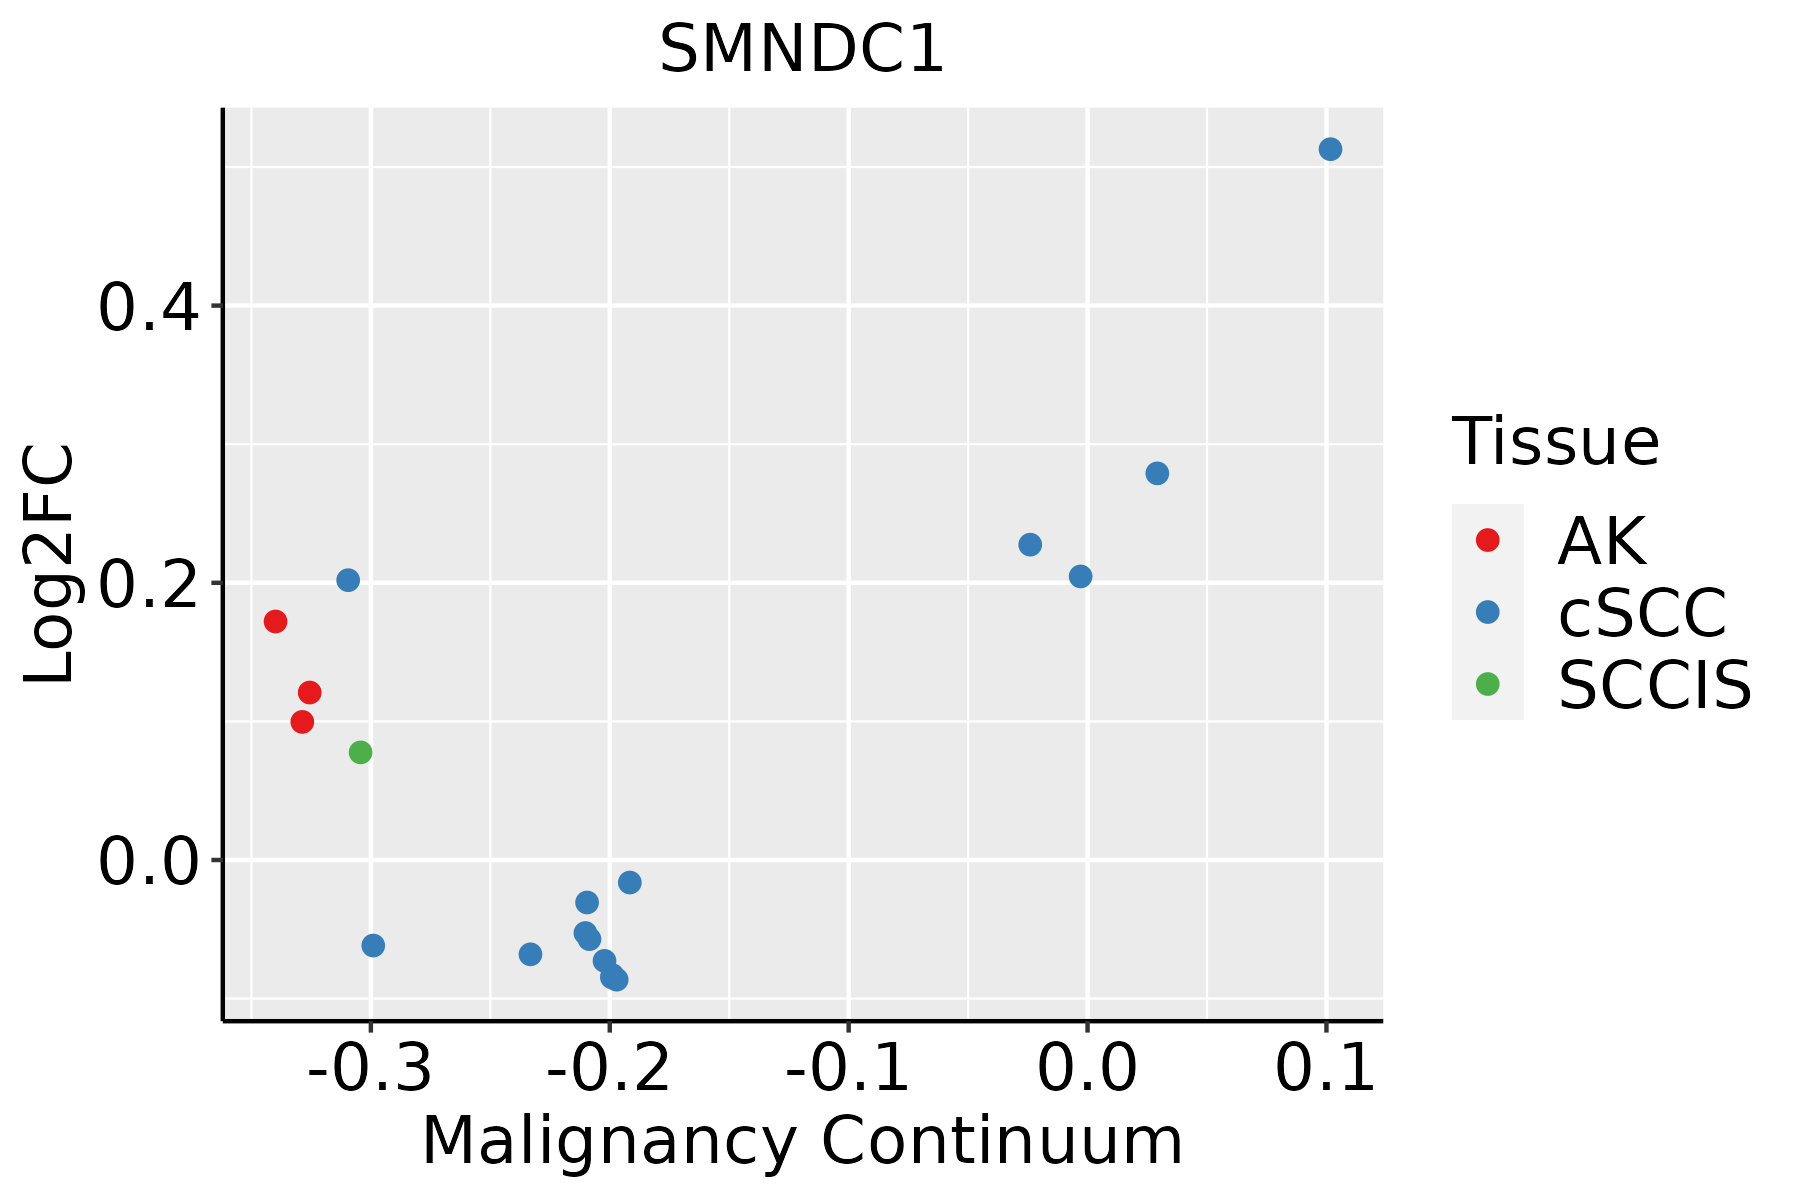 | AK: Actinic keratosis |
| cSCC: Cutaneous squamous cell carcinoma | ||
| SCCIS:squamous cell carcinoma in situ |
| ∗log2FC in expression of this searched gene in stem-like cells from each diseased tissue sample relative to stem-like cells in normal samples in each tissue plotted against the malignancy continuum. Samples are colored based on if they are from different disease stage. |
Top |
Malignant transformation related pathway analysis |
| Find out the enriched GO biological processes and KEGG pathways involved in transition from healthy to precancer to cancer |
| Tissue | Disease Stage | Enriched GO biological Processes |
| Colorectum | AD |  |
| Colorectum | SER |  |
| Colorectum | MSS |  |
| Colorectum | MSI-H |  |
| Colorectum | FAP |  |
| ∗Top 15 enriched GO BP terms are showed in the bar plot of each disease state in each tissue. Each row represents a significant GO biological process which is colored according to the -log10(p.adjust). |
| Page: 1 2 3 4 5 6 7 8 9 |
| GO ID | Tissue | Disease Stage | Description | Gene Ratio | Bg Ratio | pvalue | p.adjust | Count |
| GO:000838026 | Esophagus | HGIN | RNA splicing | 160/2587 | 434/18723 | 3.74e-34 | 1.12e-30 | 160 |
| GO:000037520 | Esophagus | HGIN | RNA splicing, via transesterification reactions | 115/2587 | 324/18723 | 3.16e-23 | 3.80e-20 | 115 |
| GO:0008380111 | Esophagus | ESCC | RNA splicing | 336/8552 | 434/18723 | 1.74e-42 | 3.67e-39 | 336 |
| GO:0000375111 | Esophagus | ESCC | RNA splicing, via transesterification reactions | 248/8552 | 324/18723 | 3.05e-30 | 1.49e-27 | 248 |
| GO:000838012 | Liver | Cirrhotic | RNA splicing | 229/4634 | 434/18723 | 9.13e-37 | 2.86e-33 | 229 |
| GO:000037512 | Liver | Cirrhotic | RNA splicing, via transesterification reactions | 175/4634 | 324/18723 | 5.95e-30 | 7.47e-27 | 175 |
| GO:000838022 | Liver | HCC | RNA splicing | 313/7958 | 434/18723 | 1.36e-36 | 1.73e-33 | 313 |
| GO:000037522 | Liver | HCC | RNA splicing, via transesterification reactions | 228/7958 | 324/18723 | 1.47e-24 | 4.06e-22 | 228 |
| GO:000838020 | Oral cavity | OSCC | RNA splicing | 308/7305 | 434/18723 | 2.43e-42 | 7.70e-39 | 308 |
| GO:000037519 | Oral cavity | OSCC | RNA splicing, via transesterification reactions | 225/7305 | 324/18723 | 5.20e-29 | 2.99e-26 | 225 |
| GO:0008380112 | Skin | cSCC | RNA splicing | 263/4864 | 434/18723 | 2.45e-53 | 5.13e-50 | 263 |
| GO:0000375112 | Skin | cSCC | RNA splicing, via transesterification reactions | 201/4864 | 324/18723 | 4.07e-43 | 5.10e-40 | 201 |
| Page: 1 |
| Pathway ID | Tissue | Disease Stage | Description | Gene Ratio | Bg Ratio | pvalue | p.adjust | qvalue | Count |
| hsa0304018 | Esophagus | HGIN | Spliceosome | 79/1383 | 217/8465 | 3.22e-13 | 7.00e-12 | 5.56e-12 | 79 |
| hsa0304019 | Esophagus | HGIN | Spliceosome | 79/1383 | 217/8465 | 3.22e-13 | 7.00e-12 | 5.56e-12 | 79 |
| hsa0304027 | Esophagus | ESCC | Spliceosome | 128/4205 | 217/8465 | 3.31e-03 | 8.79e-03 | 4.50e-03 | 128 |
| hsa0304037 | Esophagus | ESCC | Spliceosome | 128/4205 | 217/8465 | 3.31e-03 | 8.79e-03 | 4.50e-03 | 128 |
| hsa030407 | Liver | Cirrhotic | Spliceosome | 102/2530 | 217/8465 | 5.69e-08 | 9.47e-07 | 5.84e-07 | 102 |
| hsa0304012 | Liver | Cirrhotic | Spliceosome | 102/2530 | 217/8465 | 5.69e-08 | 9.47e-07 | 5.84e-07 | 102 |
| hsa0304022 | Liver | HCC | Spliceosome | 122/4020 | 217/8465 | 5.55e-03 | 1.60e-02 | 8.91e-03 | 122 |
| hsa0304032 | Liver | HCC | Spliceosome | 122/4020 | 217/8465 | 5.55e-03 | 1.60e-02 | 8.91e-03 | 122 |
| hsa0304016 | Oral cavity | OSCC | Spliceosome | 123/3704 | 217/8465 | 7.21e-05 | 2.74e-04 | 1.40e-04 | 123 |
| hsa0304017 | Oral cavity | OSCC | Spliceosome | 123/3704 | 217/8465 | 7.21e-05 | 2.74e-04 | 1.40e-04 | 123 |
| Page: 1 |
Top |
Cell-cell communication analysis |
| Identification of potential cell-cell interactions between two cell types and their ligand-receptor pairs for different disease states |
| Ligand | Receptor | LRpair | Pathway | Tissue | Disease Stage |
| Page: 1 |
Top |
Single-cell gene regulatory network inference analysis |
| Find out the significant the regulons (TFs) and the target genes of each regulon across cell types for different disease states |
| TF | Cell Type | Tissue | Disease Stage | Target Gene | RSS | Regulon Activity |
| ∗The dot plots of a searched regulon are shown for all cell subpopulations in each disease state of each tissue based on the regulon specific score inferred using pySCENIC and by calculating the average expression. |
| Page: 1 |
Top |
Somatic mutation of malignant transformation related genes |
| Annotation of somatic variants for genes involved in malignant transformation |
| Hugo Symbol | Variant Class | Variant Classification | dbSNP RS | HGVSc | HGVSp | HGVSp Short | SWISSPROT | BIOTYPE | SIFT | PolyPhen | Tumor Sample Barcode | Tissue | Histology | Sex | Age | Stage | Therapy Types | Drugs | Outcome |
| SMNDC1 | SNV | Missense_Mutation | novel | c.683N>T | p.Ser228Phe | p.S228F | O75940 | protein_coding | deleterious(0.03) | possibly_damaging(0.723) | TCGA-AC-A8OP-01 | Breast | breast invasive carcinoma | Female | >=65 | I/II | Unknown | Unknown | SD |
| SMNDC1 | SNV | Missense_Mutation | novel | c.545N>G | p.Asn182Ser | p.N182S | O75940 | protein_coding | tolerated(0.55) | benign(0.022) | TCGA-AR-A5QQ-01 | Breast | breast invasive carcinoma | Female | >=65 | III/IV | Chemotherapy | carboplatin | PD |
| SMNDC1 | SNV | Missense_Mutation | c.74N>A | p.Gly25Glu | p.G25E | O75940 | protein_coding | deleterious(0.04) | benign(0.031) | TCGA-D8-A1JA-01 | Breast | breast invasive carcinoma | Female | <65 | III/IV | Chemotherapy | adriamycin | PD | |
| SMNDC1 | SNV | Missense_Mutation | novel | c.28G>A | p.Ala10Thr | p.A10T | O75940 | protein_coding | tolerated(0.56) | benign(0.039) | TCGA-2W-A8YY-01 | Cervix | cervical & endocervical cancer | Female | <65 | I/II | Chemotherapy | cisplatin | CR |
| SMNDC1 | SNV | Missense_Mutation | c.184G>C | p.Asp62His | p.D62H | O75940 | protein_coding | tolerated(0.05) | benign(0.229) | TCGA-IR-A3LA-01 | Cervix | cervical & endocervical cancer | Female | <65 | I/II | Chemotherapy | cisplatin | CR | |
| SMNDC1 | insertion | Frame_Shift_Ins | novel | c.417_418insGGAAGGCAAAGGAGGACAGTGGCAACAAACCC | p.Met140GlyfsTer17 | p.M140Gfs*17 | O75940 | protein_coding | TCGA-HM-A3JK-01 | Cervix | cervical & endocervical cancer | Female | <65 | I/II | Chemotherapy | cisplatin | SD | ||
| SMNDC1 | SNV | Missense_Mutation | novel | c.516N>T | p.Glu172Asp | p.E172D | O75940 | protein_coding | deleterious(0.01) | probably_damaging(0.983) | TCGA-A6-5661-01 | Colorectum | colon adenocarcinoma | Female | >=65 | I/II | Unknown | Unknown | SD |
| SMNDC1 | insertion | Frame_Shift_Ins | novel | c.573_574insA | p.Gly192ArgfsTer12 | p.G192Rfs*12 | O75940 | protein_coding | TCGA-AA-A022-01 | Colorectum | colon adenocarcinoma | Female | >=65 | I/II | Unknown | Unknown | SD | ||
| SMNDC1 | SNV | Missense_Mutation | novel | c.84N>C | p.Glu28Asp | p.E28D | O75940 | protein_coding | tolerated(0.74) | benign(0.001) | TCGA-A5-A0G2-01 | Endometrium | uterine corpus endometrioid carcinoma | Female | <65 | III/IV | Unknown | Unknown | SD |
| SMNDC1 | SNV | Missense_Mutation | novel | c.500N>G | p.Leu167Arg | p.L167R | O75940 | protein_coding | deleterious(0) | possibly_damaging(0.856) | TCGA-AX-A05Z-01 | Endometrium | uterine corpus endometrioid carcinoma | Female | <65 | III/IV | Chemotherapy | adriamycin | SD |
| Page: 1 2 3 |
Top |
Related drugs of malignant transformation related genes |
| Identification of chemicals and drugs interact with genes involved in malignant transfromation |
| (DGIdb 4.0) |
| Entrez ID | Symbol | Category | Interaction Types | Drug Claim Name | Drug Name | PMIDs |
| Page: 1 |

Copyright 2023-Present -The University of Texas Health Science Center at Houston |