
|
|||||
|
 | |
| |
| |
| |
| |
| |
|
Gene: SMIM5 |
Gene summary for SMIM5 |
| Gene information | Species | Human | Gene symbol | SMIM5 | Gene ID | 643008 |
| Gene name | small integral membrane protein 5 | |
| Gene Alias | C17orf109 | |
| Cytomap | 17q25.1 | |
| Gene Type | protein-coding | GO ID | GO:0005575 | UniProtAcc | Q71RC9 |
Top |
Malignant transformation analysis |
| Identification of the aberrant gene expression in precancerous and cancerous lesions by comparing the gene expression of stem-like cells in diseased tissues with normal stem cells |
| Entrez ID | Symbol | Replicates | Species | Organ | Tissue | Adj P-value | Log2FC | Malignancy |
| 643008 | SMIM5 | LZE22T | Human | Esophagus | ESCC | 1.57e-02 | 2.20e-01 | 0.068 |
| 643008 | SMIM5 | P1T-E | Human | Esophagus | ESCC | 1.09e-04 | 3.97e-01 | 0.0875 |
| 643008 | SMIM5 | P8T-E | Human | Esophagus | ESCC | 3.14e-12 | 4.14e-01 | 0.0889 |
| 643008 | SMIM5 | P11T-E | Human | Esophagus | ESCC | 1.13e-06 | 3.20e-01 | 0.1426 |
| 643008 | SMIM5 | P19T-E | Human | Esophagus | ESCC | 5.57e-05 | 5.96e-01 | 0.1662 |
| 643008 | SMIM5 | P23T-E | Human | Esophagus | ESCC | 4.42e-05 | 1.76e-01 | 0.108 |
| 643008 | SMIM5 | P39T-E | Human | Esophagus | ESCC | 5.55e-07 | 3.33e-01 | 0.0894 |
| 643008 | SMIM5 | P44T-E | Human | Esophagus | ESCC | 7.53e-03 | 1.19e-01 | 0.1096 |
| 643008 | SMIM5 | P74T-E | Human | Esophagus | ESCC | 2.03e-13 | 5.22e-01 | 0.1479 |
| 643008 | SMIM5 | P75T-E | Human | Esophagus | ESCC | 7.01e-13 | 5.06e-01 | 0.1125 |
| 643008 | SMIM5 | P82T-E | Human | Esophagus | ESCC | 4.96e-16 | 1.08e+00 | 0.1072 |
| 643008 | SMIM5 | P84T-E | Human | Esophagus | ESCC | 1.34e-04 | 9.71e-01 | 0.0933 |
| 643008 | SMIM5 | P94T-E | Human | Esophagus | ESCC | 6.05e-03 | 4.46e-01 | 0.0879 |
| 643008 | SMIM5 | P127T-E | Human | Esophagus | ESCC | 8.08e-05 | 1.67e-01 | 0.0826 |
| 643008 | SMIM5 | HCC2_Meng | Human | Liver | HCC | 2.28e-09 | 5.11e-02 | 0.0107 |
| 643008 | SMIM5 | HCC1 | Human | Liver | HCC | 7.77e-09 | 9.91e-01 | 0.5336 |
| 643008 | SMIM5 | HCC2 | Human | Liver | HCC | 7.17e-15 | 1.28e+00 | 0.5341 |
| 643008 | SMIM5 | HCC5 | Human | Liver | HCC | 5.24e-18 | 1.66e+00 | 0.4932 |
| 643008 | SMIM5 | male-WTA | Human | Thyroid | PTC | 8.61e-10 | 6.25e-02 | 0.1037 |
| 643008 | SMIM5 | PTC01 | Human | Thyroid | PTC | 7.42e-06 | 9.58e-02 | 0.1899 |
| Page: 1 2 |
| Tissue | Expression Dynamics | Abbreviation |
| Esophagus | 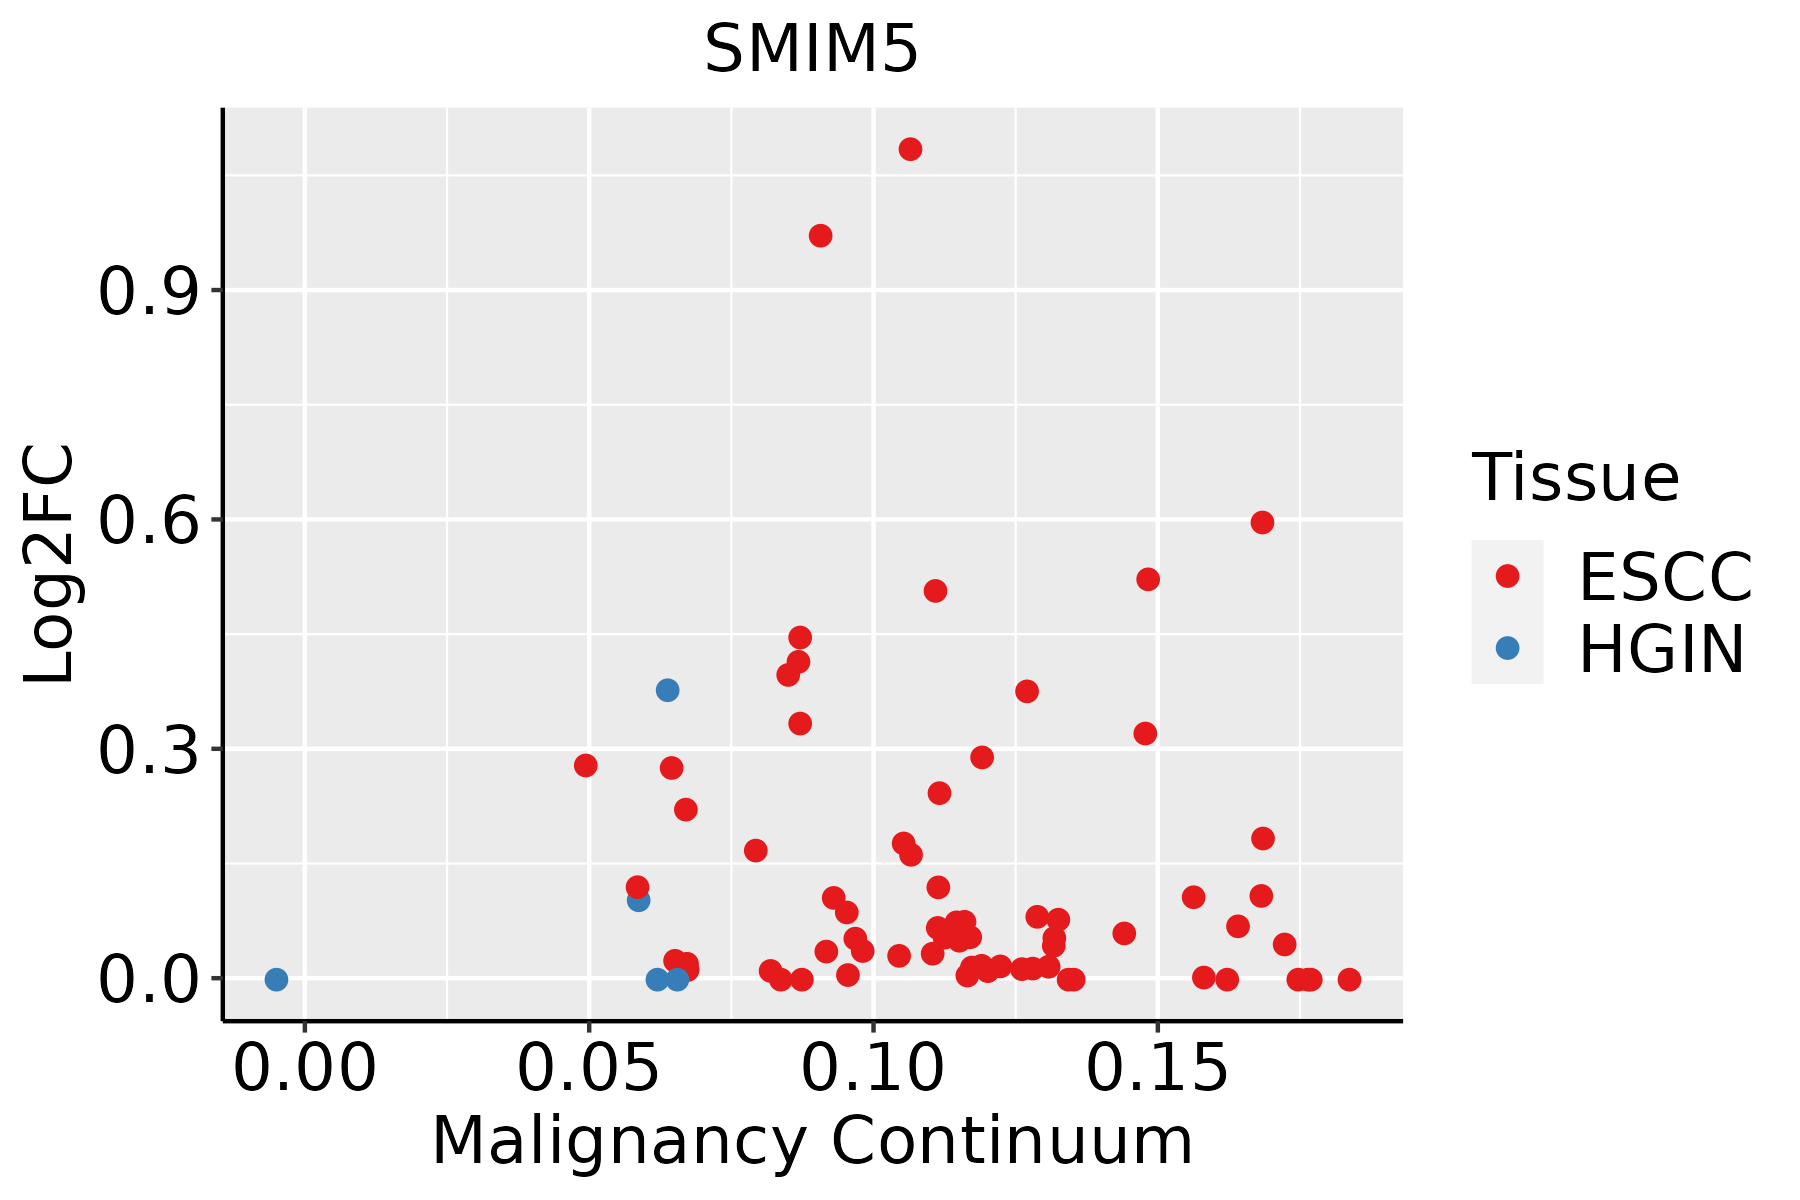 | ESCC: Esophageal squamous cell carcinoma |
| HGIN: High-grade intraepithelial neoplasias | ||
| LGIN: Low-grade intraepithelial neoplasias | ||
| Liver | 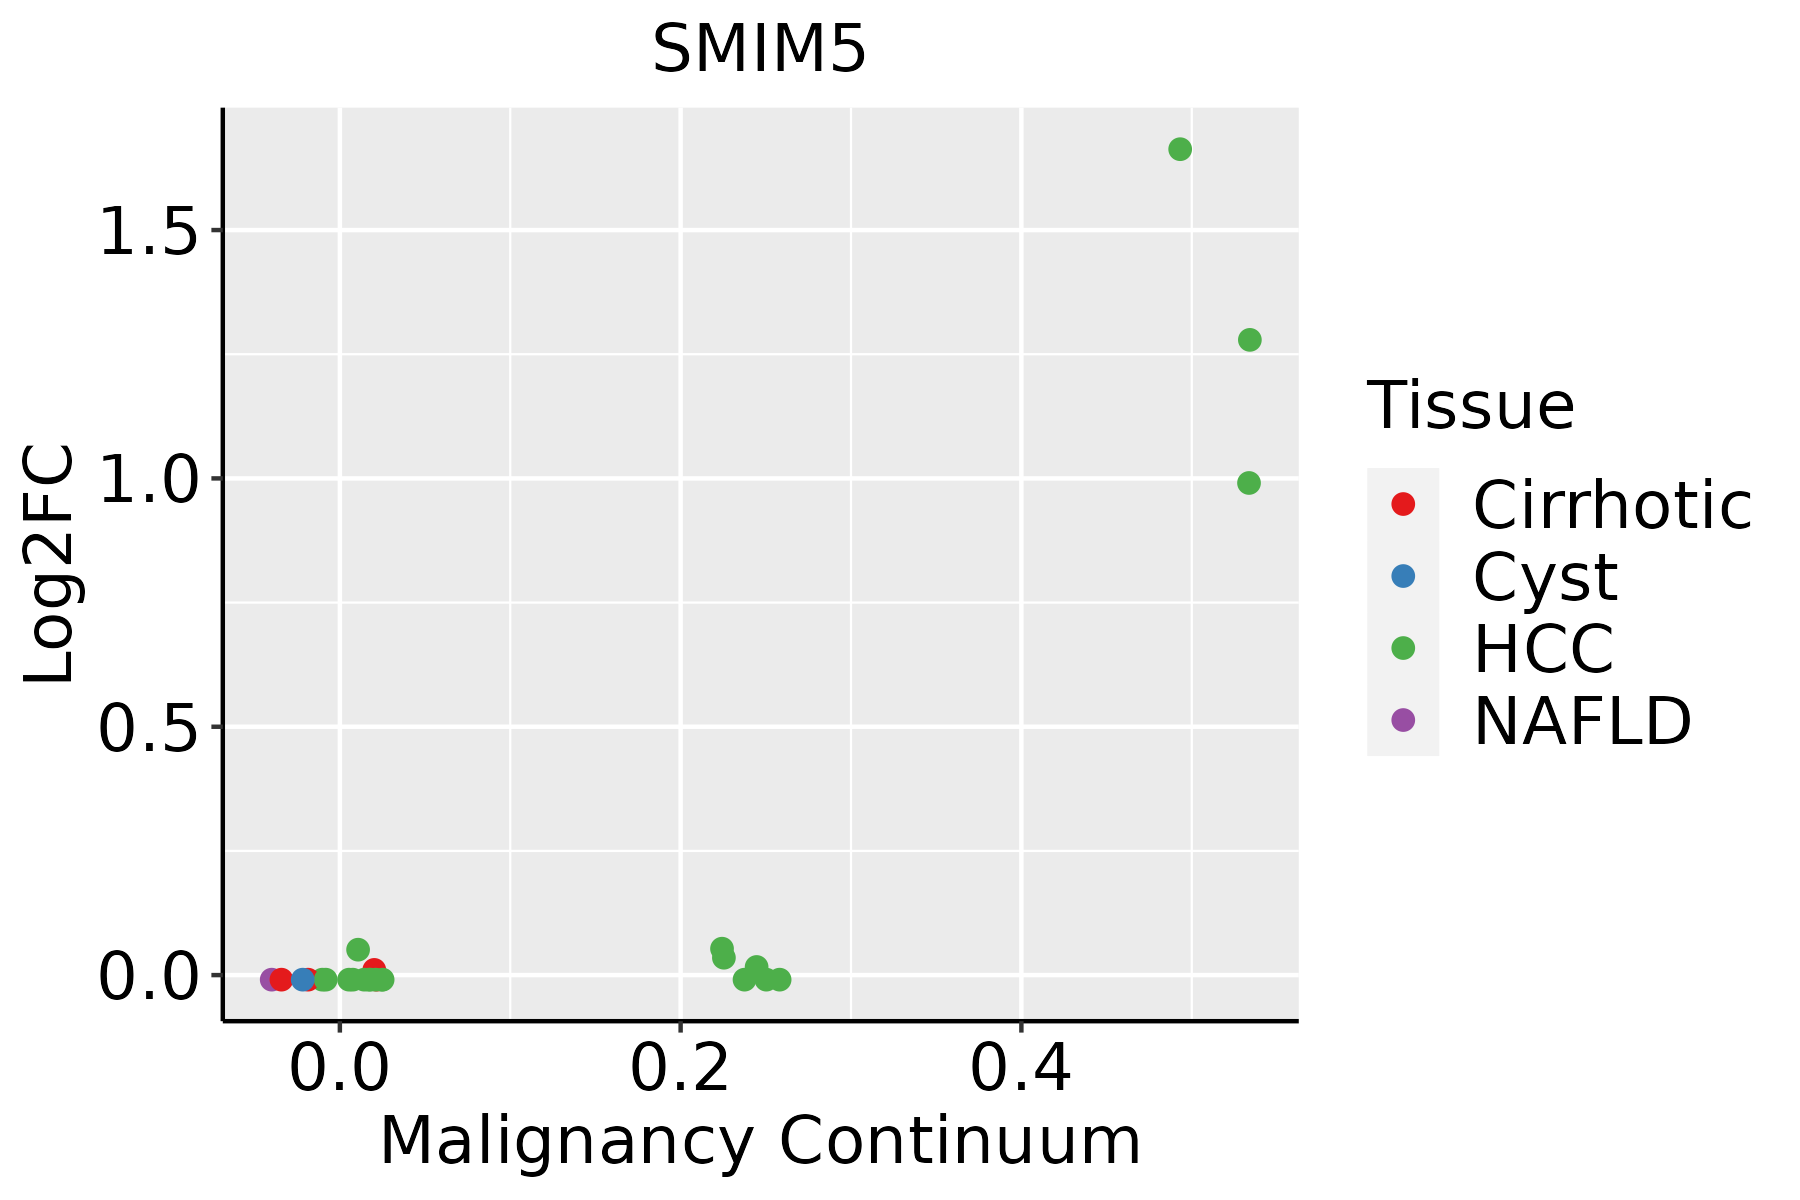 | HCC: Hepatocellular carcinoma |
| NAFLD: Non-alcoholic fatty liver disease | ||
| Thyroid | 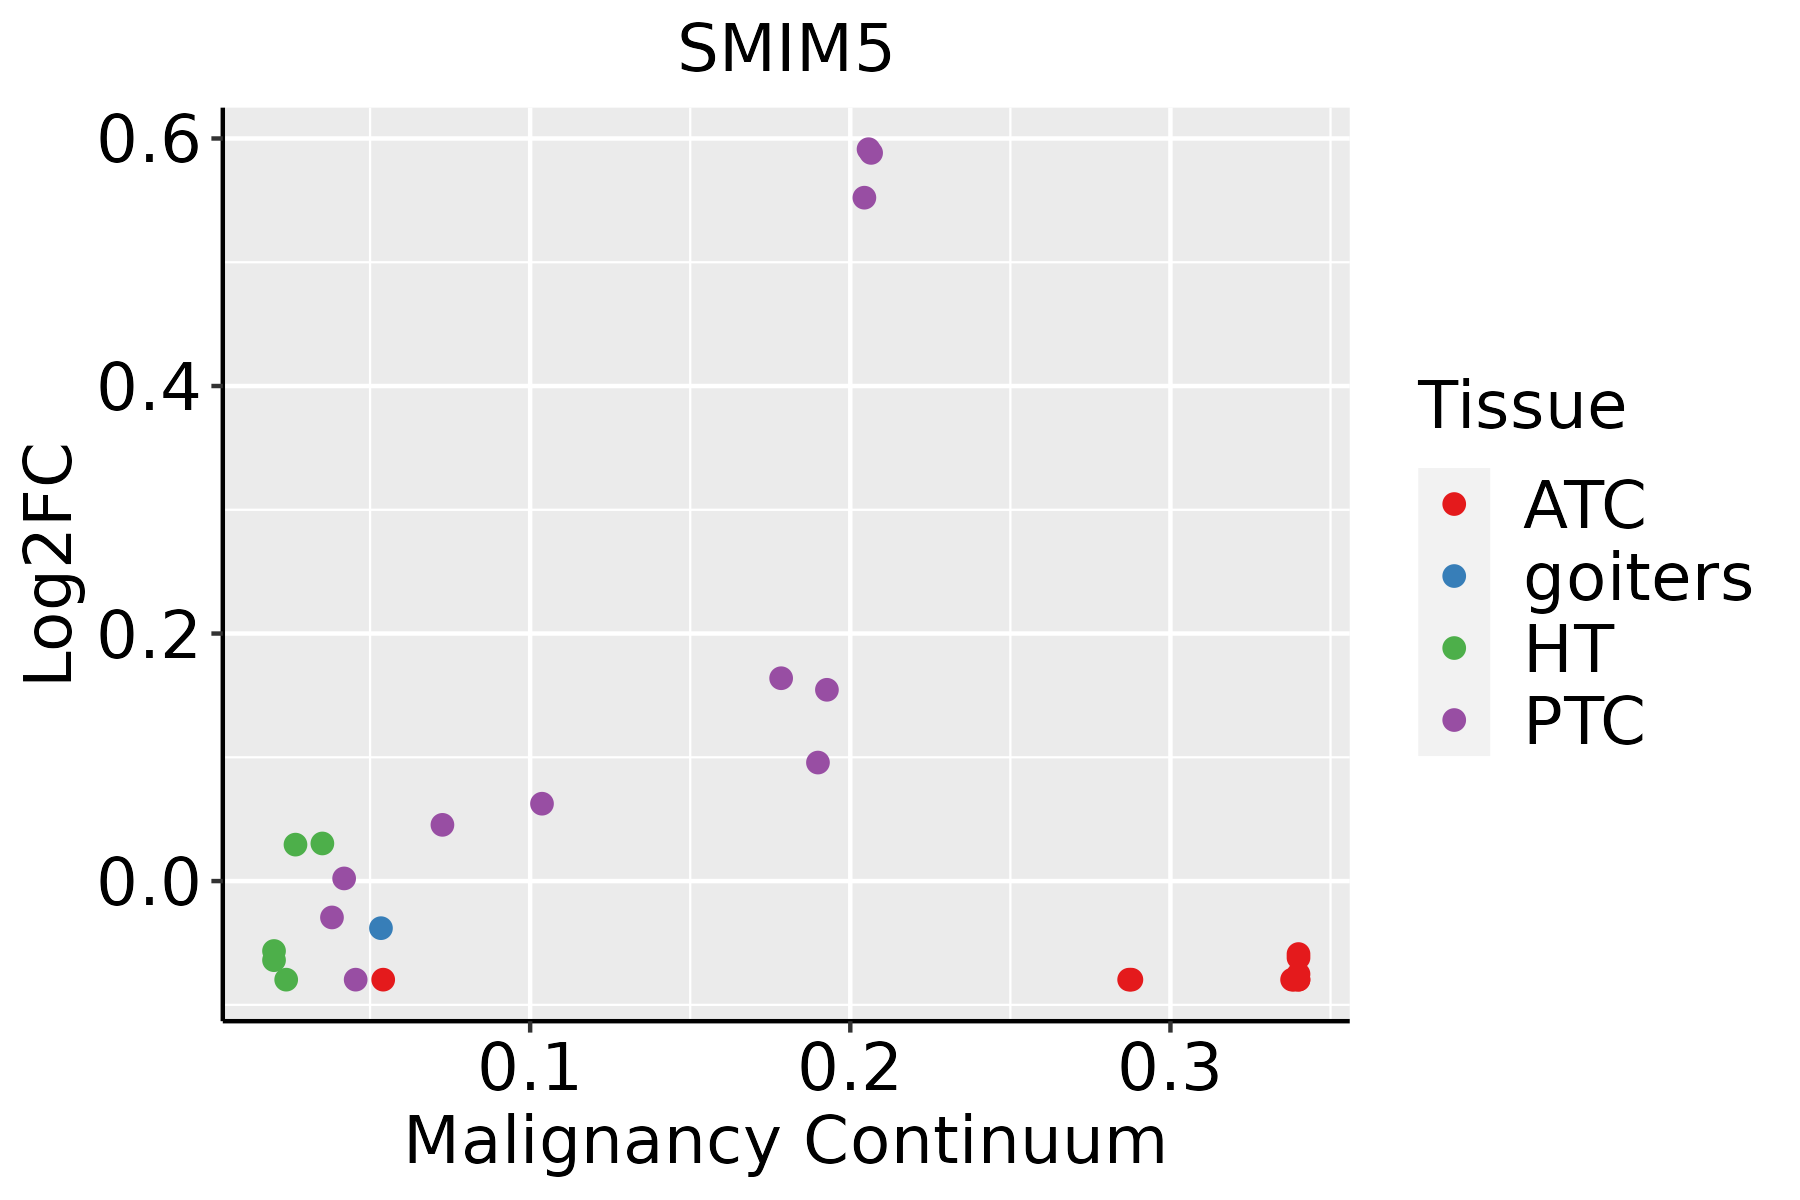 | ATC: Anaplastic thyroid cancer |
| HT: Hashimoto's thyroiditis | ||
| PTC: Papillary thyroid cancer |
| ∗log2FC in expression of this searched gene in stem-like cells from each diseased tissue sample relative to stem-like cells in normal samples in each tissue plotted against the malignancy continuum. Samples are colored based on if they are from different disease stage. |
Top |
Malignant transformation related pathway analysis |
| Find out the enriched GO biological processes and KEGG pathways involved in transition from healthy to precancer to cancer |
| Tissue | Disease Stage | Enriched GO biological Processes |
| Colorectum | AD |  |
| Colorectum | SER |  |
| Colorectum | MSS |  |
| Colorectum | MSI-H |  |
| Colorectum | FAP |  |
| ∗Top 15 enriched GO BP terms are showed in the bar plot of each disease state in each tissue. Each row represents a significant GO biological process which is colored according to the -log10(p.adjust). |
| Page: 1 2 3 4 5 6 7 8 9 |
| GO ID | Tissue | Disease Stage | Description | Gene Ratio | Bg Ratio | pvalue | p.adjust | Count |
| Page: 1 |
| Pathway ID | Tissue | Disease Stage | Description | Gene Ratio | Bg Ratio | pvalue | p.adjust | qvalue | Count |
| Page: 1 |
Top |
Cell-cell communication analysis |
| Identification of potential cell-cell interactions between two cell types and their ligand-receptor pairs for different disease states |
| Ligand | Receptor | LRpair | Pathway | Tissue | Disease Stage |
| Page: 1 |
Top |
Single-cell gene regulatory network inference analysis |
| Find out the significant the regulons (TFs) and the target genes of each regulon across cell types for different disease states |
| TF | Cell Type | Tissue | Disease Stage | Target Gene | RSS | Regulon Activity |
| ∗The dot plots of a searched regulon are shown for all cell subpopulations in each disease state of each tissue based on the regulon specific score inferred using pySCENIC and by calculating the average expression. |
| Page: 1 |
Top |
Somatic mutation of malignant transformation related genes |
| Annotation of somatic variants for genes involved in malignant transformation |
| Hugo Symbol | Variant Class | Variant Classification | dbSNP RS | HGVSc | HGVSp | HGVSp Short | SWISSPROT | BIOTYPE | SIFT | PolyPhen | Tumor Sample Barcode | Tissue | Histology | Sex | Age | Stage | Therapy Types | Drugs | Outcome |
| SMIM5 | SNV | Missense_Mutation | rs374017473 | c.13G>A | p.Asp5Asn | p.D5N | Q71RC9 | protein_coding | tolerated(0.49) | benign(0) | TCGA-O8-A75V-01 | Liver | liver hepatocellular carcinoma | Male | <65 | I/II | Unknown | Unknown | SD |
| SMIM5 | insertion | Frame_Shift_Ins | novel | c.107_108insA | p.Val37SerfsTer28 | p.V37Sfs*28 | Q71RC9 | protein_coding | TCGA-ED-A7XO-01 | Liver | liver hepatocellular carcinoma | Male | <65 | III/IV | Unknown | Unknown | PD |
| Page: 1 |
Top |
Related drugs of malignant transformation related genes |
| Identification of chemicals and drugs interact with genes involved in malignant transfromation |
| (DGIdb 4.0) |
| Entrez ID | Symbol | Category | Interaction Types | Drug Claim Name | Drug Name | PMIDs |
| Page: 1 |

Copyright 2023-Present -The University of Texas Health Science Center at Houston |