
|
|||||
|
 | |
| |
| |
| |
| |
| |
|
Gene: SMIM24 |
Gene summary for SMIM24 |
| Gene information | Species | Human | Gene symbol | SMIM24 | Gene ID | 284422 |
| Gene name | small integral membrane protein 24 | |
| Gene Alias | C19orf77 | |
| Cytomap | 19p13.3 | |
| Gene Type | protein-coding | GO ID | GO:0008150 | UniProtAcc | O75264 |
Top |
Malignant transformation analysis |
| Identification of the aberrant gene expression in precancerous and cancerous lesions by comparing the gene expression of stem-like cells in diseased tissues with normal stem cells |
| Entrez ID | Symbol | Replicates | Species | Organ | Tissue | Adj P-value | Log2FC | Malignancy |
| 284422 | SMIM24 | HTA11_2487_2000001011 | Human | Colorectum | SER | 1.28e-09 | 4.42e-01 | -0.1808 |
| 284422 | SMIM24 | HTA11_1938_2000001011 | Human | Colorectum | AD | 2.16e-07 | 3.26e-01 | -0.0811 |
| 284422 | SMIM24 | HTA11_347_2000001011 | Human | Colorectum | AD | 1.11e-19 | 5.02e-01 | -0.1954 |
| 284422 | SMIM24 | HTA11_411_2000001011 | Human | Colorectum | SER | 4.84e-08 | 1.12e+00 | -0.2602 |
| 284422 | SMIM24 | HTA11_83_2000001011 | Human | Colorectum | SER | 1.82e-15 | 6.41e-01 | -0.1526 |
| 284422 | SMIM24 | HTA11_696_2000001011 | Human | Colorectum | AD | 1.66e-11 | 3.26e-01 | -0.1464 |
| 284422 | SMIM24 | HTA11_866_2000001011 | Human | Colorectum | AD | 2.30e-04 | 1.93e-01 | -0.1001 |
| 284422 | SMIM24 | HTA11_1391_2000001011 | Human | Colorectum | AD | 2.40e-05 | 1.97e-01 | -0.059 |
| 284422 | SMIM24 | HTA11_546_2000001011 | Human | Colorectum | AD | 7.42e-03 | 3.12e-01 | -0.0842 |
| 284422 | SMIM24 | HTA11_10623_2000001011 | Human | Colorectum | AD | 1.16e-04 | 3.18e-01 | -0.0177 |
| 284422 | SMIM24 | HTA11_7696_3000711011 | Human | Colorectum | AD | 6.00e-03 | 8.69e-02 | 0.0674 |
| 284422 | SMIM24 | HTA11_99999965062_69753 | Human | Colorectum | MSI-H | 2.97e-03 | 6.43e-01 | 0.3487 |
| 284422 | SMIM24 | HTA11_99999965104_69814 | Human | Colorectum | MSS | 7.61e-09 | 5.03e-01 | 0.281 |
| 284422 | SMIM24 | HTA11_99999971662_82457 | Human | Colorectum | MSS | 1.84e-06 | 2.31e-01 | 0.3859 |
| 284422 | SMIM24 | HTA11_99999974143_84620 | Human | Colorectum | MSS | 1.72e-18 | 4.70e-01 | 0.3005 |
| 284422 | SMIM24 | P26T-E | Human | Esophagus | ESCC | 1.76e-12 | 2.79e-01 | 0.1276 |
| 284422 | SMIM24 | P74T-E | Human | Esophagus | ESCC | 1.02e-05 | 2.09e-01 | 0.1479 |
| 284422 | SMIM24 | P82T-E | Human | Esophagus | ESCC | 6.28e-04 | 4.04e-01 | 0.1072 |
| 284422 | SMIM24 | P94T-E | Human | Esophagus | ESCC | 3.52e-14 | 2.00e+00 | 0.0879 |
| 284422 | SMIM24 | P104T-E | Human | Esophagus | ESCC | 2.57e-13 | 5.78e-01 | 0.0931 |
| Page: 1 2 3 |
| Tissue | Expression Dynamics | Abbreviation |
| Colorectum (GSE201348) |  | FAP: Familial adenomatous polyposis |
| CRC: Colorectal cancer | ||
| Colorectum (HTA11) |  | AD: Adenomas |
| SER: Sessile serrated lesions | ||
| MSI-H: Microsatellite-high colorectal cancer | ||
| MSS: Microsatellite stable colorectal cancer | ||
| Esophagus |  | ESCC: Esophageal squamous cell carcinoma |
| HGIN: High-grade intraepithelial neoplasias | ||
| LGIN: Low-grade intraepithelial neoplasias | ||
| GC | 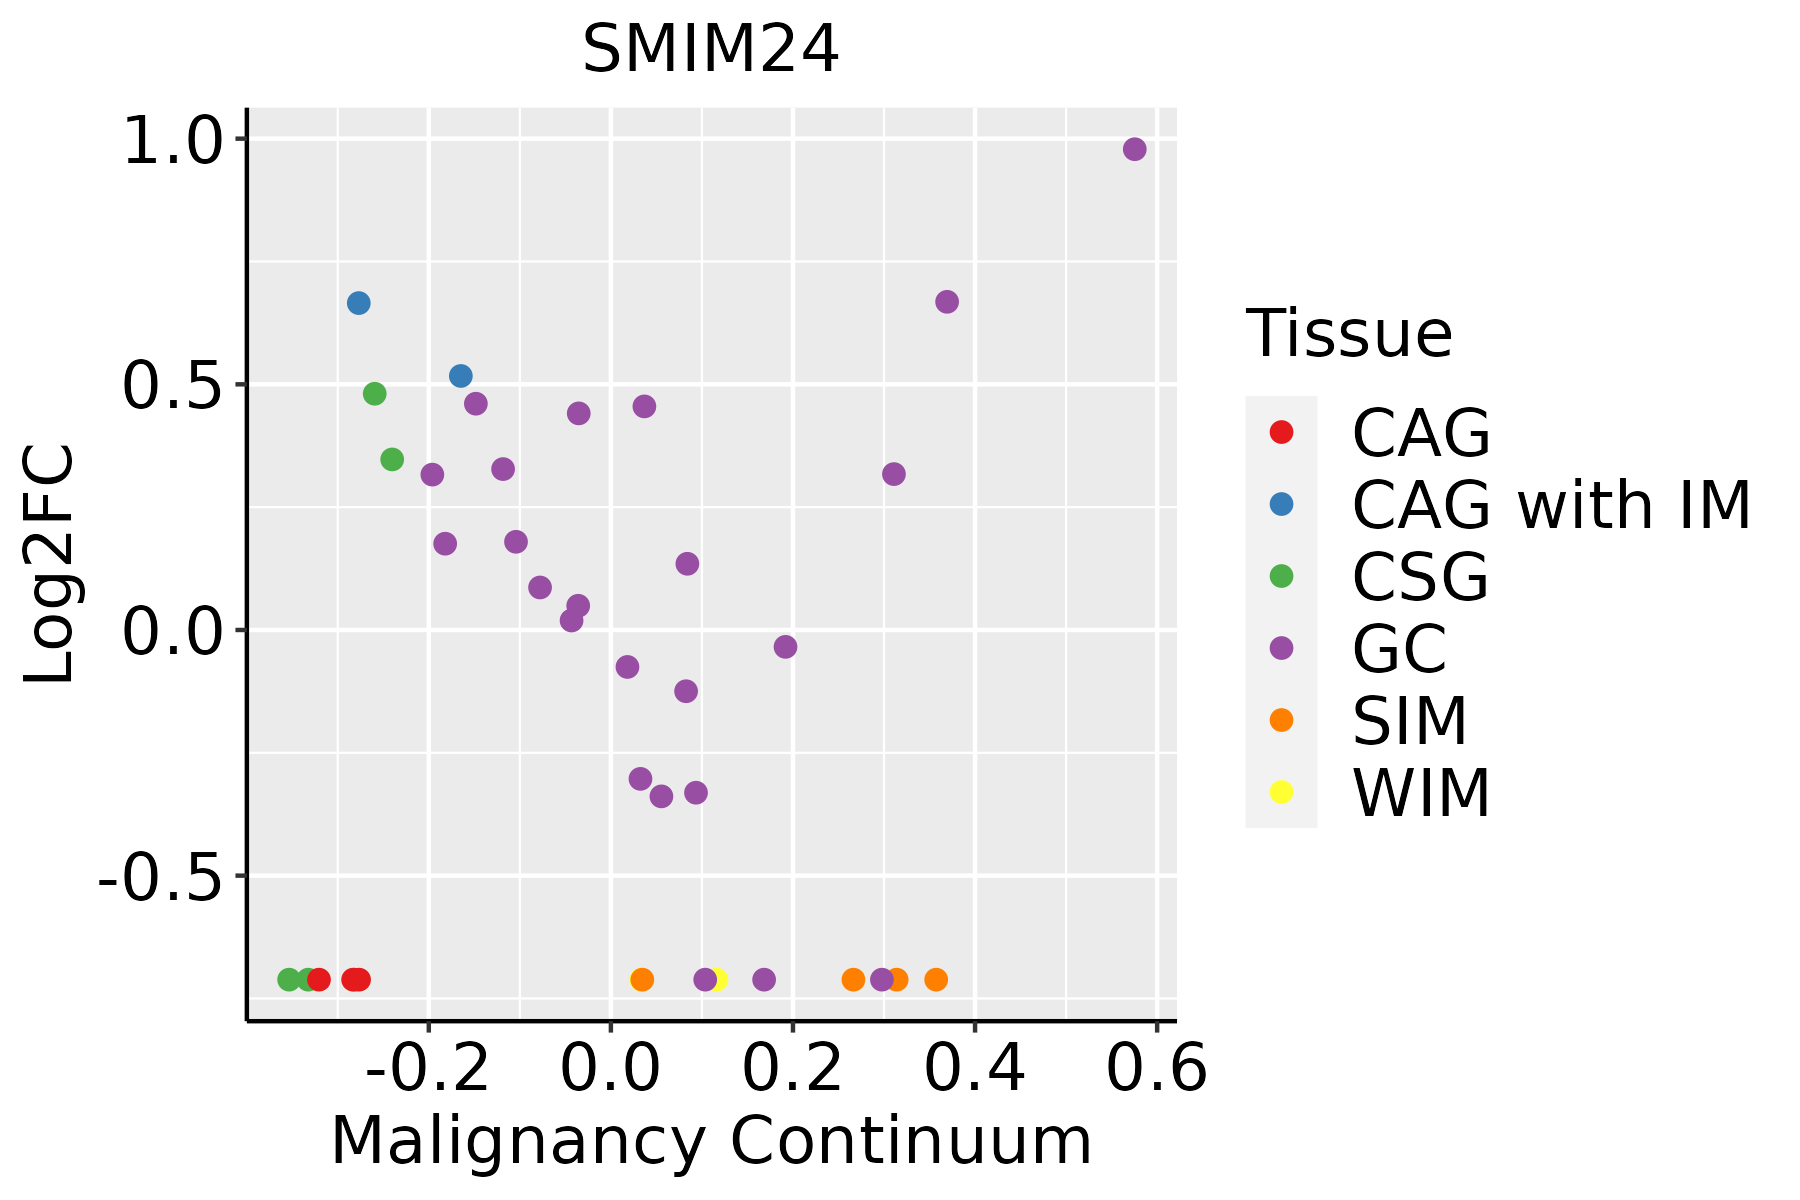 | CAG: Chronic atrophic gastritis |
| CAG with IM: Chronic atrophic gastritis with intestinal metaplasia | ||
| CSG: Chronic superficial gastritis | ||
| GC: Gastric cancer | ||
| SIM: Severe intestinal metaplasia | ||
| WIM: Wild intestinal metaplasia |
| ∗log2FC in expression of this searched gene in stem-like cells from each diseased tissue sample relative to stem-like cells in normal samples in each tissue plotted against the malignancy continuum. Samples are colored based on if they are from different disease stage. |
Top |
Malignant transformation related pathway analysis |
| Find out the enriched GO biological processes and KEGG pathways involved in transition from healthy to precancer to cancer |
| Tissue | Disease Stage | Enriched GO biological Processes |
| Colorectum | AD |  |
| Colorectum | SER |  |
| Colorectum | MSS |  |
| Colorectum | MSI-H |  |
| Colorectum | FAP |  |
| ∗Top 15 enriched GO BP terms are showed in the bar plot of each disease state in each tissue. Each row represents a significant GO biological process which is colored according to the -log10(p.adjust). |
| Page: 1 2 3 4 5 6 7 8 9 |
| GO ID | Tissue | Disease Stage | Description | Gene Ratio | Bg Ratio | pvalue | p.adjust | Count |
| Page: 1 |
| Pathway ID | Tissue | Disease Stage | Description | Gene Ratio | Bg Ratio | pvalue | p.adjust | qvalue | Count |
| Page: 1 |
Top |
Cell-cell communication analysis |
| Identification of potential cell-cell interactions between two cell types and their ligand-receptor pairs for different disease states |
| Ligand | Receptor | LRpair | Pathway | Tissue | Disease Stage |
| Page: 1 |
Top |
Single-cell gene regulatory network inference analysis |
| Find out the significant the regulons (TFs) and the target genes of each regulon across cell types for different disease states |
| TF | Cell Type | Tissue | Disease Stage | Target Gene | RSS | Regulon Activity |
| ∗The dot plots of a searched regulon are shown for all cell subpopulations in each disease state of each tissue based on the regulon specific score inferred using pySCENIC and by calculating the average expression. |
| Page: 1 |
Top |
Somatic mutation of malignant transformation related genes |
| Annotation of somatic variants for genes involved in malignant transformation |
| Hugo Symbol | Variant Class | Variant Classification | dbSNP RS | HGVSc | HGVSp | HGVSp Short | SWISSPROT | BIOTYPE | SIFT | PolyPhen | Tumor Sample Barcode | Tissue | Histology | Sex | Age | Stage | Therapy Types | Drugs | Outcome |
| SMIM24 | SNV | Missense_Mutation | novel | c.82N>A | p.Leu28Met | p.L28M | O75264 | protein_coding | tolerated(0.07) | probably_damaging(0.986) | TCGA-A2-A0YK-01 | Breast | breast invasive carcinoma | Female | <65 | I/II | Chemotherapy | cytoxan | SD |
| SMIM24 | SNV | Missense_Mutation | c.349N>G | p.Lys117Glu | p.K117E | O75264 | protein_coding | tolerated(0.51) | benign(0) | TCGA-E9-A1ND-01 | Breast | breast invasive carcinoma | Female | >=65 | I/II | Hormone Therapy | aromasin | SD | |
| SMIM24 | SNV | Missense_Mutation | novel | c.347A>G | p.Glu116Gly | p.E116G | O75264 | protein_coding | deleterious(0) | possibly_damaging(0.753) | TCGA-AA-3949-01 | Colorectum | colon adenocarcinoma | Female | >=65 | III/IV | Unknown | Unknown | SD |
| SMIM24 | SNV | Missense_Mutation | novel | c.41T>C | p.Leu14Pro | p.L14P | O75264 | protein_coding | deleterious(0) | possibly_damaging(0.598) | TCGA-AP-A1DK-01 | Endometrium | uterine corpus endometrioid carcinoma | Female | <65 | I/II | Unknown | Unknown | SD |
| SMIM24 | SNV | Missense_Mutation | novel | c.71N>T | p.Thr24Met | p.T24M | O75264 | protein_coding | deleterious(0.01) | possibly_damaging(0.801) | TCGA-AP-A1DO-01 | Endometrium | uterine corpus endometrioid carcinoma | Female | <65 | I/II | Unknown | Unknown | SD |
| SMIM24 | SNV | Missense_Mutation | novel | c.279N>C | p.Glu93Asp | p.E93D | O75264 | protein_coding | tolerated(0.3) | benign(0.154) | TCGA-EO-A3B0-01 | Endometrium | uterine corpus endometrioid carcinoma | Female | <65 | III/IV | Unknown | Unknown | SD |
| SMIM24 | SNV | Missense_Mutation | novel | c.160N>A | p.Leu54Ile | p.L54I | O75264 | protein_coding | tolerated(1) | benign(0.009) | TCGA-EO-A3KX-01 | Endometrium | uterine corpus endometrioid carcinoma | Female | >=65 | I/II | Unknown | Unknown | SD |
| Page: 1 |
Top |
Related drugs of malignant transformation related genes |
| Identification of chemicals and drugs interact with genes involved in malignant transfromation |
| (DGIdb 4.0) |
| Entrez ID | Symbol | Category | Interaction Types | Drug Claim Name | Drug Name | PMIDs |
| Page: 1 |

Copyright 2023-Present -The University of Texas Health Science Center at Houston |