
|
|||||
|
 | |
| |
| |
| |
| |
| |
|
Gene: SMIM15 |
Gene summary for SMIM15 |
| Gene information | Species | Human | Gene symbol | SMIM15 | Gene ID | 643155 |
| Gene name | small integral membrane protein 15 | |
| Gene Alias | C5orf43 | |
| Cytomap | 5q12.1 | |
| Gene Type | protein-coding | GO ID | GO:0005575 | UniProtAcc | Q7Z3B0 |
Top |
Malignant transformation analysis |
| Identification of the aberrant gene expression in precancerous and cancerous lesions by comparing the gene expression of stem-like cells in diseased tissues with normal stem cells |
| Entrez ID | Symbol | Replicates | Species | Organ | Tissue | Adj P-value | Log2FC | Malignancy |
| 643155 | SMIM15 | HTA11_78_2000001011 | Human | Colorectum | AD | 4.12e-05 | 2.26e-01 | -0.1088 |
| 643155 | SMIM15 | HTA11_347_2000001011 | Human | Colorectum | AD | 1.86e-07 | 2.43e-01 | -0.1954 |
| 643155 | SMIM15 | HTA11_6801_2000001011 | Human | Colorectum | SER | 1.51e-05 | 4.31e-01 | 0.0171 |
| 643155 | SMIM15 | HTA11_99999970781_79442 | Human | Colorectum | MSS | 3.29e-04 | 2.20e-01 | 0.294 |
| 643155 | SMIM15 | HTA11_99999971662_82457 | Human | Colorectum | MSS | 7.25e-03 | 1.63e-01 | 0.3859 |
| 643155 | SMIM15 | LZE4T | Human | Esophagus | ESCC | 4.55e-12 | 3.92e-01 | 0.0811 |
| 643155 | SMIM15 | LZE7T | Human | Esophagus | ESCC | 1.62e-03 | 2.98e-01 | 0.0667 |
| 643155 | SMIM15 | LZE8T | Human | Esophagus | ESCC | 2.36e-16 | 4.98e-01 | 0.067 |
| 643155 | SMIM15 | LZE20T | Human | Esophagus | ESCC | 3.33e-03 | 2.20e-01 | 0.0662 |
| 643155 | SMIM15 | LZE24T | Human | Esophagus | ESCC | 1.01e-28 | 8.95e-01 | 0.0596 |
| 643155 | SMIM15 | LZE6T | Human | Esophagus | ESCC | 3.29e-09 | 7.46e-01 | 0.0845 |
| 643155 | SMIM15 | P1T-E | Human | Esophagus | ESCC | 8.99e-11 | 6.67e-01 | 0.0875 |
| 643155 | SMIM15 | P2T-E | Human | Esophagus | ESCC | 1.90e-50 | 8.81e-01 | 0.1177 |
| 643155 | SMIM15 | P4T-E | Human | Esophagus | ESCC | 7.95e-37 | 8.83e-01 | 0.1323 |
| 643155 | SMIM15 | P5T-E | Human | Esophagus | ESCC | 1.88e-18 | 4.34e-01 | 0.1327 |
| 643155 | SMIM15 | P8T-E | Human | Esophagus | ESCC | 2.26e-38 | 7.30e-01 | 0.0889 |
| 643155 | SMIM15 | P9T-E | Human | Esophagus | ESCC | 7.09e-20 | 5.26e-01 | 0.1131 |
| 643155 | SMIM15 | P10T-E | Human | Esophagus | ESCC | 9.00e-23 | 3.81e-01 | 0.116 |
| 643155 | SMIM15 | P11T-E | Human | Esophagus | ESCC | 6.48e-22 | 9.00e-01 | 0.1426 |
| 643155 | SMIM15 | P12T-E | Human | Esophagus | ESCC | 1.11e-31 | 7.20e-01 | 0.1122 |
| Page: 1 2 3 4 5 6 7 |
| Tissue | Expression Dynamics | Abbreviation |
| Colorectum (GSE201348) |  | FAP: Familial adenomatous polyposis |
| CRC: Colorectal cancer | ||
| Colorectum (HTA11) |  | AD: Adenomas |
| SER: Sessile serrated lesions | ||
| MSI-H: Microsatellite-high colorectal cancer | ||
| MSS: Microsatellite stable colorectal cancer | ||
| Esophagus | 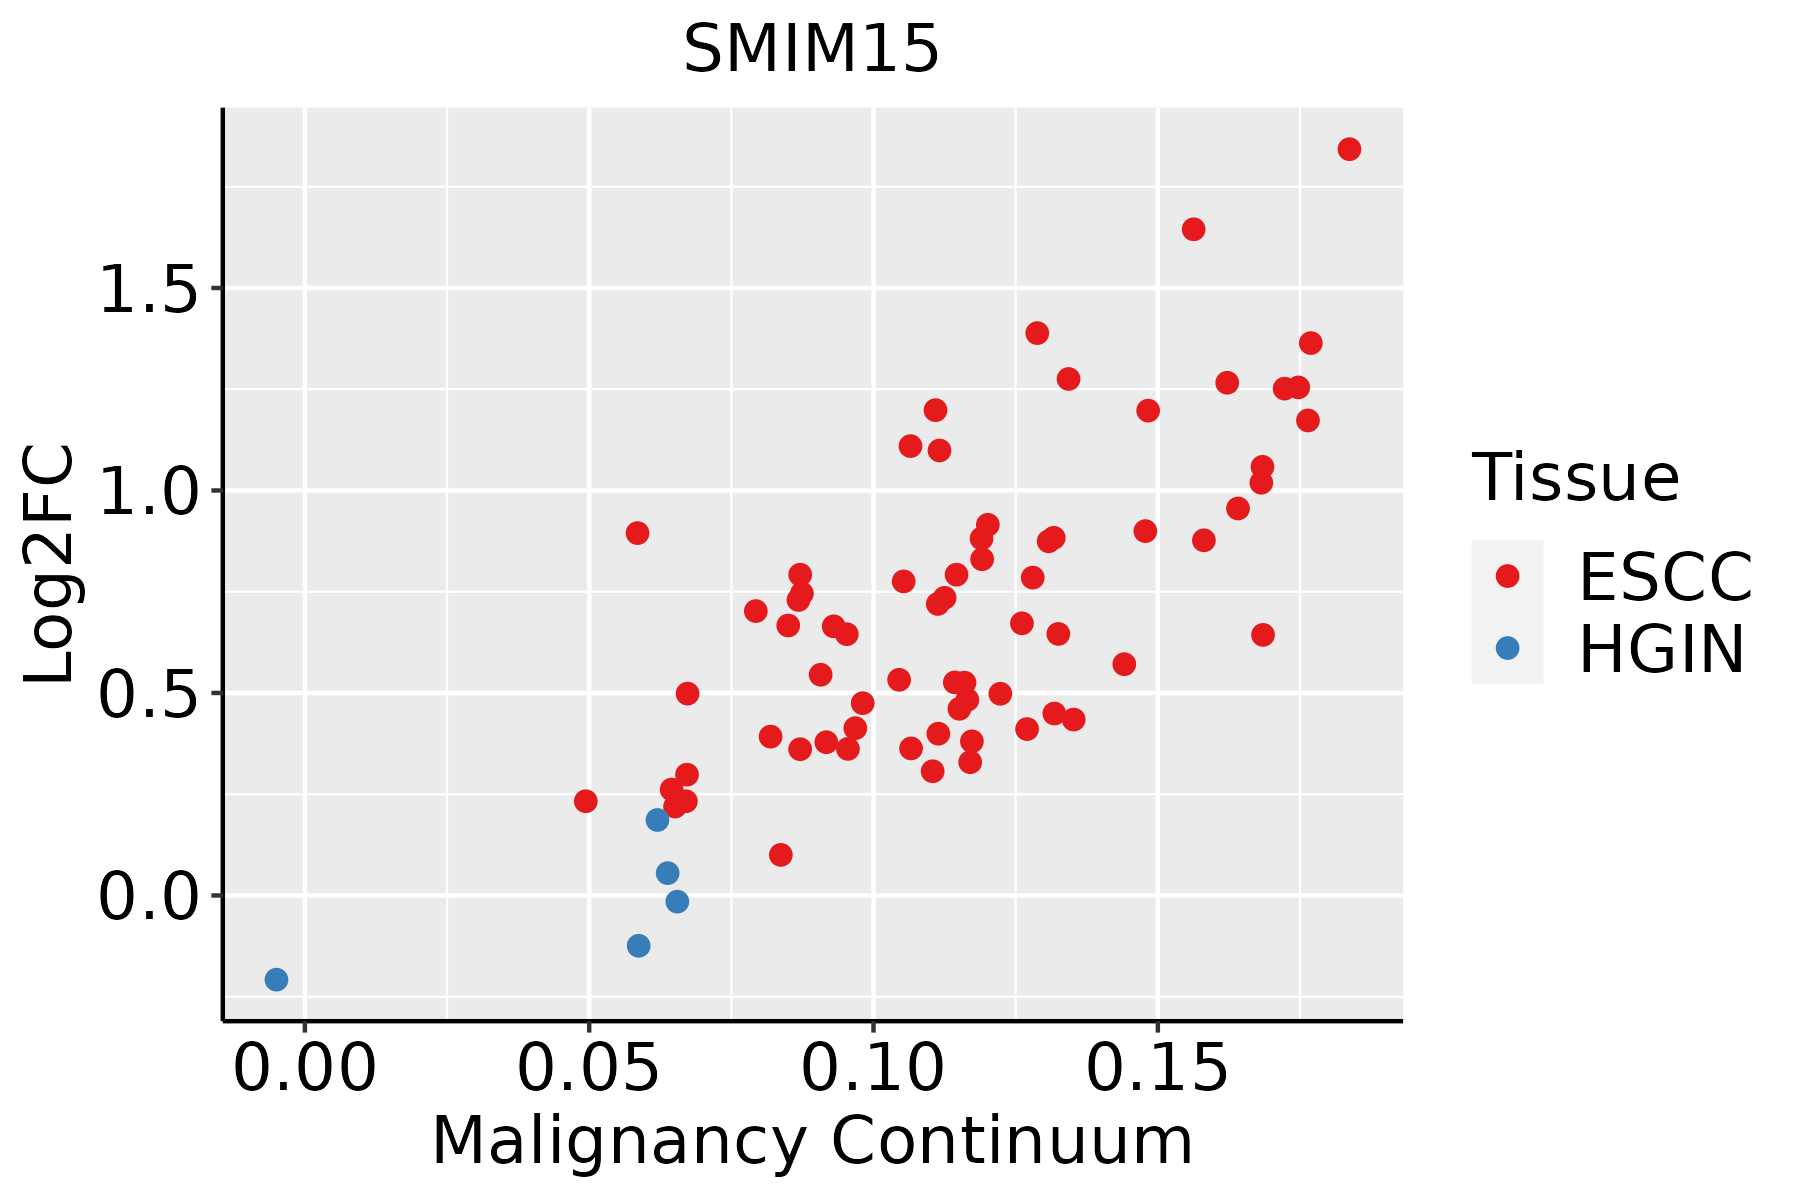 | ESCC: Esophageal squamous cell carcinoma |
| HGIN: High-grade intraepithelial neoplasias | ||
| LGIN: Low-grade intraepithelial neoplasias | ||
| Liver |  | HCC: Hepatocellular carcinoma |
| NAFLD: Non-alcoholic fatty liver disease | ||
| Oral Cavity | 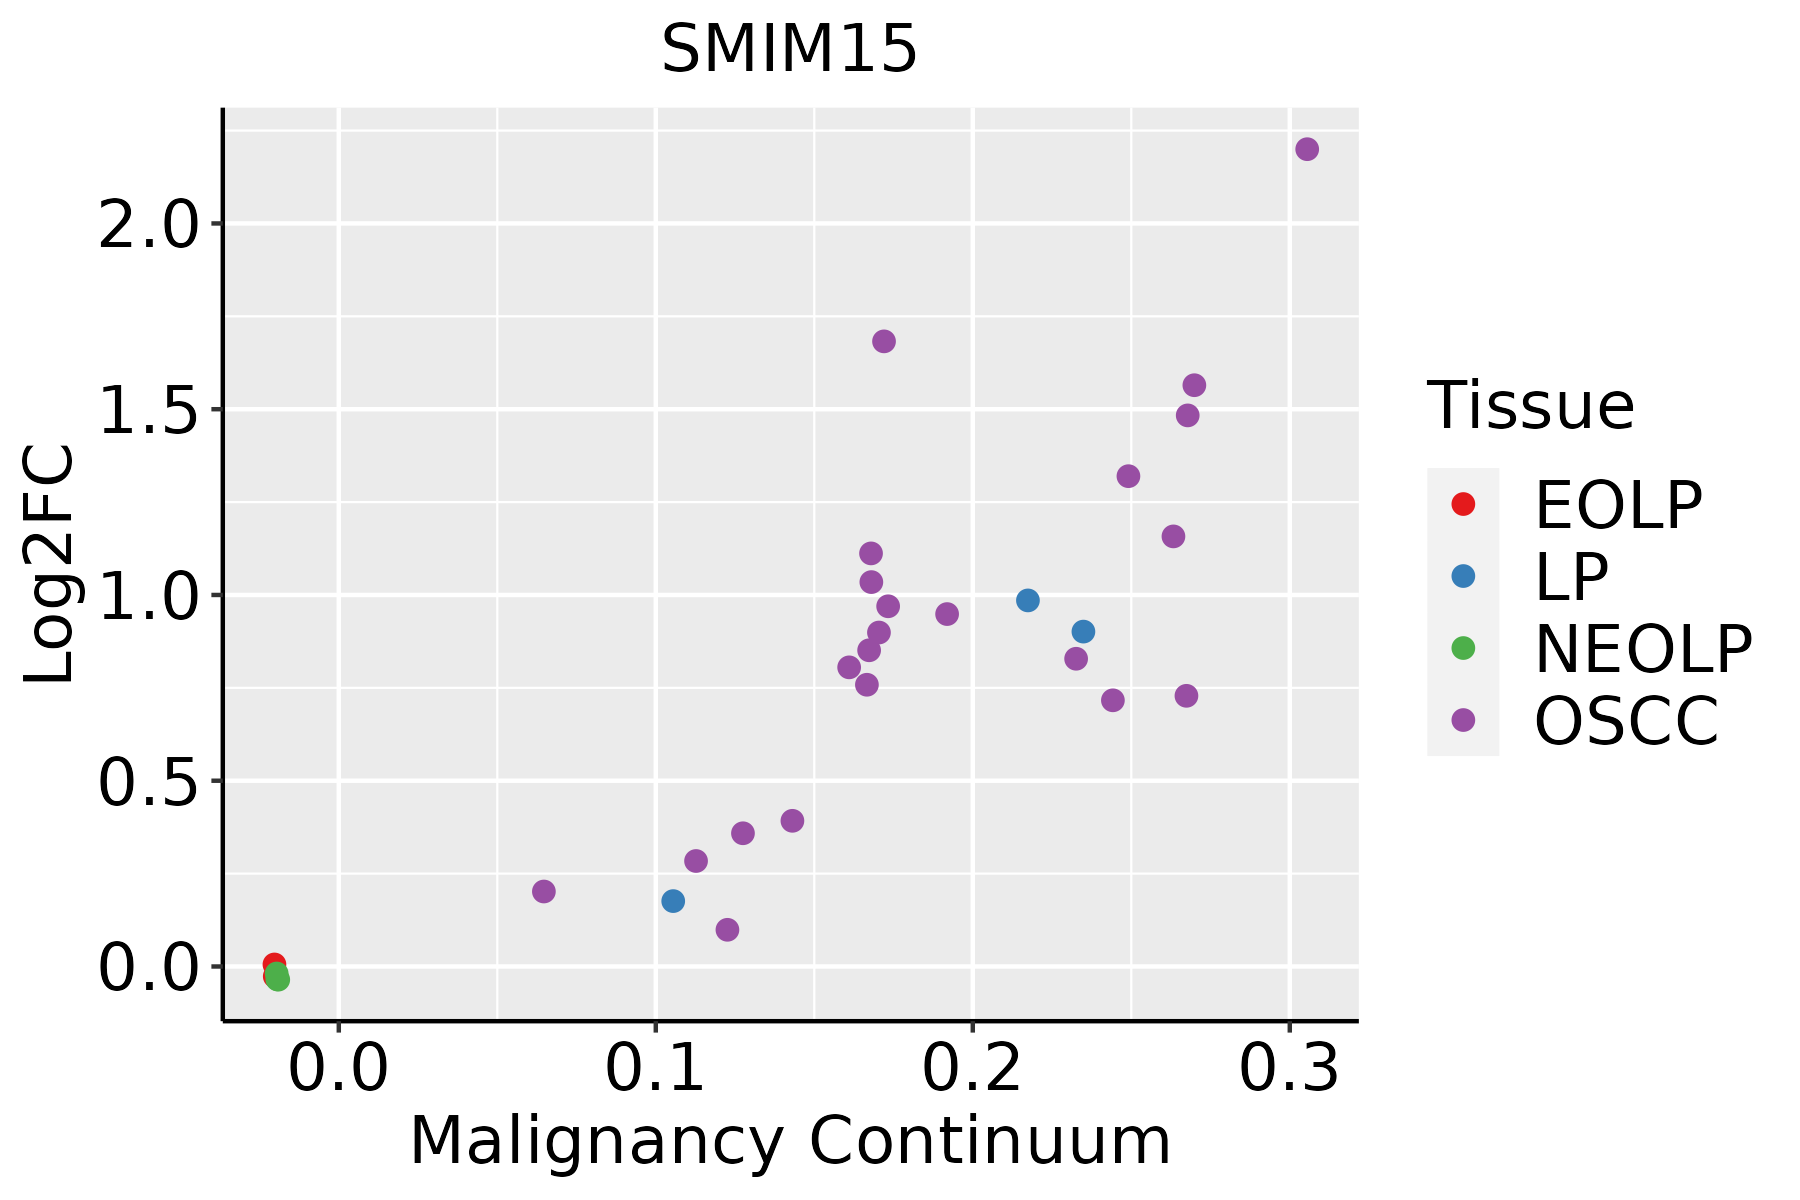 | EOLP: Erosive Oral lichen planus |
| LP: leukoplakia | ||
| NEOLP: Non-erosive oral lichen planus | ||
| OSCC: Oral squamous cell carcinoma | ||
| Skin | 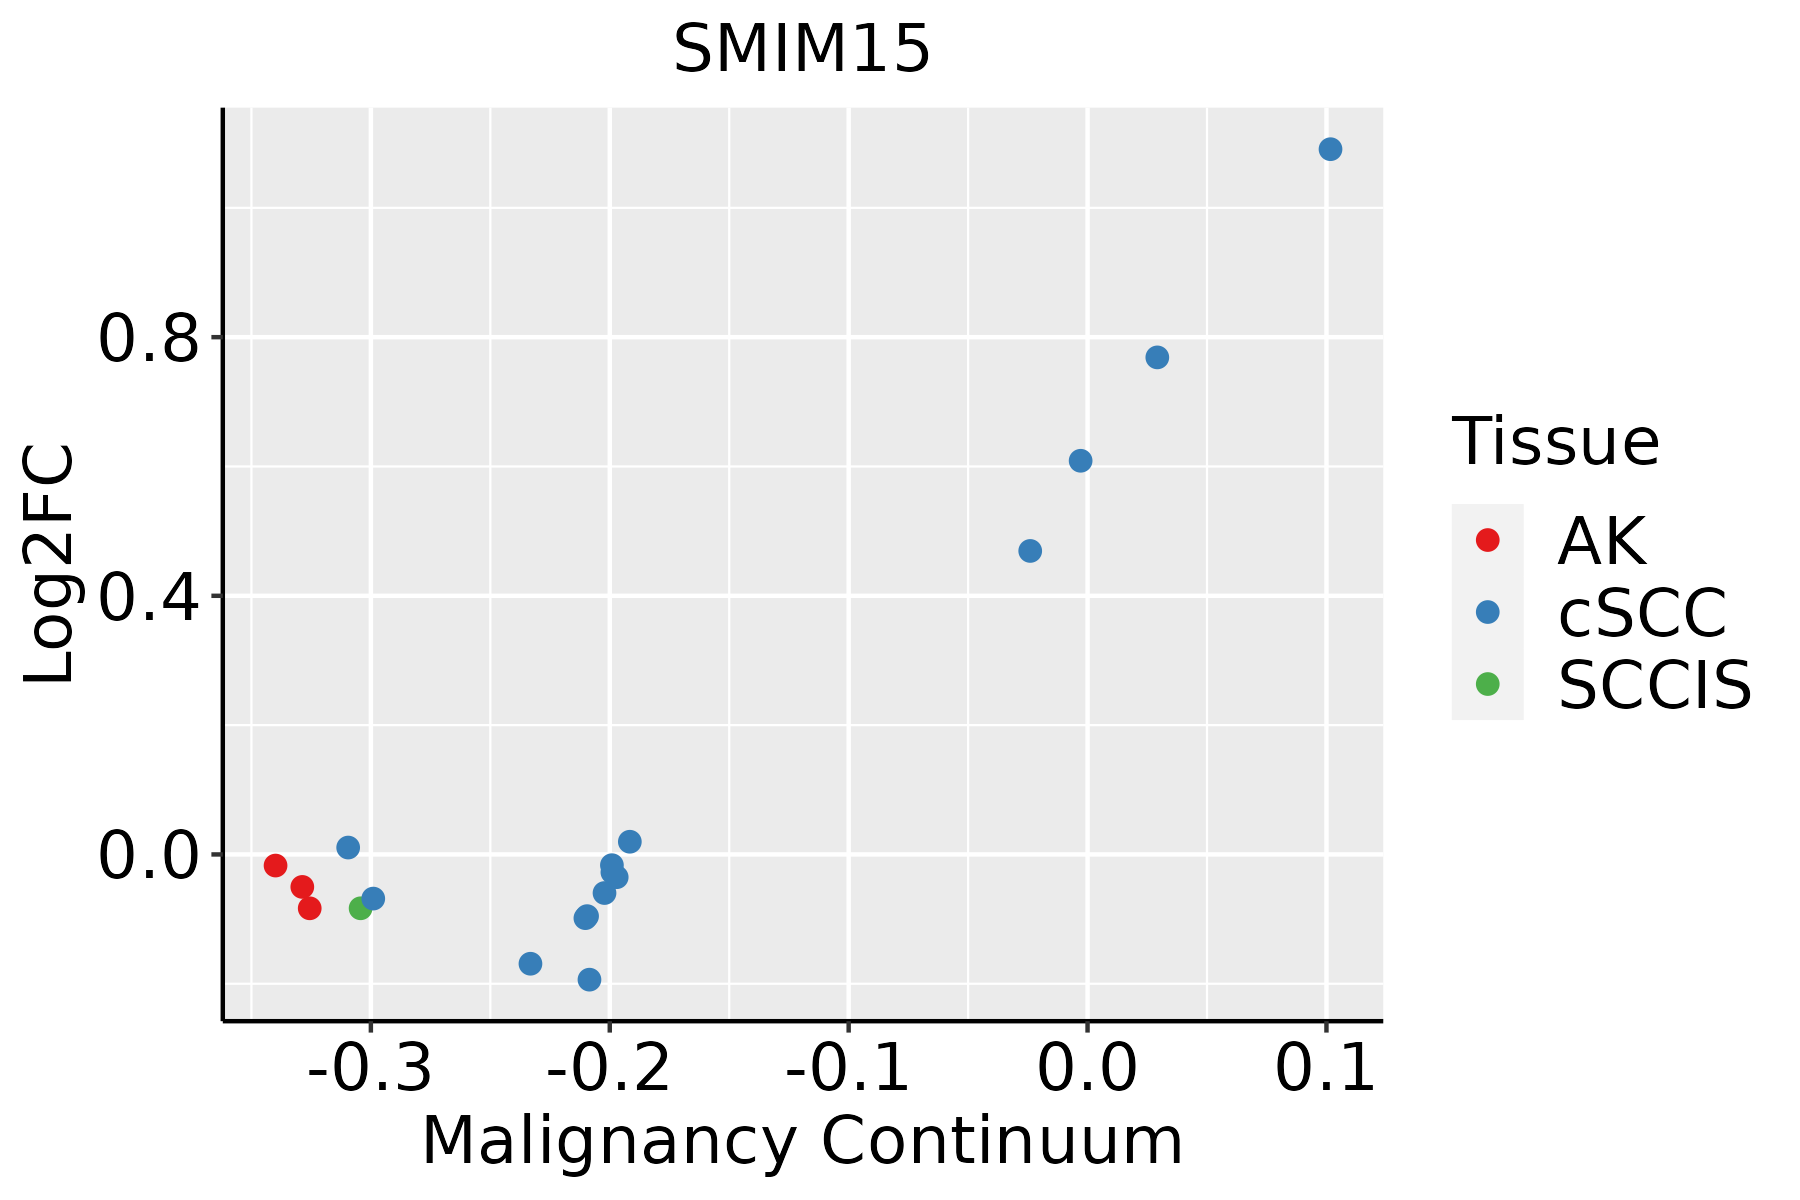 | AK: Actinic keratosis |
| cSCC: Cutaneous squamous cell carcinoma | ||
| SCCIS:squamous cell carcinoma in situ | ||
| Thyroid | 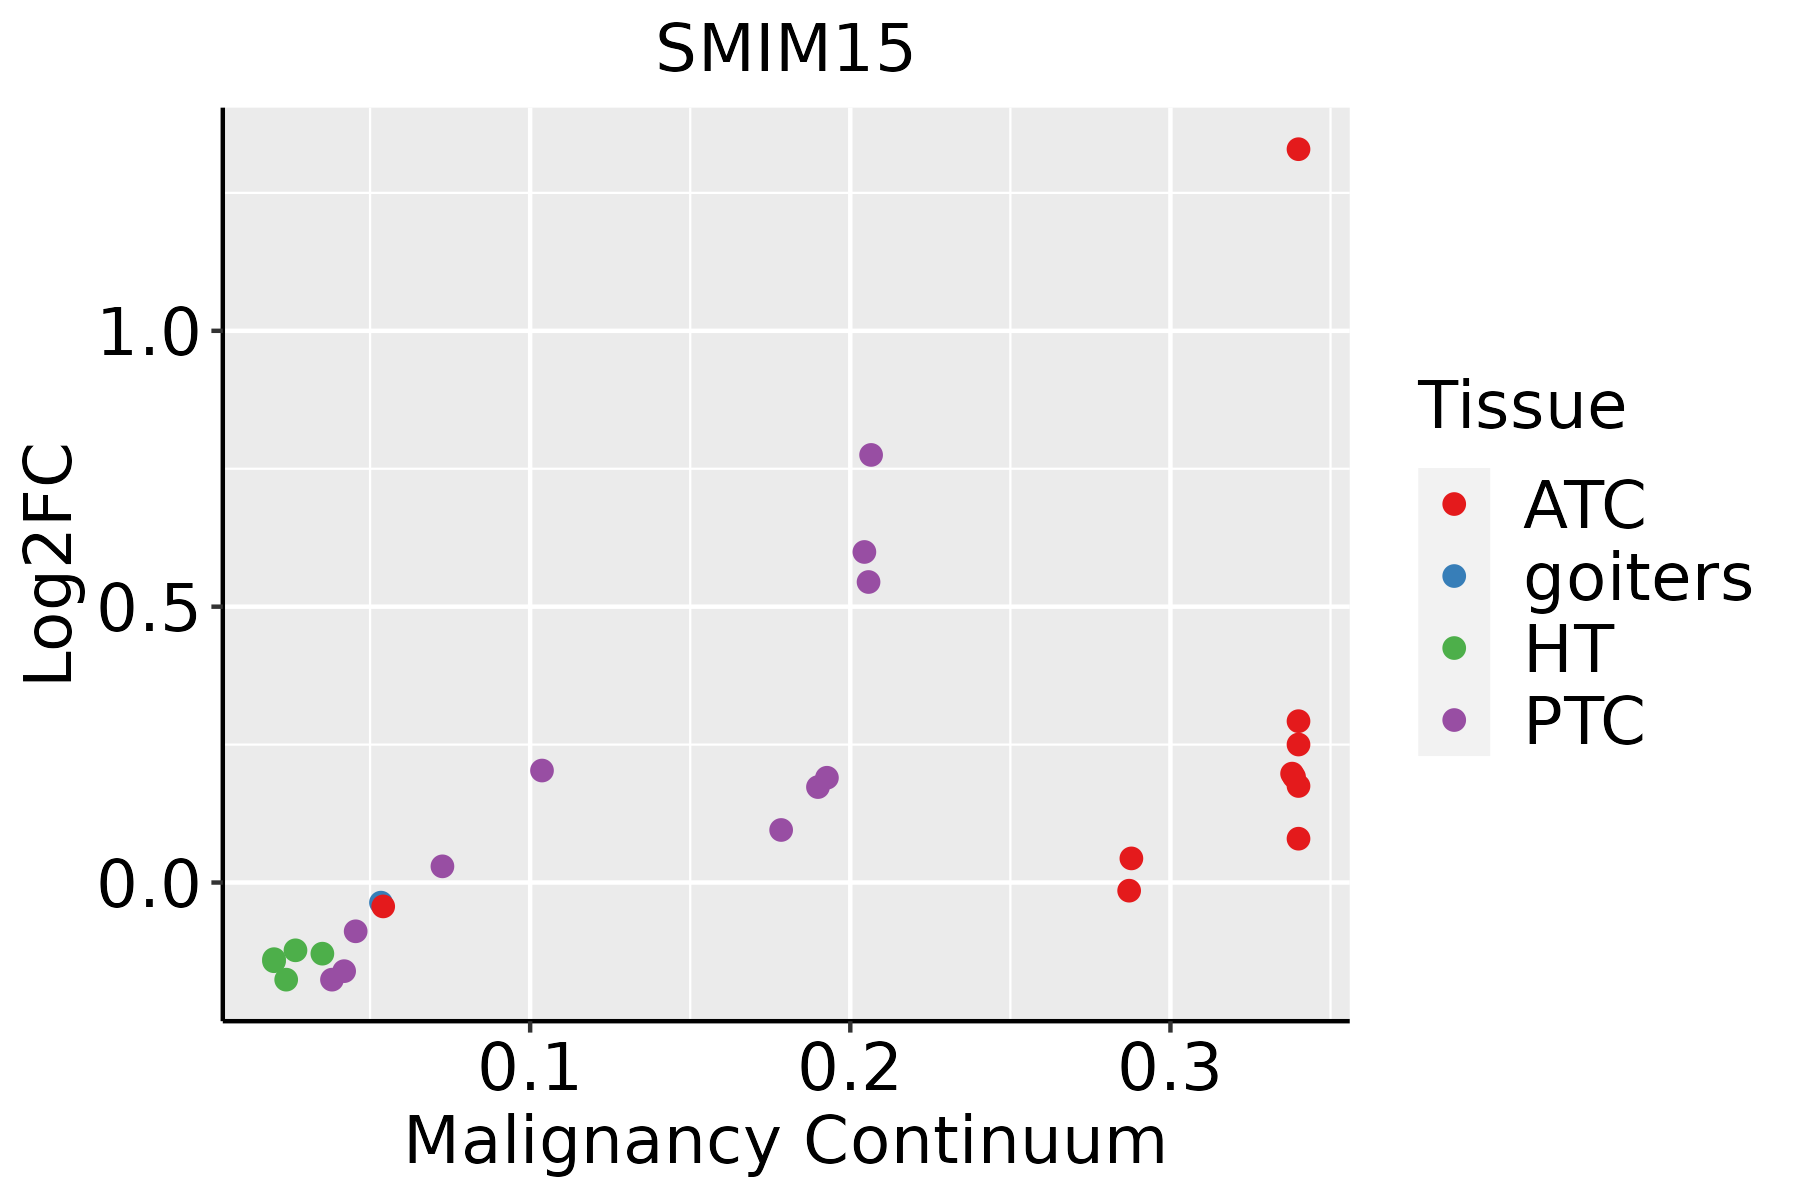 | ATC: Anaplastic thyroid cancer |
| HT: Hashimoto's thyroiditis | ||
| PTC: Papillary thyroid cancer |
| ∗log2FC in expression of this searched gene in stem-like cells from each diseased tissue sample relative to stem-like cells in normal samples in each tissue plotted against the malignancy continuum. Samples are colored based on if they are from different disease stage. |
Top |
Malignant transformation related pathway analysis |
| Find out the enriched GO biological processes and KEGG pathways involved in transition from healthy to precancer to cancer |
| Tissue | Disease Stage | Enriched GO biological Processes |
| Colorectum | AD |  |
| Colorectum | SER |  |
| Colorectum | MSS |  |
| Colorectum | MSI-H |  |
| Colorectum | FAP |  |
| ∗Top 15 enriched GO BP terms are showed in the bar plot of each disease state in each tissue. Each row represents a significant GO biological process which is colored according to the -log10(p.adjust). |
| Page: 1 2 3 4 5 6 7 8 9 |
| GO ID | Tissue | Disease Stage | Description | Gene Ratio | Bg Ratio | pvalue | p.adjust | Count |
| Page: 1 |
| Pathway ID | Tissue | Disease Stage | Description | Gene Ratio | Bg Ratio | pvalue | p.adjust | qvalue | Count |
| Page: 1 |
Top |
Cell-cell communication analysis |
| Identification of potential cell-cell interactions between two cell types and their ligand-receptor pairs for different disease states |
| Ligand | Receptor | LRpair | Pathway | Tissue | Disease Stage |
| Page: 1 |
Top |
Single-cell gene regulatory network inference analysis |
| Find out the significant the regulons (TFs) and the target genes of each regulon across cell types for different disease states |
| TF | Cell Type | Tissue | Disease Stage | Target Gene | RSS | Regulon Activity |
| ∗The dot plots of a searched regulon are shown for all cell subpopulations in each disease state of each tissue based on the regulon specific score inferred using pySCENIC and by calculating the average expression. |
| Page: 1 |
Top |
Somatic mutation of malignant transformation related genes |
| Annotation of somatic variants for genes involved in malignant transformation |
| Hugo Symbol | Variant Class | Variant Classification | dbSNP RS | HGVSc | HGVSp | HGVSp Short | SWISSPROT | BIOTYPE | SIFT | PolyPhen | Tumor Sample Barcode | Tissue | Histology | Sex | Age | Stage | Therapy Types | Drugs | Outcome |
| SMIM15 | SNV | Missense_Mutation | rs201138177 | c.181C>T | p.Arg61Cys | p.R61C | Q7Z3B0 | protein_coding | tolerated(0.2) | possibly_damaging(0.656) | TCGA-AA-3663-01 | Colorectum | colon adenocarcinoma | Male | <65 | I/II | Unknown | Unknown | SD |
| SMIM15 | SNV | Missense_Mutation | novel | c.140N>C | p.Met47Thr | p.M47T | Q7Z3B0 | protein_coding | tolerated(0.21) | benign(0.017) | TCGA-AA-3947-01 | Colorectum | colon adenocarcinoma | Female | <65 | I/II | Unknown | Unknown | SD |
| SMIM15 | SNV | Missense_Mutation | novel | c.8N>C | p.Asp3Ala | p.D3A | Q7Z3B0 | protein_coding | deleterious(0.04) | benign(0.325) | TCGA-AJ-A5DW-01 | Endometrium | uterine corpus endometrioid carcinoma | Female | <65 | I/II | Unknown | Unknown | SD |
| SMIM15 | SNV | Missense_Mutation | novel | c.67N>A | p.Leu23Ile | p.L23I | Q7Z3B0 | protein_coding | tolerated(0.23) | probably_damaging(0.978) | TCGA-AP-A1DK-01 | Endometrium | uterine corpus endometrioid carcinoma | Female | <65 | I/II | Unknown | Unknown | SD |
| SMIM15 | SNV | Missense_Mutation | novel | c.51N>T | p.Lys17Asn | p.K17N | Q7Z3B0 | protein_coding | tolerated(0.09) | benign(0.052) | TCGA-AP-A1DV-01 | Endometrium | uterine corpus endometrioid carcinoma | Female | <65 | I/II | Unknown | Unknown | SD |
| SMIM15 | SNV | Missense_Mutation | novel | c.116N>C | p.Val39Ala | p.V39A | Q7Z3B0 | protein_coding | tolerated(0.09) | benign(0) | TCGA-AX-A06F-01 | Endometrium | uterine corpus endometrioid carcinoma | Female | <65 | III/IV | Chemotherapy | carboplatin | SD |
| SMIM15 | SNV | Missense_Mutation | novel | c.219N>T | p.Lys73Asn | p.K73N | Q7Z3B0 | protein_coding | tolerated(0.08) | probably_damaging(0.991) | TCGA-AX-A1CE-01 | Endometrium | uterine corpus endometrioid carcinoma | Female | <65 | I/II | Unspecific | Paclitaxel | SD |
| SMIM15 | SNV | Missense_Mutation | novel | c.156N>T | p.Glu52Asp | p.E52D | Q7Z3B0 | protein_coding | tolerated(0.12) | benign(0.003) | TCGA-85-A4CL-01 | Lung | lung squamous cell carcinoma | Male | >=65 | I/II | Unknown | Unknown | SD |
| SMIM15 | SNV | Missense_Mutation | c.28N>C | p.Tyr10His | p.Y10H | Q7Z3B0 | protein_coding | tolerated(0.15) | probably_damaging(0.994) | TCGA-BR-8487-01 | Stomach | stomach adenocarcinoma | Female | <65 | I/II | Unknown | Unknown | SD |
| Page: 1 |
Top |
Related drugs of malignant transformation related genes |
| Identification of chemicals and drugs interact with genes involved in malignant transfromation |
| (DGIdb 4.0) |
| Entrez ID | Symbol | Category | Interaction Types | Drug Claim Name | Drug Name | PMIDs |
| Page: 1 |

Copyright 2023-Present -The University of Texas Health Science Center at Houston |